
IMAGE PROCESSING AND MACHINE LEARNING FOR THE
DIAGNOSIS OF MELANOMA CANCER
Arushi Raghuvanshi
1
and Marek Perkowski
Department of Electrical and Computer Engineering, Portland State University, Portland, OR 97207, U.S.A.
1
Jesuit High School, 9000 SW Beaverton Hillsdale Hwy, Portland, OR 97225, U.S.A.
Keywords: Melanoma, Skin Cancer, Image processing, Machine Learning, Medical Diagnosis.
Abstract: Melanoma cancer is one of the most dangerous and potentially deadly types of skin cancer; however, if
diagnosed early, it is nearly one-hundred percent curable (UnderstMel09). Here we propose an efficient
system which helps with the early diagnosis of melanoma cancer. Different image processing techniques
and machine learning algorithms are evaluated to distinguish between cancerous and non-cancerous moles.
Two image feature databases were created: one compiled from a dermatologist-training tool for melanoma
from Hosei University and the other created by extracting features from digital pictures of lesions using a
software called Skinseg. We then applied various machine learning techniques on the image feature
database using a Python-based tool called Orange. The experiments suggest that among the methods tested,
the combination of Bayes machine learning with Hosei image feature extraction is the best method for
detecting cancerous moles. Then, using this method, a computer tool was developed to return the probability
that an image is cancerous. This is a very practical application as it allows for at-home findings of the
probability that a mole is cancerous. This does not replace visits to a doctor, but provides early information
that allows people to be proactive in the diagnosis of melanoma cancer.
1 INTRODUCTION
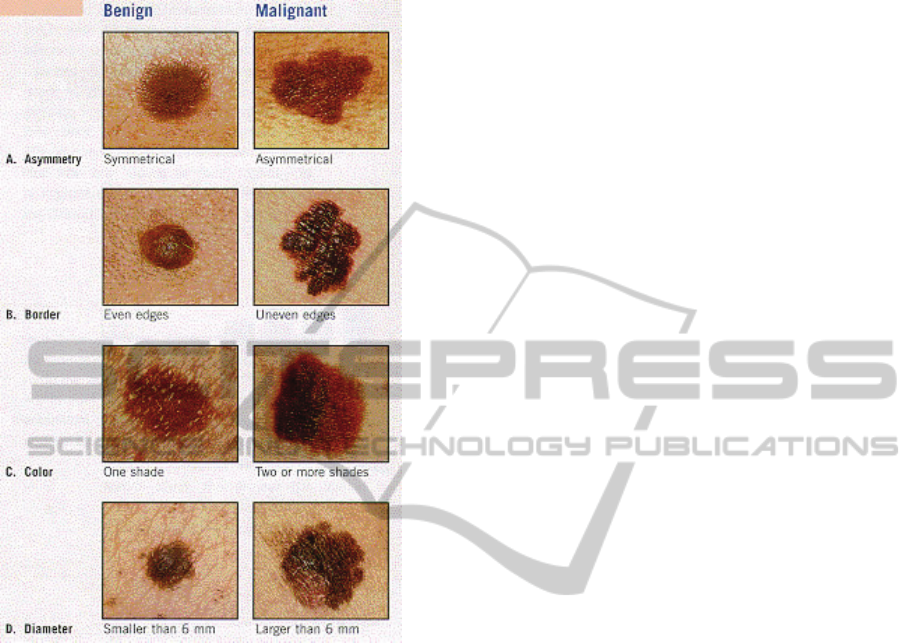
The warning signs of melanoma cancer can be
summarized by the ABCDE method as described by
the Skin Cancer Foundation (UnderstMel09). Each
letter in ABCDE stands for a feature of a mole that
indicates that it might be malignant: Asymmetry,
Boarder irregularity, Colour, Diameter, and
Evolving (Fig. 1). A mole that evolves, or changes at
all in color, shape, or size, is another warning sign of
melanoma. (UnderstMel09). The diagnosis of
melanoma is not based on just one of these factors
but a combination of all of them.
Many dermatologists use a surgical method,
called an excisional biopsy, to further test for
melanoma at the microscopic level. Ideally, the mole
would be noticed early on, so the cancer would still
be isolated in the mole and not have spread to the
lymph nodes. If it is noticed at this stage, only one
surgery is needed to cure the body of cancer. The
problem is, however, that often moles are not
diagnosed until the cancer has developed past this
stage. A device that would give simple feedback on
moles, therefore, would be beneficial in helping
patients check their moles at home and therefore
encouraging early diagnosis.
A new technology that is beginning to be
developed is using imaging techniques to diagnose
melanoma (Stevens09). Although a good concept,
current imaging technologies are not for individual
home use. By making the system more accessible to
individual users, the process can help in the early
diagnosis of melanoma.
Overall, the process involves image capturing,
image processing, feature extraction, and machine
learning for the diagnosis of melanoma. Although
these techniques cannot replace surgical diagnosis
by doctors, they provide a foundation for the early
diagnosis of melanoma. Because early diagnosis is
so important, this process has very practical
applications in the real world and could potentially
be used to save lives.
The first step in the imaging process is image
capturing or image acquisition. One method of
image acquisition some dermatologists use is a
method called dermoscopy, which allows them to
obtain an image which displays colors of the
epidermis, the dermoepidermal junction, and the
405
Raghuvanshi A. and Perkowski M..
IMAGE PROCESSING AND MACHINE LEARNING FOR THE DIAGNOSIS OF MELANOMA CANCER.
DOI: 10.5220/0003173504050410
In Proceedings of the International Conference on Biomedical Electronics and Devices (BIODEVICES-2011), pages 405-410
ISBN: 978-989-8425-37-9
Copyright
c
2011 SCITEPRESS (Science and Technology Publications, Lda.)
papillary dermis not visible to the naked eye.
(Stanganelli08).
Figure 1: Distinguishing using ABCD method, Source:
The Ear, Nose, and Throat Alliance:
http://www.allianceent.net/index.php?section=3&pid
=198.
Before extracting features, it is important to
perform some pre-processing and noise reduction to
enhance the images. One technique for noise
reduction is combining many images by frame
averaging (Bosdogianni99). Another technique,
called neighborhood averaging, involves adding
together the color or brightness values for pixels in a
certain area and then dividing by the number of
pixels in that area. This average value is then used to
construct a new image with less noise. Another type
of neighborhood averaging, involves replacing each
pixel with the average of its neighbors
(Bosdogianni99). Neighborhood averaging reduces
noise; however, it also blurs edges, displaces
boundaries, and reduces contrast. Other image
processing techniques can be used to correct non-
uniform illumination (Russ95). One currently
available software uses image processing and noise-
reduction to digitally remove hair from images of
moles. To do this it identifies the dark hair locations
by a generalized grayscale closing operation and
makes sure the shape of the hair pixels are thin and
long structures. It then replaces the hair pixels by a
bilinear interpolation and levels the replaced pixels
with an adaptive median filter. (DermWeb07)
The next step is feature extraction. For the
purposes of our project, the features we would need
are the ones described by the ABCDE method. Two
important first steps in feature extraction are edge
detection and image segmentation (Bosdogianni99).
In image segmentation, we must divide up the image
into uniform regions. In order to do so, there are
many methods available, the simplest of which are
histogramming and thresholding (Bosdogianni99).
For an image of a mole, the histogram will usually
have two peaks. However, if the mole has multiple
colors, and therefore is possibly malignant, the
histogram would have three peaks, or one of the
peaks would not be well defined. Therefore, by
looking at the histogram, we can determine a
variation in color of the mole. Once the image is
thresholded, we know the points of the outer edge of
the image (Bosdogianni99). Using these points, we
can determine the perimeter of the mole and use an
integral function to find the area. By comparing the
perimeter to the area using some predefined
algorithm we can extract the asymmetry, border
irregularity, and diameter of a mole. Finally, given
multiple images over time and comparing their
features, we can determine if a mole is evolving. For
this project, however, we will focus on features in
one given point of time.
There are many available tools for feature
extraction. One tool is CVIPtools (CVIP06). We can
use this software for image processing and feature
extraction. This tool can do the segmentation of an
image using Fuzzy C Mean, Grey Level
Quantization, Histogram Thresholding, and many
more techniques. It can also preform edge detection,
and various transforms including Fast-Fourier
Transform, Hadamard, and Walsh. Finally, we can
use this tool to extract texture features, spectral
features, and for pattern classification and image
segmentation. (CVIP06) Other similar tools that can
be used for feature extraction or preprocessing of
images of moles are Dull Razor, Hosei tool, and
Skinseg (DermWeb07) (Hosei09) (Skinseg98).
After extracting the features, the next step is to
create a machine learning database. In this database,
we store the images, their features, and whether or
not they were cancerous as evaluated by trained
dermatologists using microscopic evaluation. Then,
BIODEVICES 2011 - International Conference on Biomedical Electronics and Devices
406
using the database, we perform machine learning
algorithms to determine patterns of cancerous moles.
In order to do this, we can use various methods one
of which is decision trees. Using this approach,
based on the features in the database we create a
decision tree. This can be done by ID3 top-down
method, which is a greedy algorithm. In this method,
construction of a decision tree starts by picking a
key variable (feature) to segment the database and
then applying other features one by one until all the
elements have been mapped to the
outcome/decision. In order to choose variables that
optimize the decision tree, we can look at the
entropy of each variable. The entropy can be found
by the following equation, and we always choose the
variable with the highest entropy gain: H(S) = -p+
log2(p+) – p-log2(p-) where p+ is the probability
that the variable is positive and p- is the probability
that the variable is negative. Then, using this
decision tree, we can predict whether an image not
in the current database will be cancerous.
(DeLaCruz09). Other methods of machine learning
are neural networks, constructive induction, and
support vector machines.
2 IMAGE ACQUISITION
The first step in this process was to acquire a set of
preliminary images for the machine learning
process. Some of these images needed to be of
cancerous moles while others of benign moles. The
images we used are standard images taken from a
normal commercial household camera. We chose to
use images from a normal camera because it fits
with our low-cost application criteria and is
accessible to the common person. We contacted
local dermatologists and collected some images, and
then collected more from dermatologists’ training
sites on the web (Stevens09). Our overall database
included 150 images with 30% of those for benign
moles, and 70% as cancerous moles.
3 FEATURE EXTRACTION
The next step in the process was feature extraction.
We explored a variety of different tools for feature
extraction. The first tool we experimented with was
Skinseg, a tool developed by Wright State
University. This tool segments a given image to
isolate the portion of interest (i.e. the mole) and
extracts a set of features from this segment.
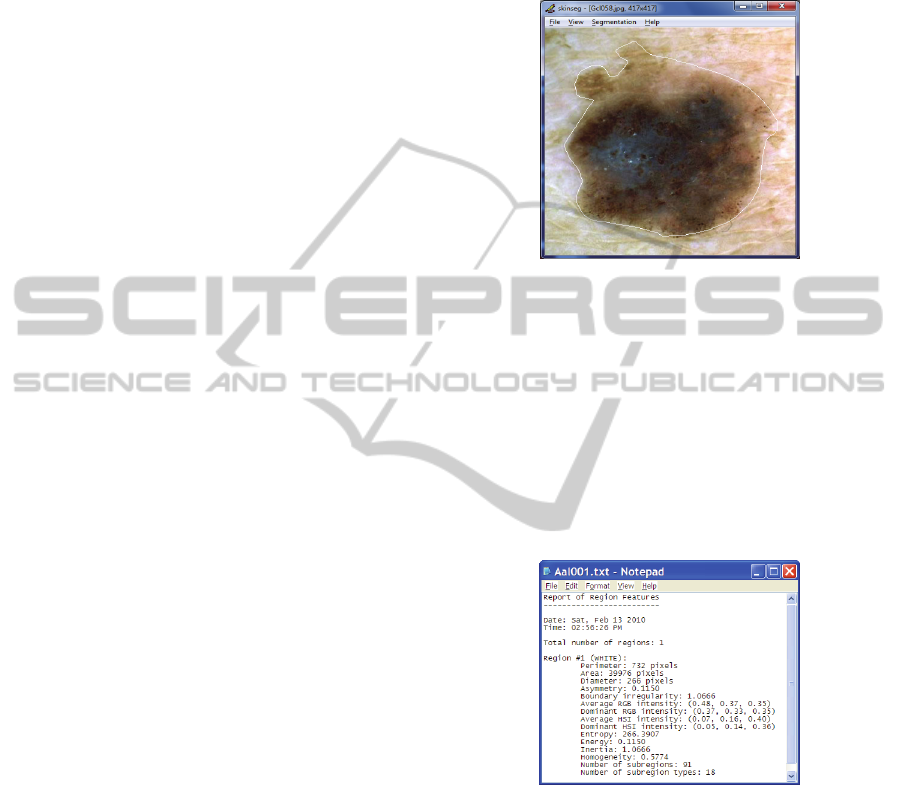
From the images collected, we opened each
image individually within the Skinseg program and
used it to identify the region of interest (mole) using
available methods of segmentation. Fig. 2 shows a
segmented picture of the mole after automatic
segmentation.
Figure 2: Segmented Image using Skinseg tool.
Once the image was segmented, the tool allowed
us to view the features and save them to a text file,
as illustrated in Fig. 3.
Once all of the feature files were saved, we used
a Python script to read all the files and create a
single database (skinsegdb.tab) of the selected
extracted features. The database contained one row
for each image with all the feature values separated
by tabs (Fig 4). This was the format required by the
machine learning tools in the next part of the project.
Figure 3: Extracted Image Features using Skinseg tool.
Once all of the feature files were saved, we used
a Python script to read all the files and create a
single database (skinsegdb.tab) of the selected
extracted features. The database contained one row
for each image with all the feature values separated
by tabs (a partial snapshot of the database is shown
in Fig. 4). This was the format required by the
machine learning tools in the next part of the project.
The second tool we used was the Hosei Tool,
created by Hosei University in Japan. This is a
learning tool for dermatologists, and it has
predetermined features for given images. Most
IMAGE PROCESSING AND MACHINE LEARNING FOR THE DIAGNOSIS OF MELANOMA CANCER
407
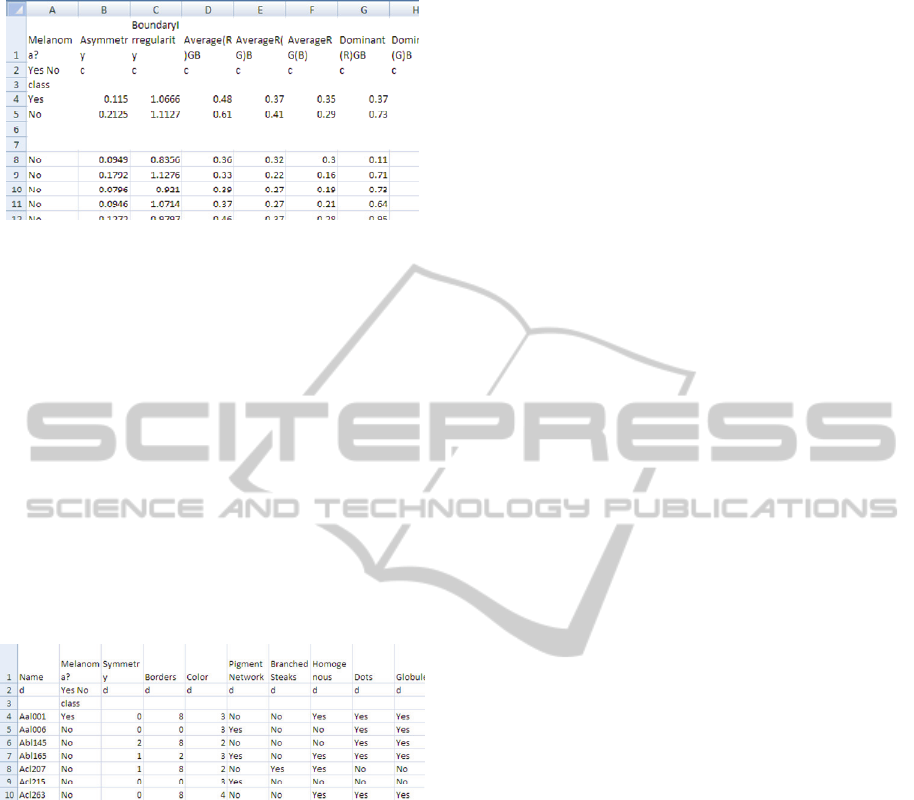
Figure 4: Partial snapshot of database of features extracted
from images using Skinseg tool.
likely, these features were determined by doctor
inspection. Using this tool website, we retrieved a
set of pictures along with their image features.
These features included Symmetry, Borders, Color,
Pigment Network, Branched Steaks, Homogenous,
Dots & Globules, Atypical Pigment, Blue Whitesh
Veil, Atypical Vascular Pattern, Irregular Streaks,
Irregular Pigmentation and Regression Structures.
We then created the second database (hoesidb.tab)
using the similar process as for Skinseg feature
database. The partial snapshot of hoseidb.tab is
shown in Fig. 5. The database contained one row for
each image with all the feature values separated by
tabs. This was the format required by the machine
learning tools in the next part of the project.
Figure 5: Partial snapshot of the database of features
extracted from images using Hosei tool.
We also explored a few other tools, but did not
use them for the data gathering and comparison part.
CVIP tool, developed by Southern Illinois
University at Edwardsville, is very powerful, but
mostly interactive, so we did not use it for this
project. We realized that it is possible to create a
code which does the feature extraction in a more
automatic way, but we chose to use Skinseg and the
Hosei tool instead (Skinseg98) (Hosei09). This can
be used in future research work. Mole Expert Micro
is a commercial software for the feature extraction
of melanoma images. We were able to receive an
evaluation version of this software. Unfortunately,
this software required a value for the number of
pixels per millimeter of the image. Since this data
was not available for our images, we could not use
this tool.
Open CV tool from Intel would be very powerful
in completely automating the process of feature
extraction; however, it is not specifically designed
for melanoma images. This would require adapting
it and customizing it to this project. In the future, we
plan to use Open CV or get the source code for
Skinseg in order to completely automate the feature
extraction process for deployment in a website.
4 MACHINE LEARNING
Once we compiled the data of the extracted features
into the database, we used this database for
application of machine learning algorithms. There
are a variety of methods for machine learning that
we tested:
1. Majority Learning: This is a basic technique
which gives a probability of a given mole
being cancerous based on the probability that
any given mole in the training set is
cancerous.
2. Bayes Learning: In Bayes learning, Bayesian
networks are created which represent the
relationship between a given feature and the
probability that the mole is cancerous.
Combined, these networks can give a
probability for whether or not the mole is
cancerous.
3. Decision Trees: This machine learning
method creates a tree based on the training
data. There are a variety of different
techniques for how to create the best tree and
to distinguish which features are important
and which are not. In this method the leaves
of the tree describe positive or negative
decisions.
4. kNN (Neural Nets): Neural Networks are
made of interconnecting neurons and operate
based on the model of biological neural
networks.
In order to test these methods we used a toolkit
called Orange which is Python based (Orange09).
We wrote code in this program to test the percent
accuracies of different sets of data for a given
machine learning method and feature extraction
method.
5 RESULTS
We ran four different machine learning methods
(Majority, Bayes, Decision Tree & kNN) on the two
set of the databases created using Skinseg and Hosei
BIODEVICES 2011 - International Conference on Biomedical Electronics and Devices
408
tools and measured the accuracy of the diagnosis.
For the purposes of the experiment, the Orange tool
was used to segment the database into the ‘learning
set’ and ‘test set’. The ‘learning set’ allows the
algorithm to learn while ‘test set’ is used to test the
accuracy of the learning method. For example, if the
database had 150 entries, then 2 entries could be the
test set while 148 entries are used for learning. This
could also be specified as a percentage. In the
practical implementation of the melanoma detection
tool using this method, the entire dataset becomes
the learning set. A new image submitted by the
patient is the test set for which the algorithm would
provide the probability of it being cancerous or
benign.
We ran the tests with multiple runs for each of
the two feature extraction tools (Hosei and Skinseg)
and the four machine learning methods (Majority
Learning, Naïve Bayes, Decision Tree, k-nearest-
neighbour) combination. Number of entries in the
‘test set’ ranged from 1 to 10, and then a final run
was made where ‘test set’ was kept at 10% of the
entries in the set. So for 150 entries, this was 15.
Then, for each set, we determined an average
accuracy from these 11 runs.
For Majority Learning method used on the
Skinseg and Hosei feature extraction databases, the
percentage accuracy was best when 2 entries were
taken out in ‘test set’. We noted that the method
performed the same for either of the two databases.
With Naïve Bayes learning method for the two
databases, the average accuracy was low for Skinseg
database, but is pretty good for the Hosei database. It
was interesting to note that with two entries in the
test set, the accuracy was good for this method as
well. Decision Tree learning method did not perform
well for either of the database as compared to other
methods. The k-Nearest-Neighbor learning method
showed better results for the Hosei database.
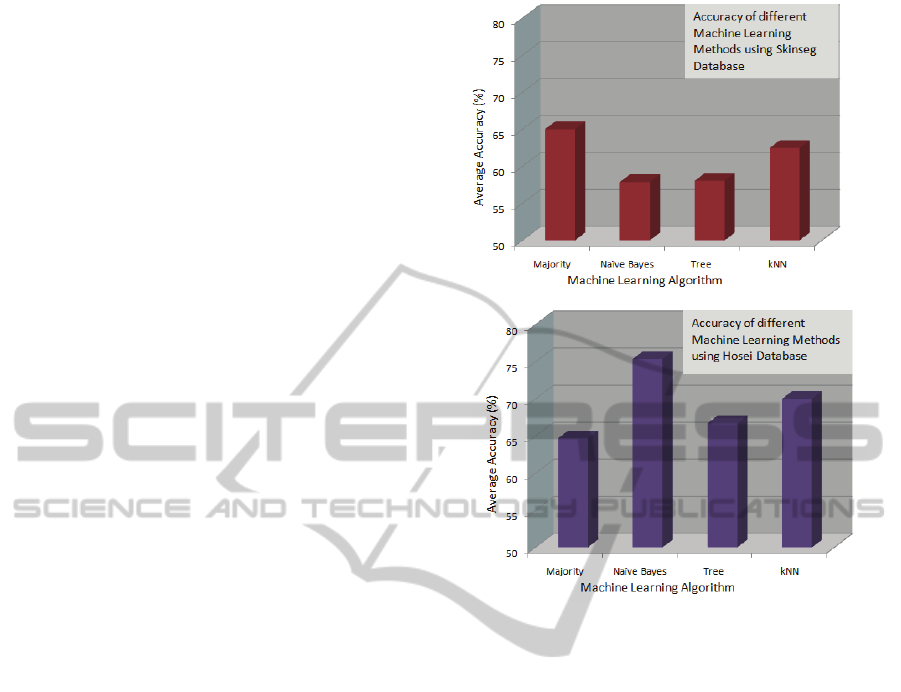
Fig 6 shows the summarized results from
comparison of the different learning methods over
the two databases (Hosei and Skinseg). Clearly, the
Naïve Bayes learning method used with the Hosei
database produced the best results.
6 CONCLUSIONS
Overall, we found that the Hosei tool for feature
extraction and the Bayes machine learning method
was the most effective combination for this
application. The Hosei tool gave better results than
Skinseg . This result was as expected, as errors in
the segmentations of moles were a factor in the
feature extraction from Skinseg but not from the
extraction using Hosei tool. the set of Hosei
Figure 6: Results of different Machine Learning methods
using each of the two databases.
methods, most of the machine learning methods
showed close results, but Bayes performed slightly
better with the Hosei tool. Overall we had expected
the accuracy to be more than what we found. The
average accuracy for the best methods was about
75% (Bayes/Hosei). It can be noted that our
learning database was not very big, and the accuracy
improves with a larger database. In order to improve
the results, we plan on repeating the experiment with
a different data set of additional images.
Furthermore, these results are good given that the
quality of the entrance data is low, because none of
the pictures were taken with a standard camera or
lighting.
In our experiment, we eliminated some variables
from the machine learning database such as the
number of pixels, the perimeter and area of a mole,
and the filename. We eliminated the pixels and
perimeter and area because the pictures were scaled
differently so including these variables would have
skewed the results. Of course we also eliminated the
file name. Along the same lines, one limitation of
my project was that we could not use size of the
mole, because every picture is taken with a different
scale. In the future, we can either set a standard size
IMAGE PROCESSING AND MACHINE LEARNING FOR THE DIAGNOSIS OF MELANOMA CANCER
409

or use a field size ring such as a quarter to
distinguish relative sizes. Also, we did not use the
‘evolution’ feature of the moles because we did not
have such images (evolving moles) available.
In discussing our results with the dermatologists
we got positive feedback for the use of the method
with some improvements in real world (Stevens09)
(Koppula09). We discussed the lack of using the
mole size in my experiment and Dr Koppula felt that
not using the size itself is not a big limitation, since
the size is often very misleading just by itself. It has
to be compared to other moles on the skin. Evolution
of the mole and changing size overtime is important,
and if this is captured in the machine learning
algorithm, this would be good. (Koppula09)
We are now using the information that we
gathered from this experiment to create a website
which will allow users at home to upload an image
of a mole and the website would return a probability
of how likely it is that this mole is cancerous. The
only limitation in this so far is that Skinseg, or the
feature extraction step, is not automated. We
continue to work on this project and automate this
step by either writing code in Open CV or finding
the source code for Skinseg. We are also planning to
create a smartphone application. This application
would allow a user to take an image of a mole with
the phone camera, upload it to the website, and get
immediate result from the website. If the resulting
probability is very high, the application could even
call the doctor. This would also allow us to collect
more images. If the user confirms the prognosis, we
can add the image to our learning database. This
would then improve the accuracy of the results. With
a larger set of database, we plan on using a parallel
computing architecture, such as CUDA, for faster
computation on the backend server. This would be
beneficial in providing real-time instant response to
the user.
ACKNOWLEDGEMENTS
Dr. A. Goshtasby, Wright State University on
Skinseg Image processing tool
Dr. Scott E Umbaughs, Southern Illinois University,
Edwardsville on CVIP tools
Ms. Iris Cheng, University of California Berkeley
for sharing her research on image processing
Dr. B.J. Shrestha, Missouri University of Science
and Technology
Dr. Kristin Stevens, MD, Dermatologist, Providence
Medical Group, Portland, OR
Dr. Sandhya Koppula, MD, Dermatologist, Cornell
Dermatology Clinic, Beaverton, OR
REFERENCES
Bosdogianni, Maria Petrou Panagiota. Image Processing:
The Fundamentals. New York: John Wiley & Sons,
LTD, 1999.
CVIPtools. Southern Illinois University. 7 November
2006.
DeLaCruz, Jomer and Dr. Dinesh Mital. “Classification of
Malignant Melanoma and Dysplastic
Nevi Using Image Analysis: A Visual Texture Approach.”
University of Medicine and Dentistry of New Jersey.
March 2009.
“DermWeb: Dull Razor.” UBC Dermatology Department.
21 March 2007. < http://www.
dermweb.com/dull_razor/>
Hosei on-line tool. Hosei University, Nov 2009
<https://b0112-web.k.hosei.ac.jp/DermoPerl/>
Koppula, Sandhya. MD. Personal Interview.
December 2009.
Stevens, Kristen. MD. Personal Interview.
December 2009.
Russ, John C. The Image Processing Handbook Second
Edition. Boca Raton: CRC, 1995.
Orange, Machine Learning tool. Artificial Intelligence
Laboratory, University of Ljubljana. 7 Nov 2009. <
http://www.ailab.si/orange/>.
Skinseg. Wright State University. 27 Oct
1998.<http://www.cs.wright.edu /~agoshtas/
skinseg.html>.
Stanganelli, Ignazio. “Dermoscopy.” Center for Cancer
Prevention, Italy. 27 May 2008.
<http://emedicine.medscape.com/article/1130783-
overview>
“Understanding Melanoma.” The Skin Cancer Foundation.
New York, New York. 13 December 2009.
<http://www.skincancer.org/
Melanoma/>.
BIODEVICES 2011 - International Conference on Biomedical Electronics and Devices
410
