
AN APPROACH TO SIGNIFICANCE ESTIMATION
FOR SIMULATION STUDIES
Andreas D. Lattner
1
, Tjorben Bogon
1,2
and Ingo J. Timm
2
1
Information Systems and Simulation, Institute of Computer Science
Goethe University Frankfurt, P.O. Box 11 19 32, 60054 Frankfurt, Germany
2
Business Informatics I, University of Trier, D-54286 Trier, Germany
Keywords:
Significance estimation, Simulation control, Statistical tests, Machine learning.
Abstract:
Simulation is widely used in order to evaluate system changes, to perform parameter optimization of sys-
tems, or to compare existing alternatives. Assistance systems for simulation studies can support the user by
performing monotonous tasks and keeping track of relevant results. In this paper we present an approach to
significance estimation in order to estimate, if – and when – statistically significant results are expected for
certain investigations. This can be used for controlling simulation runs or providing information to the user
for interaction. We introduce two approaches: one for the classification if significance is expected to occur
for given samples and another for the prediction of needed replications until significance might be reached.
Experiments are performed on normal distributions for an initial evaluation of the approaches.
1 INTRODUCTION
Nowadays, simulation is widely used in order to eval-
uate system changes, to perform parameter optimiza-
tion of systems, or to compare existing alternatives.
A clear advantage of simulation is that costs or dam-
ages on real systems can be avoided while investigat-
ing effects of changes or testing newly planned sys-
tems. Simulation is used in various domains, e.g., for
marine container terminal planning (Berth Planning
and Quay Resources Assignment Problem; (Lagan
´
a
et al., 2006)), multi-location transshipment problems
(Ekren and Heragu, 2008), and clinical resource plan-
ning (Swisher and Jacobson, 2002).
If complex systems with many parameters are
modeled, simulation studies can consist of a large
number of single simulation runs and a rather struc-
tured and disciplined evaluation has to be performed
in order to avoid getting lost in the vast of result data.
A support for the non-creative, monotonous tasks in
simulation is desirable.
In this work, we present one aspect of the current
research project AssistSim addressing a support for
the performance of simulation studies. The project
aims at supporting planning and execution of simula-
tion studies including simulation system control and
an automated analysis of intermediate simulation re-
sults. In this paper we present an approach to signifi-
cance estimation in order to estimate, if – and when –
statistically significant results are expected for certain
investigations.
The approach itself can also be applied in other
situations, i.e., beyond simulation – for any task
where two samples should be compared and where
preliminary samples should be used for estimation
how many further examples might be needed in order
to satisfy certain statistical properties.
The paper is structured as follows: In Section 2,
we discuss some approaches related to ours. The con-
text of the work and the framework of automated op-
eration and control of simulation experiments is pre-
sented in Section 3. In Section 4 we introduce our
approach to significance estimation. Experimental re-
sults are presented in Section 5. A conclusion as well
as ideas for further works are discussed in Section 6.
2 RELATED WORK
The automation of (simulation) experiments as well
as the application of data mining approaches to ex-
perimental settings and results has been addressed
by various researchers. Although the focus of this
work is set on simulation experiments, we also in-
177
D. Lattner A., Bogon T. and J. Timm I..
AN APPROACH TO SIGNIFICANCE ESTIMATION FOR SIMULATION STUDIES.
DOI: 10.5220/0003187901770186
In Proceedings of the 3rd International Conference on Agents and Artificial Intelligence (ICAART-2011), pages 177-186
ISBN: 978-989-8425-40-9
Copyright
c
2011 SCITEPRESS (Science and Technology Publications, Lda.)

clude some recent approaches to automation of exper-
iments which are actually executed in real systems.
An approach to identification of free-form natu-
ral laws from captured experimental data is presented
by (Schmidt and Lipson, 2009). In this work sym-
bolic regression – a method for searching in the space
of mathematical expressions which is based on evo-
lutionary computing – is used. They apply their ap-
proach to motion-tracking data from physical systems
like oscillators and chaotic double-pendula. They re-
port that their algorithm identifies different known
physical laws and that the discovery rate can be accel-
erated if previously found laws can be used as build-
ing blocks for more complex systems. In earlier work
an analysis of two different encoding types – tree
and graph encoding – for symbolic regression on over
500 randomly generated target functions is presented
(Schmidt and Lipson, 2007). The authors conclude
that graph encoding is an “attractive” alternative to
traditional tree based approaches as they provide sim-
ilar performance in convergence with less bloat.
Explora is a knowledge discovery assistant sys-
tem for multipattern and multistrategy discovery (e.g.,
(Kl
¨
osgen, 1994; Kl
¨
osgen, 1996)). Kl
¨
osgen lists four
analysis tasks that can be aimed at in such a setting
(Kl
¨
osgen, 1994): single-variant analysis (e.g., influ-
ence of predefined factors on output variables), com-
parison of variants, analysis of whole space of vari-
ants, and optimization. Kl
¨
osgen reports that the dis-
covery approach “can constitute a valuable approach
also in an area where the analyst has already a lot
of knowledge on the domain”. Referring to Kl
¨
osgen
three paradigms are fundamental in order to support
data exploration: search, visualization, and naviga-
tion, and KDD should combine these three paradigms
in a semi-automatic process (Kl
¨
osgen, 1996). The
Explora system “constructs hierarchical spaces of hy-
potheses, organizes and controls the search for inter-
esting instances in these spaces, verifies and evaluates
the instances in data, and supports the presentation
and management of the discovery findings” (Kl
¨
osgen,
1996, p. 250). Different facets of interestingness are
also discussed in this paper: evidence, redundancy,
usefulness, novelty, simplicity, and generality. The
application of Explora to simulation experiments in
practical political planning is presented in (Kl
¨
osgen,
1994).
(King et al., 2009) address the “automation of
science”; they present the development of the robot
scientist “Adam” who autonomously generates func-
tional genomics hypotheses and tests these hypothe-
ses using laboratory automation. An ontology and
logical language has been developed to describe the
research performed by the robot. The automated
conclusions have been confirmed through manually
performed experiments. In earlier work, King et
al. present genomic hypothesis generation with their
“robot scientist” (King et al., 2004). Experiments and
hypothesis generation are performed in a loop where
experimental results are evaluated and machine learn-
ing (with access to background knowledge) is applied.
The output of this step is used in order to select exper-
iments for the next cycle.
Huber et al. apply decision tree learning (ID3) in
order to extract knowledge from simulation runs in
model optimization (Huber et al., 1993). They set up
a classification task where the relation between input
and output of simulation runs is learned. The result of
the learning phase is a decision tree indicating which
attributes are important and what attribute values lead
to “good” or “bad” behavior. In their paper, they ap-
ply the approach to find the range of configuration and
workload parameters to optimize the performance for
a multiprocessor system. Referring to Huber et al. this
qualitative information of the system behavior can be
helpful for interpretation of the optimization results.
(Burl et al., 2006) present an approach to auto-
mated knowledge discovery from simulators. They
address the “landscape characterization problem”
with the aim to identify regions in the parameter space
which lead to a certain output behavior. Their ap-
proach is based on support vector machines (SVM)
and active learning, i.e., they aim at an intelligent se-
lection of new points in the parameter space in or-
der to maximize “the amount of new information ob-
tained” (Burl et al., 2006, p. 83). As applications they
use asteroid collision simulation and simulation of the
Earth’s magnetosphere. They report an increase of the
efficiency over standard gridding (2× to 6×).
(James et al., 2007) present a scheduling tool to
support the planning and steering of numerical ex-
periments. They address the problem that in practice
scientists often interactively adapt experimental set-
tings in dependence of the intermediate results (skip-
ping or adding experiments, changing the level of de-
tail for parts of the parameter space) as well as “ho-
ley” parameter spaces where not all parameter com-
binations (the cross-product of all parameter values)
should be taken into account. The approach consists
of a scheduler that handles experiment jobs in dif-
ferent job queues for available processors and certain
pre- and post-conditions to check if an experiment is
(still) relevant and to potentially clean up experimen-
tal output. With different graphical user interfaces the
user can setup experiments and interactively change
them even in the execution phase. The user has the
possibility to cancel individual jobs or complete pa-
rameter sets. For illustration a study of a physical
ICAART 2011 - 3rd International Conference on Agents and Artificial Intelligence
178

simulation of the Ising model is used aiming at the
identification of the critical temperature.
(Hoad et al., 2009) introduce an algorithm for the
automated selection of the number of replications for
discrete-event simulation in order to achieve a cer-
tain accuracy for simulation output measures taking
into account confidence intervals. They apply the ap-
proach to different statistical distributions and to a set
of simulation models. The authors report that the al-
gorithm is effective in selecting the needed number
replications in order to cover the expected mean at a
given level of precision.
Similar to some of the related approaches, we ap-
ply machine learning in combination with simulation.
In this work, machine learning is not used to discover
knowledge from simulation results but to learn a clas-
sifier for the estimation of statistical properties. In our
approach, we take into account statistical tests and the
development of their results for the control of simula-
tion runs.
3 CONTROL OF SIMULATION
EXPERIMENTS
In this section, we briefly describe the project con-
text of the approach presented in this paper. The goal
of the associated project AssistSim is the provision of
support functionalities for the performance of simula-
tion studies. Assistance is intended for planning, ex-
ecution, and analysis of simulation studies. The first
aspect – planning assistance – aims at capturing rel-
evant information for a simulation study, e.g., identi-
fication of the objects of investigation including pa-
rameters as well as their domains, and selection of
measurements and target functions. Details about this
aspect are planned to be published in a separate paper
by our project partners.
The aim of the second aspect – the execution
assistance – is the automated operation and control
of the simulation system, i.e., the automated exe-
cution of simulation runs. This phase is partially
connected with the analysis assistance as simulation
control depends on intermediate results of simulation
runs. However, in the current project, we restrict the
analysis assistance to a relevant set of functions for
simulation control. A thoroughly designed analysis
assistance for the investigation of a large result set of
simulation studies is planned to be part of a follow-up
project.
The essential task of the simulation execution as-
sistance is the systematic execution of the different
settings of the planned experiments. It is distin-
guished between three different kinds of simulation
studies:
1. Exploration. The parameter space has to be
explored and interesting findings should be cap-
tured.
2. Optimization. Parameter configurations which
are expected to lead to good results w.r.t. a target
functions should be identified.
3. Comparison. Two or more parameter configura-
tions of a simulation model (or different simula-
tion models) should be compared identifying the
best one or ranking the variants w.r.t. a target func-
tion.
Using a straight-forward approach, exploration
studies can be performed by testing all possible pa-
rameter configurations. In the case of continuous vari-
ables, a step size for discretization or a selection of pa-
rameter values to be investigated has to be performed.
Optimization studies can be performed by coupling
optimization methods (see, e.g., (Bianchi et al., 2009)
for a survey on metaheuristics for stochastic combi-
natorial optimization). For comparison studies, dif-
ferent approaches in the fields of ranking, selection,
and multiple comparisons have been introduced (e.g.,
(Swisher et al., 2003)).
In our work, we focus on discrete-event simula-
tion where various random variables can influence
simulation runs. In production scenarios, for instance,
randomness can affect the delivery times of parts,
duration of processes, and breakdowns of machines.
Thus, multiple runs of the same simulation model
with identical parameter configurations but different
seed values for the random number generators usually
leads to varying simulation runs and consequently, to
different results of the corresponding observed mea-
surements (e.g., manufacturing output). Technically,
this situation can be described as a stochastic process
with a (usually unknown) probability distribution and
expected value for the target function. Having this sit-
uation in mind, a meaningful simulation study has to
perform multiple runs of the same simulation setting
(i.e., model and parameter configuration) with differ-
ent random number seed values in order to draw con-
clusions about configurations’ qualities. This mul-
tiple runs of the same parameter settings are called
replications.
The number of replications and their results are
highly relevant for computation of statistical evi-
dence. Depending on these results, mean values and
confidence intervals of measurement variables can be
computed or statistical tests can be applied in order
to check if experimental data supports the hypoth-
esis that one variant leads to better results than an-
other. Obviously, if more replications are performed,
AN APPROACH TO SIGNIFICANCE ESTIMATION FOR SIMULATION STUDIES
179
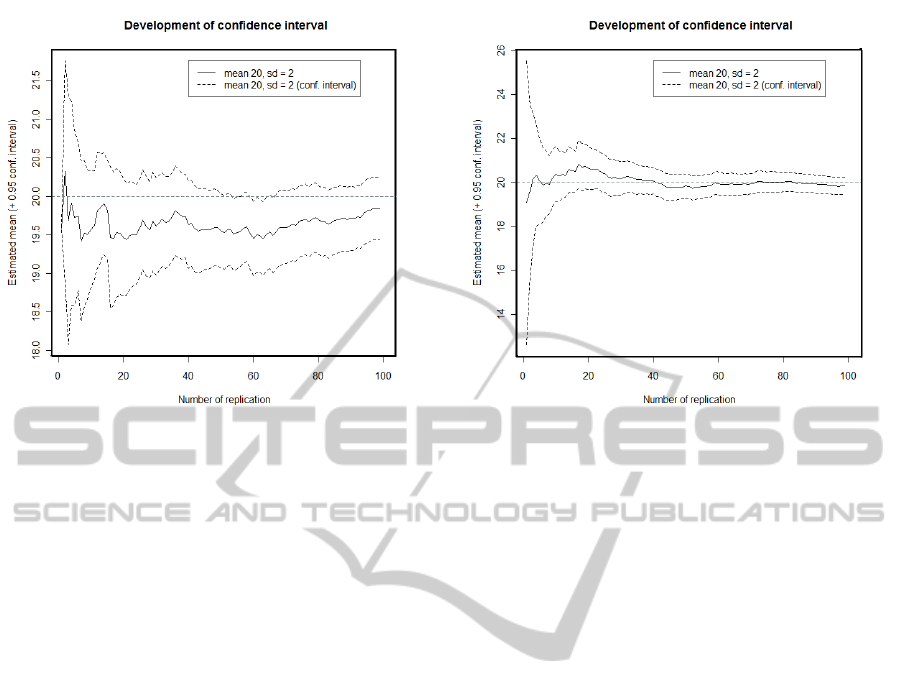
Figure 1: Confidence interval development for growing
number of samples (normal distribution with mean 20 and
standard deviation 2 - Example 1.
a higher confidence w.r.t. the statistical results will be
received. However, complex simulation models can
lead to costly execution times for single simulation
runs and a large parameter space might prohibit per-
forming a large number of replications for each pa-
rameter configuration.
The approach presented here aims at the estima-
tion if certain statistical results are expected to be gen-
erated and when this could be the case, i.e., how many
replications are expected to be needed in order to sat-
isfy certain statistical properties. In this work, we fo-
cus on situations where two different variants should
be compared by a statistical test. A similar approach
could be developed for an estimation when a confi-
dence interval of a measurement is expected to be ac-
curate enough for the expert performing the simula-
tion study.
4 SIGNIFICANCE ESTIMATION
In this section, we present our approaches to signif-
icance estimation. For initial studies, we have ab-
stracted from simulation runs and use probability dis-
tributions and randomly drawn samples of these dis-
tributions for a first investigation how data can look
like. We assume that observed measurement variables
of different simulation runs also underly certain distri-
butions. Using well-known probability distributions
allows for structured investigations of our approaches
where we can easily generate samples from distribu-
tions with known properties. Evaluations with data
generated by simulation models can be more difficult
Figure 2: Confidence interval development for growing
number of samples (normal distribution with mean 20 and
standard deviation 2 - Example 2.
as the real underlying distribution is not known and if
two simulation model variants are compared, it is not
clear from the beginning if the distributions of their
results differ.
In the next subsection we present an analysis of
statistical properties before we actually introduce our
approaches to significance estimation, namely con-
vergence classification and replication prediction.
4.1 Analysis of Statistical Properties
If we take a look at different successively drawn sam-
ples of distributions, we can see an interesting devel-
opment of values. Figures 1 and 2 show two devel-
opments of values from the same distribution (normal
distribution with mean 20 and standard deviation 2).
The solid blue line shows the estimated mean value
using a specific number of sample values. The dashed
light blue line shows the confidence interval. It is
known that we need four times as many samples in
order to halve the size of the confidence interval (e.g.,
(Law, 2007)). It can be seen that in one case the mean
of the sample is below the actual expected value of
the distribution (Figure 1) while in the other case, the
line comes close to the actual expected value rather
quickly (Figure 2).
Figures 3 and 4 show the development curves of
p values of performed t-tests on varying sample sizes.
In these graphs, we can see two curves: One where
the compared samples are actually drawn from differ-
ent distributions (blue line; mean 20, stdev 2 vs. mean
21, stdev 3) and another where both compared sam-
ples are drawn from the same distribution (dashed red
ICAART 2011 - 3rd International Conference on Agents and Artificial Intelligence
180
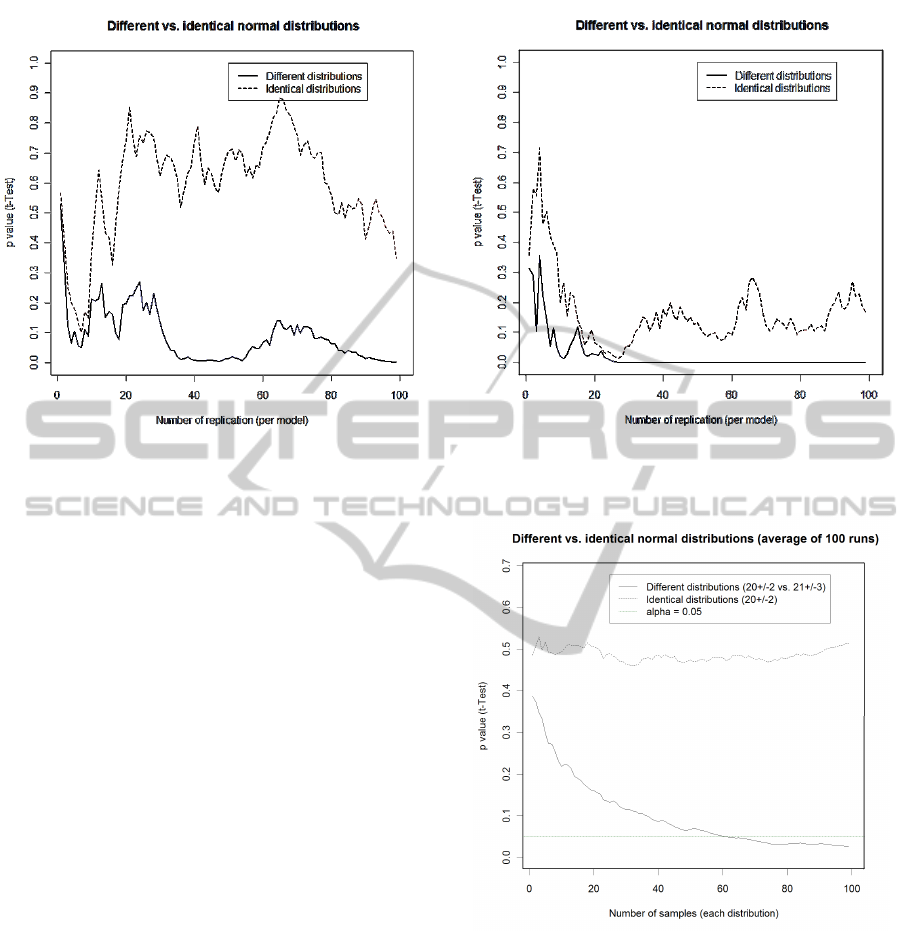
Figure 3: p value of t-test development for growing number
of samples (normal distributions with mean 20, stdev 2 vs.
mean 21, stdev 3) - Example 1.
line; mean 20, stdev 2). The two distributions have
been selected to have a good overlap in the values on
purpose in order to take a look at samples where the
difference is not obvious after drawing a few exam-
ples. Interestingly, it can be seen (e.g., in Figure 4)
that for these distributions in some cases the graphs
can be hardly distinguished (for less than 100 sam-
ples for each distribution).
Additionally to the graphs comparing two single
samples, the average p values of 100 runs are plotted
in Figure 5. As it can be seen, the p values of identical
distributions (dashed red line) are close by 0.5 while
the p values of the different distributions (solid blue
line) move towards the x-axis.
In this study, we focus on the comparisons of two
different distributions and leave out the single sam-
ple case where only one measurement variable of one
variant is taken into account. The following two sec-
tions describe two approaches to significance estima-
tion.
4.2 Convergence Classification
Convergence classification aims at estimating if it can
be shown that samples from one distribution are bet-
ter on average (e.g., if it can be shown by a statistical
test that the mean is greater than the mean of another
distribution). The basic idea is to observe the devel-
opment of p values while the number of samples is in-
creasing. We have set up the convergence estimation
as a classification task. A classifier is trained using
a set of positive and negative examples (different dis-
Figure 4: p value of t-test development for growing number
of samples (normal distributions with mean 20, stdev 2 vs.
mean 21, stdev 3) - Example 2.
Figure 5: p value of t-test development for growing number
of samples (normal distributions with mean 20, stdev 2 vs.
mean 21, stdev 3 - Average of 100 runs.
tribution vs. identical distribution). This classifier can
later be used in order to classify unseen p value series.
In our current implementation, we extract five
straight-forward features which are used for classifi-
cation and have a target attribute with two possible
outcomes:
• p
min
: The minimal p value observed so far.
• p
man
: The maximal p value observed so far.
• p
avg
: The average of all observed p values.
AN APPROACH TO SIGNIFICANCE ESTIMATION FOR SIMULATION STUDIES
181

• p
last
: The last known p value (taking into account
the whole samples).
• p
grad
: The “gradient” of the p value development,
taking into account first and last known p value in
relation to the number of samples.
• class: Different or same distribution (diff/same).
In order to train the classifier, we apply the C4.5
algorithm for decision tree learning (Quinlan, 1993).
In our work, we have integrated the WEKA machine
learning program and have used the J4.8 implementa-
tion of C4.5 (Witten and Frank, 2005).
4.3 Replication Prediction
While significance estimation only aims at the clas-
sification if a significant statistical result is expected,
the replication prediction task has the goal to estimate
the number of needed replications in order to reach
the significant result with a statistical test. Thus, in
this case we are facing a numeric prediction task.
Various prediction methods could be applied to
the data, e.g., from the field of time series predic-
tion. For our initial experiments we decided to ap-
ply regression to the known series of p values in order
to estimate the subsequent development. Therefore,
we use the R project implementation of the nonlin-
ear least squares method (NLS) (R Development Core
Team, 2010).
In order to fit a function to the provided data, we
let the regression identify the coefficients a and b of
the following formula:
f (x) =
1
a + bx
(1)
The prediction of the number of necessary repli-
cations is done by computing the interception point of
the curve with the desired significance level α. Equal-
izing the function with α and solving it for x leads to
the predicted number of replications:
x =
1
αb
−
a
b
(2)
Figure 6 shows the development of p values as
well as the regression curve which has been generated
from the first 30 p values.
5 EVALUATION
The evaluation consists of three parts. In the first part,
the significance classification is applied to distribu-
tions with fixed mean and standard deviation. The
Figure 6: Replication prediction using nonlinear regression.
second part applies the significance classification to
randomly generated distributions. In the third part,
we apply the replication prediction to fixed distribu-
tions.
5.1 Significance Classification for Fixed
Distributions
In the first experiment series, we apply the signifi-
cance classification approach to samples drawn from
different distributions with fixed mean and standard
deviation. Altogether, we set up three different dis-
tribution pairs which are evaluated. In our evalua-
tion, we investigate the classifier accuracy for varying
numbers of p values (5, 10, . . . , 95) taken into account
for training and classification. For each distribution
pair, ten independent runs are performed where 500
training and 500 testing examples (50% same, 50%
different distributions) are generated.
Table 1 shows a summary of the results indicat-
ing the average accuracy of the approach as well as
the accuracy if simple comparison of the last p value
with the α threshold is performed, i.e., if p
last
< α,
it will be classified to diff, otherwise to same. Addi-
tionally, for each number of p values we perform a
statistical significance test comparing the accuracies
of the classifier vs. the α-threshold approach (ten ac-
curacy values each) and capture the corresponding p
values of the test. Significant results are emphasized
with bold letters. The accuracies for the second dis-
tribution pair (µ
1
= 20, sd
1
= 2 vs. µ
2
= 22, sd
2
= 2)
is shown in Figure 7.
The following tree is an example for a trained clas-
ICAART 2011 - 3rd International Conference on Agents and Artificial Intelligence
182
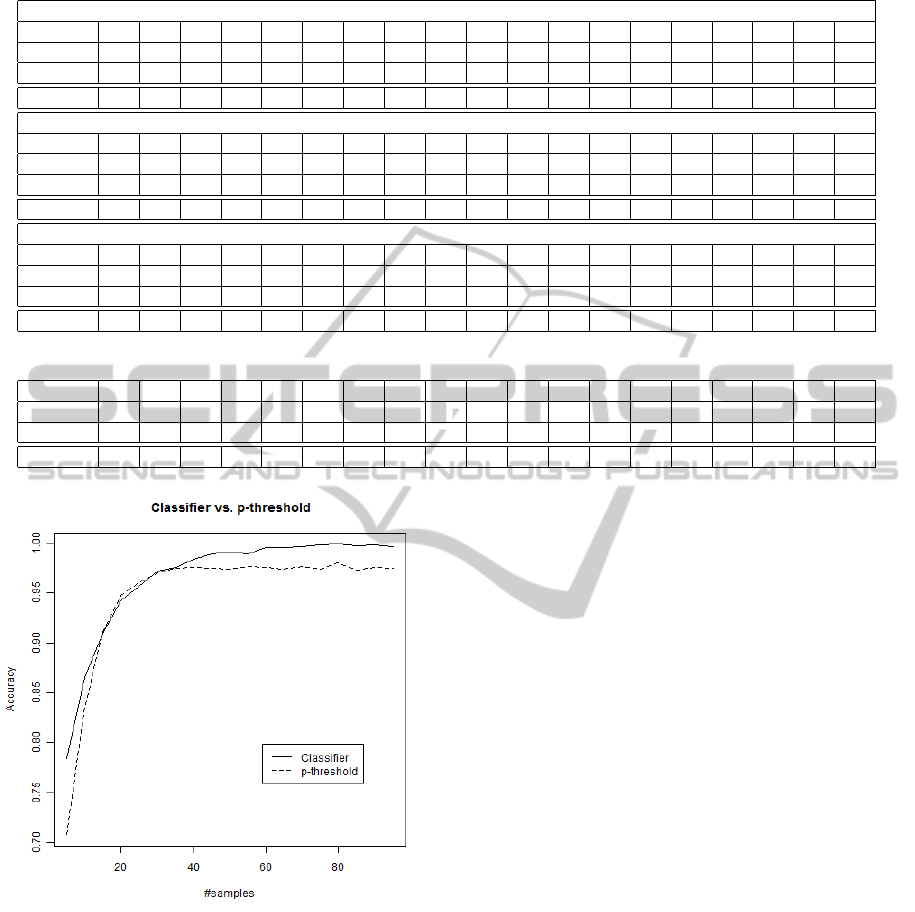
Table 1: Accuracies of the significance classifier for different fixed distributions (0
∗
indicates p values < 0.001).
µ
1
= 20, sd
1
= 2, µ
2
= 21, sd
2
= 2
Approach 5 10 15 20 25 30 35 40 45 50 55 60 65 70 75 80 85 90 95
Sign.Cl. .655 .698 .751 .770 .810 .825 .836 .855 .865 .895 .898 .909 .915 .928 .929 .935 .944 .940 .952
p thresh. .570 .628 .660 .716 .763 .783 .810 .839 .857 .887 .891 .903 .922 .930 .933 .940 .947 .946 .955
p (t-test) 0
∗
0
∗
0
∗
0
∗
0
∗
0
∗
.001 .004 .151 .171 .129 .185 .845 .636 .783 .914 .688 .908 .755
µ
1
= 20, sd
1
= 2, µ
2
= 22, sd
2
= 2
Approach 5 10 15 20 25 30 35 40 45 50 55 60 65 70 75 80 85 90 95
Sign.Cl. .784 .865 .910 .942 .957 .972 .975 .984 .989 .991 .989 .995 .996 .996 .998 .999 .998 .998 .997
p thresh. .708 .836 .911 .947 .960 .970 .974 .976 .974 .974 .976 .975 .974 .976 .973 .980 .973 .976 .975
p (t-test) 0
∗
0
∗
.561 .825 .807 .341 .408 .021 0
∗
0
∗
0
∗
0
∗
0
∗
0
∗
0
∗
0
∗
0
∗
0
∗
0
∗
µ
1
= 20, sd
1
= 2, µ
2
= 23, sd
2
= 2
Approach 5 10 15 20 25 30 35 40 45 50 55 60 65 70 75 80 85 90 95
Sign.Cl. .893 .958 .972 .986 .994 .997 .997 .997 .997 .999 .999 .999 1.0 1.0 1.0 1.0 1.0 1.0 1.0
p thresh. .865 .959 .970 .970 .97 .975 .977 .976 .973 .974 .980 .975 .975 .976 .975 .972 .974 .976 .974
p (t-test) 0
∗
.653 .418 0
∗
0
∗
0
∗
0
∗
0
∗
0
∗
0
∗
0
∗
0
∗
0
∗
0
∗
0
∗
0
∗
0
∗
0
∗
0
∗
Table 2: Accuracies of the significance classifier for randomly generated distributions (0
∗
indicates p values < 0.001).
Approach 5 10 15 20 25 30 35 40 45 50 55 60 65 70 75 80 85 90 95
Sign.Cl. .563 .601 .655 .680 .701 .717 .733 .730 .745 .761 .775 .780 .778 .777 .793 .808 .801 .790 .806
p thresh. .539 .564 .580 .599 .612 .615 .626 .627 .635 .634 .646 .642 .649 .652 .653 .666 .654 .654 .658
p (t-test) .014 .002 0
∗
0
∗
0
∗
0
∗
0
∗
0
∗
0
∗
0
∗
0
∗
0
∗
0
∗
0
∗
0
∗
0
∗
0
∗
0
∗
0
∗
Figure 7: Accuracies of significance classifier and p-
threshold (normal distributions with mean 20, stdev 2 vs.
mean 22, stdev 2).
sifier with 30 provided p values:
currP <= 0.129937
| currP <= 0.033323: diff (158.0/6.0)
| currP > 0.033323
| | avg <= 0.099929: diff (16.0)
| | avg > 0.099929
| | | totgrad <= 0.000215: diff (63.0/21.0)
| | | totgrad > 0.000215: same (4.0)
currP > 0.129937: same (259.0/40.0)
The results of these experiments indicate an ad-
vantage of the trained classifier in comparison to the
threshold-based method in many cases. Significant
(α = 0.05) differences in the accuracies can be ob-
served for 5-40 p values in the first setting. In the
second setting (where the mean difference is greater),
for 5 and 10 as well as from 40 - 95 better results can
be achieved using the classifier. In the third setting
(even greater difference between means), the classi-
fier is better for 5 and the settings with 20 or more p
values.
5.2 Significance Classification for
Random Distributions
In a second test, we do not use distributions with fixed
mean and standard deviation values, but randomly
generated distributions. The generation of the random
distributions works as follows:
• Select a random mean value for the first distribu-
tion: µ
1
∈ [50, 500].
• Randomly select a standard deviation value for the
first distribution sd
1
∈ [0, 0.3µ
1
].
• Generate random mean value for the second dis-
tribution within the standard deviation of the first
one: µ
2
∈ [µ
1
− sd
1
, µ
1
+ sd
1
].
• Randomly select a standard deviation value for the
second distribution: sd
2
∈ [0, 2sd
1
]
Instead of drawing random samples from the same
distribution, in this experiment series for each training
AN APPROACH TO SIGNIFICANCE ESTIMATION FOR SIMULATION STUDIES
183
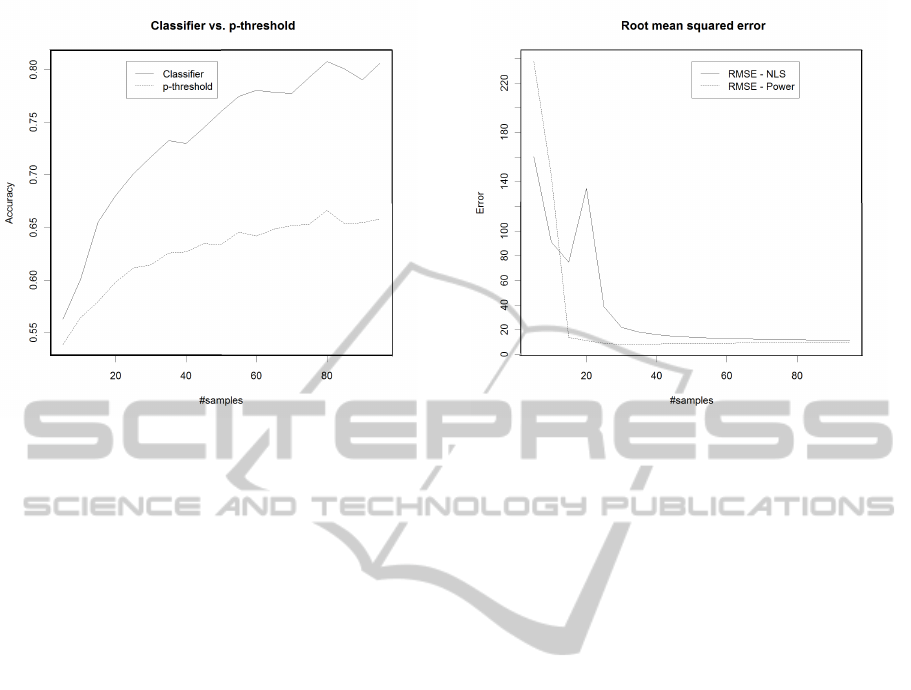
Figure 8: Accuracies of significance classifier and p-
threshold for different number of used p values for ran-
domly generated distributions.
and testing example, the distributions are generated
randomly. Thus, more general classifiers are trained
taking into account various different distributions.
Once again, ten independent runs with 500 training
and 500 testing examples are performed. The results
(average accuracies and p value of t-tests) of these
experiments are presented in Table 2. A graph com-
paring the significance classifier with the p-threshold
method is shown in Figure 8. The results indicate bet-
ter results of the classifier for all tested numbers of
p values. In some cases an accuracy difference with
approximately 15 percent points occurs in these ex-
periments.
5.3 Replication Prediction for Fixed
Distributions
The third part of the evaluation addresses the repli-
cation prediction. Additionally to the approach pre-
sented in Section 4.3, we use a statistical power
analysis in order to estimate the needed sample size
(e.g., (Park, 2008)). We use the implementation of
R Project (power.t.test) with the estimated mean dif-
ference of the corresponding number of sample sizes,
α = 0.05, a fixed power value of 0.8, and the one-
sided test setting. The result is an estimation how
many samples are needed.
We apply the both prediction methods to the same
fixed distributions as in Section 5.1 and capture the
root mean squared error (RMSE). As both methods
generate unrealistic high replication estimations in
some cases, we have introduced a maximal threshold.
Figure 9: Root mean squared error for replication prediction
(normal distributions with mean 20, stdev 2 vs. mean 22,
stdev 2).
Whenever this threshold (1000 in our experiments) is
exceeded, the corresponding value is set to the thresh-
old value. Additionally, we count how many times
no interception point could be computed for the NLS
method (marked with “#invalid”). The results of these
experiments are shown in Table 3. One graph of the
second setting (µ
1
= 20, sd
1
= 2 vs. µ
2
= 22, sd
2
= 2)
is shown in Figure 9.
The experimental results do not identify one of the
methods as better. Depending on the number of p val-
ues taken into account and depending on the different
distributions, one or the other method leads to a lower
RMSE. A direct comparison is not really possible, as
the NLS method leads to invalid values in some cases.
Especially, if only few values are used, the regression
does not lead to a valid interception point (25 out 100
for the first setting and 5 p values). For the first two
distribution pairs (those with a higher overlap) and
low numbers of p values (5 and 10), the NLS method
leads to better mean error of the 100 performed runs.
Early prediction results are of special interest as it al-
lows for an early intervention (of the system or user).
6 CONCLUSIONS
In this paper, we have addressed the estimation of
statistical properties. We have presented two ap-
proaches: one for classification if a development of
observed p values is expected to lead to a statistical
significant result and another one for the prediction of
needed sample sizes, also by taking into account pre-
ICAART 2011 - 3rd International Conference on Agents and Artificial Intelligence
184

Table 3: Root mean squared errors of the replication prediction methods for different fixed distributions (mean values of 100
runs).
µ
1
= 20, sd
1
= 2, µ
2
= 21, sd
2
= 2
Approach 5 10 15 20 25 30 35 40 45 50
NLS 179.7 157.1 192.1 77.7 153.5 55.3 102.6 62.0 145.2 149.1
Power 282.1 223.5 166.9 125.2 102.4 167.8 155.6 103.6 97.9 27.6
#invalid 25 13 9 9 7 6 5 6 6 5
Approach 55 60 65 70 75 80 85 90 95
NLS 153.1 101.9 129.3 100.0 80.7 70.9 65.0 60.6 57.1
Power 96.1 38.3 26.8 24.9 25.5 25.3 24.8 25.7 26.3
#invalid 3 3 2 2 1 1 1 1 1
µ
1
= 20, sd
1
= 2, µ
2
= 22, sd
2
= 2
Approach 5 10 15 20 25 30 35 40 45 50
NLS 160.1 91.1 74.8 134.5 38.5 22.0 18.0 15.9 14.7 13.8
Power 237.4 145.0 13.8 11.3 9.2 8.0 8.5 8.5 8.8 9.1
#invalid 13 8 3 2 2 2 1 1 1 0
Approach 55 60 65 70 75 80 85 90 95
NLS 13.3 12.8 12.5 12.2 12.0 11.8 11.7 11.5 11.4
Power 9.2 9.2 9.2 9.3 9.2 9.3 9.3 9.4 9.4
#invalid 0 0 0 0 0 0 0 0 0
µ
1
= 20, sd
1
= 2, µ
2
= 23, sd
2
= 2
Approach 5 10 15 20 25 30 35 40 45 50
NLS 115.4 103.3 8.1 6.3 5.6 5.2 4.9 4.8 4.6 4.6
Power 42.5 4.1 3.1 3.1 3.3 3.5 3.5 3.6 3.6 3.6
#invalid 6 5 5 5 5 4 4 4 4 4
Approach 55 60 65 70 75 80 85 90 95
NLS 4.5 4.4 4.4 4.4 4.3 4.3 4.3 4.2 4.2
Power 3.6 3.6 3.7 3.7 3.7 3.7 3.7 3.7 3.7
#invalid 4 4 4 4 4 4 4 4 4
vious samples.
The comparison of the significance classifier with
a threshold-based classification leads to significantly
better results in most cases. Especially in the experi-
ments with randomly generated distributions, a better
performance could be observed. For samples where
the mean values of the distributions are not too close,
high classification accuracies (almost 90%) can be
reached even if only five p values are used.
The experiments with the replication prediction do
not exhibit that clear results. The power-based pre-
dictor leads to lower average error rates for the setting
with a greater difference of the mean values as well as
in the cases where many p values are used. In some
settings, the regression-based approach leads to better
results, e.g., if only 5 or 10 p values are used for the
closer distribution pairs.
It should be at least mentioned that the approaches
presented here – multiple statistical tests with increas-
ing sample sizes – are violating regular statistical pro-
cedures where the setting should be clear before ex-
periments are performed and multiple tests with the
same data should be avoided or at least taken into
account by using adapted significance levels. For
exploration-based studies such approaches might be
acceptable in order to filter out certain variants or if
one is aware of the statistical statement.
The current significance classifier uses a rather
small set of straight-forward features. It would be
interesting to investigate if further features can lead
to an improvement of the classifier’s accuracy. The
prediction of the needed number of replications has
not been addressed deeply within this study. In this
case, an investigation of further statistical or time se-
ries prediction methods should be performed. Further
experiments are needed in order to make statements
in what situations adequate results are expected. An-
other topic for future work is the application of the
approaches to simulation systems. In this context,
relevant research questions are how the approaches
perform if other distributions (than normal distribu-
tions) are present and what the underlying distribu-
tions of certain observation variables of simulation
models are.
AN APPROACH TO SIGNIFICANCE ESTIMATION FOR SIMULATION STUDIES
185

ACKNOWLEDGEMENTS
The content of this paper is a partial result of the As-
sistSim project (Hessen Agentur Project No.: 185/09-
15) which is funded by the European Union (Euro-
pean Regional Development Fund - ERDF) as well
as the German State Hesse in context of the Hessen
ModellProjekte. We would like to thank our Assist-
Sim project partners for interesting discussions on the
automation of simulation experiments.
REFERENCES
Bianchi, L., Dorigo, M., Gambardella, L. M., and Gutjahr,
W. J. (2009). A survey on metaheuristics for stochastic
combinatorial optimization. Natural Computing: an
international journal, 8(2):239–287.
Burl, M. C., DeCoste, D., Enke, B. L., Mazzoni, D., Mer-
line, W. J., and Scharenbroich, L. (2006). Automated
knowledge discovery from simulators. In Ghosh,
J., Lambert, D., Skillicorn, D. B., and Srivastava,
J., editors, Proceedings of the Sixth SIAM Interna-
tional Conference on Data Mining, April 20-22, 2006,
Bethesda, MD, USA.
Ekren, B. Y. and Heragu, S. S. (2008). Simulation based
optimization of multi-location transshipment problem
with capacitated transportation. In WSC ’08: Pro-
ceedings of the 40th Conference on Winter Simulation,
pages 2632–2638. Winter Simulation Conference.
Hoad, K., Robinson, S., and Davies, R. (2009). Automated
selection of the number of replications for a discrete-
event simulation. Journal of the Operational Research
Society.
Huber, K.-P., Syrjakow, M., and Szczerbicka, H. (1993).
Extracting knowledge supports model optimization.
In Proceedings of the International Simulation Tech-
nology Conference SIMTEC’93, pages 237–242, San
Francisco.
James, H. A., Hawick, K. A., and Scogings, C. J. (2007).
User-friendly scheduling tools for large-scale simula-
tion experiments. In WSC ’07: Proceedings of the
39th conference on Winter simulation, pages 610–616,
Piscataway, NJ, USA. IEEE Press.
King, R. D., Rowland, J., Oliver, S. G., Young, M., Aubrey,
W., Byrne, E., Liakata, M., Markham, M., Pir, P.,
Soldatova, L. N., Sparkes, A., Whelan, K. E., and
Clare, A. (2009). The automation of science. Science,
324(5923):85–89.
King, R. D., Whelan, K. E., Jones, F. M., Reiser, P. G. K.,
Bryant, C. H., Muggleton, S. H., Kell, D. B., and
Oliver, S. G. (2004). Functional genomic hypothesis
generation and experimentation by a robot scientist.
Nature, 427:247–252.
Kl
¨
osgen, W. (1994). Exploration of simulation experiments
by discovery. In AAAI-94 Workshop on Knowledge
Discovery in Databases (KDD’94), Technical Report
WS-94-03, pages 251–262, Menlo Park, California.
The AAAI Press.
Kl
¨
osgen, W. (1996). Explora: A multipattern and mul-
tistrategy discovery assistant. In Fayyad, U. M.,
Piatetsky-Shapiro, G., and Uthurusamy, R., editors,
Advances in knowledge discovery and data mining,
pages 249–271. AAAI Press, Menlo Park.
Lagan
´
a, D., Legato, P., Pisacane, O., and Vocaturo,
F. (2006). Solving simulation optimization prob-
lems on grid computing systems. Parallel Comput.,
32(9):688–700.
Law, A. M. (2007). Simulation Modeling & Analysis.
McGraw-Hill, 4th, internat. edition.
Park, H. M. (2008). Hypothesis testing and statistical power
of a test. Working paper. the university information
technology services (UITS), Center for Statistical and
Mathematical Computing, Indiana University.
Quinlan, J. R. (1993). C4.5 - Programs for Machine Learn-
ing. Morgan Kaufmann Publishers, Inc.
R Development Core Team (2010). R: A Language and
Environment for Statistical Computing. R Foundation
for Statistical Computing, Vienna, Austria. ISBN 3-
900051-07-0.
Schmidt, M. and Lipson, H. (2007). Comparison of tree
and graph encodings as function of problem complex-
ity. In GECCO ’07: Proceedings of the 9th annual
conference on Genetic and evolutionary computation,
pages 1674–1679, New York, NY, USA. ACM.
Schmidt, M. and Lipson, H. (2009). Distilling free-
form natural laws from experimental data. Science,
324(5923):81–85.
Swisher, J. R. and Jacobson, S. H. (2002). Evaluating
the design of a family practice healthcare clinic using
discrete-event simulation. Health Care Management
Science, 5(2):75–88.
Swisher, J. R., Jacobson, S. H., and Y
¨
ucesan, E. (2003).
Discrete-event simulation optimization using ranking,
selection, and multiple comparison procedures: A sur-
vey. ACM Trans. Model. Comput. Simul., 13(2):134–
154.
Witten, I. H. and Frank, E. (2005). Data Mining: Practi-
cal machine learning tools and techniques. Morgan
Kaufmann, San Francisco, 2nd edition.
ICAART 2011 - 3rd International Conference on Agents and Artificial Intelligence
186
