CREATING CHARACTER CONNECTIONS FROM MANGA
Harumi Murakami, Ryota Kyogoku
Graduate School for Creative Cities, Osaka City University, Japan
Hiroshi Ueda
Musium Media Division, ATR-Promotions, Inc., Kyoto, Japan
Keywords: Character connections, Comics, Manga, Dragon Ball, Frames.
Abstract: We presented a method to create character connections from manga using the frequencies of characters and
their co-occurrences by referring to frames. First, we input characters and frames with a data input tool.
Second, we calculated the frequencies of characters and the relationships among characters and group-
related characters. Third, we created character connections. Preliminary experiments using Dragon Ball vol.
32 suggest the usefulness of our approach.
1 INTRODUCTION
In recent years, the popularity of manga (Japanese
comics) has increased worldwide, and a large
amount of manga is being published. As of 2008, the
U.S. and Canadian manga market generated $175
million in annual sales (Reid 2009).
Manga is usually first serialized in magazines
and later compiled in books. Some manga is a long
epic. For example, Dragon Ball, a well-known
manga written and illustrated by Akira Toriyama,
was originally serialized from 1984 through 1995;
later its 509 individual chapters were published as
42 book volumes.
Since finding a chapter, a specific volume, or a
manga itself from a large amount of manga
collections is difficult, we investigate how to find a
chapter or a particular manga volume.
Character connections are often created to
introduce the contents of multimedia such as movies,
anime, and TV dramas that help people understand
the characters and the complicated stories. We
believe that character connections are also useful for
finding and understanding manga. However,
creating character connections from manga is
unclear, time-consuming, and expensive.
This research creates character connections from
manga to help users find and understand its contents.
Below, in Section 2 we explain our approach’s
overview. Algorithms and preliminary experiments
are described in Sections 3 and 4. Related work is
shown in Section 5.
2 OUR APPROACH
This research creates character connections from
manga.
First, we input characters and frames with a data
input tool. Second, we calculate the frequencies of
characters and relationships among characters and
group-related characters. Third, we create character
connections.
The main feature of this research is creating
character connections from manga using the
frequencies of characters and their co-occurrences
by referring to frames. No current work creates
character connections from manga or comics.
Goku
Cell
#16
#18
Krillin
Bulma
Piccolo
Trunks
VegetaGohan
Tien
Shinhan
Mr. Popo
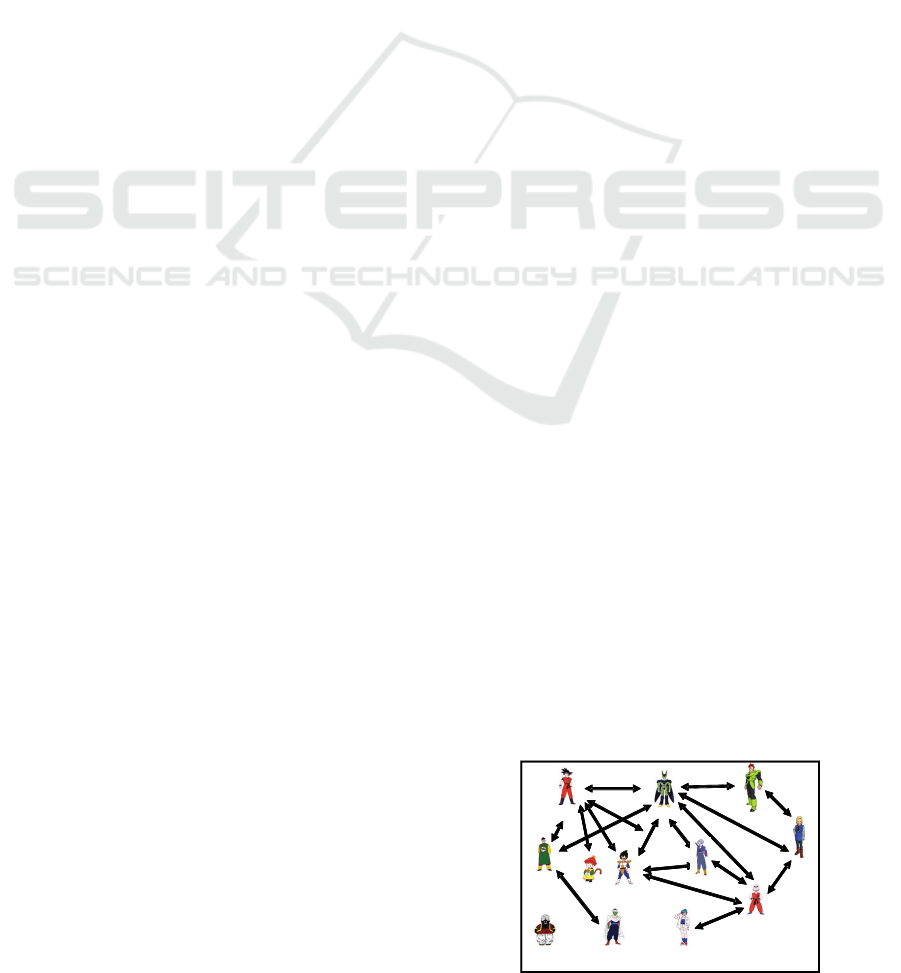
Figure 1: Created character connections from Dragon Ball
vol.32.
677
Murakami H., Kyogoku R. and Ueda H..
CREATING CHARACTER CONNECTIONS FROM MANGA.
DOI: 10.5220/0003196506770680
In Proceedings of the 3rd International Conference on Agents and Artificial Intelligence (ICAART-2011), pages 677-680
ISBN: 978-989-8425-40-9
Copyright
c
2011 SCITEPRESS (Science and Technology Publications, Lda.)
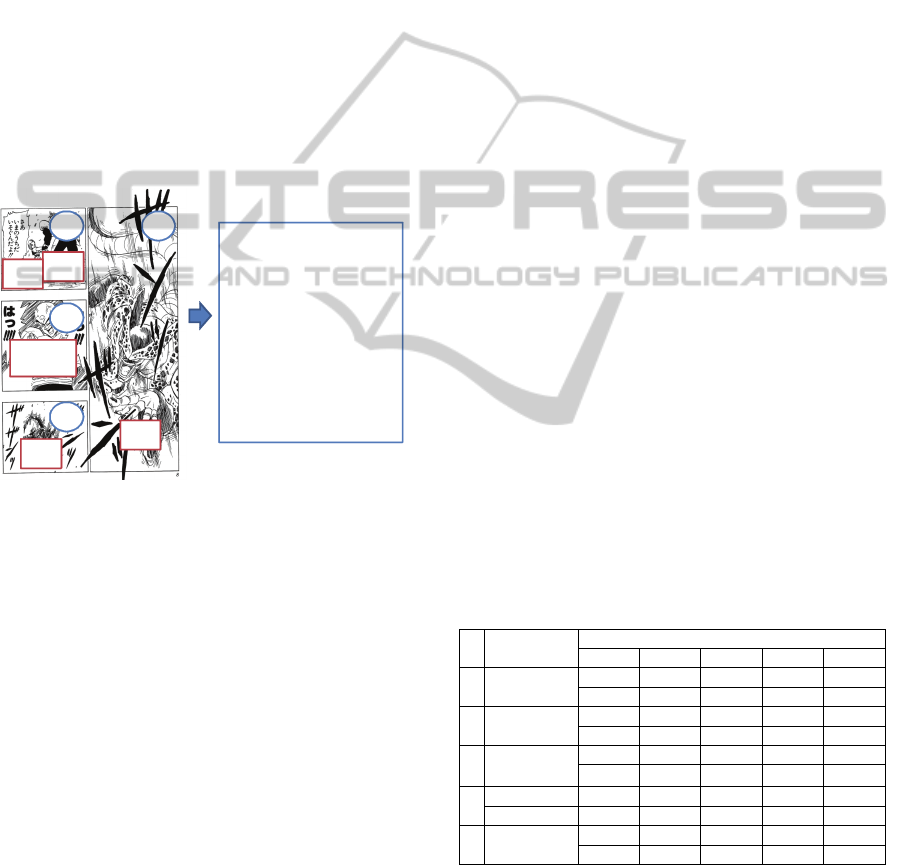
Figure 1 shows created character connections
from an experiment using Dragon Ball vol.32.
3 ALGORITHMS
3.1 Data Input
Data input is time-consuming. We prepared a data
input tool using excel macro to reduce the burden of
the task. First, we manually extracted the character
names contained in the manga and input them into
the tool. Next, a user read the manga and pressed a
button for the registered character names when they
appeared. Finally a data file was produced. It takes
approximately one hour to input data from one
volume (about 130 pages).
12
3
4
Cell
#16
#18
Cell
Tien
Shinhan
¥374 /* beginning of
chapter 374 */
Cell /* character */
// /* frame */
Android #16
Android #18
//
Tien Shinhan
//
Cell
//// /* end of page */
Data file
A manga page
Figure 2: Example of data input.
Figure 2 shows an example of creating a file
from a page, beginning at chapter 374 of Dragon
Ball vol. 32. Manga flows from top to bottom and
right to left. In the first frame of the first page, Cell
(character name) appears. In the next frame, Android
#16 (hereafter #16) and Android #18 (hereafter #18)
appear.
3.2 Judging Relations
3.2.1 Relations inside Frames
We assume that characters who appear in the same
frame are related. When more than one character
appears in a frame, we give related scores to each
character and assume that when the number of
characters inside frames is smaller, the relation is
stronger. Related scores inside frames between
characters C
i
and C
j
are calculated as:
R
in
(c
i
, c
j
)=
)5(25.0
)4,3,2,1(/1
nif
nifn
(1)
Here n is the number of different characters from the
designated character inside a frame.
3.2.2 Relations outside Frames
We assume that characters who appear in the next
frame are related. When different characters appear
in subsequent frames, related scores are added to
each character. Related scores outside frames
between characters C
i
and C
j
are calculated as:
R
out
(c
i
, c
j
)=
)5(25.0
)4,3,2,1(/5.0
nif
nifn
(2)
Here n is the number of different characters from the
designated character outside (next) the frame .
3.2.3 Unifying Relations
Finally, related scores between c
i
and c
j
are
calculated as the summation of the related scores of
relations inside and outside frames, as shown in
Equation (3).
R (c
i
, c
j
)=
1
11
),(),(
n
k
n
k
jioutjiin ccRccR
(3)
Here n is the number of frames in designated units
(e.g. chapters, volumes, etc.)
We created a table whose rows are characters
sorted by their frequencies and whose columns are
related characters sorted by their related scores.
Table 1: Five most frequent characters with five most
related characters.
Character
Related characters
1 2 3 4 5
1 Cell
[266]
Ve Tr 16 Kr 18
172.5 43.1 24.0 23.7 15.7
2 Vegeta
[196]
Ce Tr Go Kr 16
172.5 28.2 10.4 10.2 8.3
3 Krillin
[115]
Tr Ce 18 Bu 16
52.6 43.1 20.1 14.0 11.4
3 Trunks Kr Ce Ve Go Bu
[115] 52.6 43.1 28.2 13.2 8.1
5 Goku
[69]
Gh Ti Ce Tr Ve
43.8 15.0 14.3 13.2 10.4
Note: [] indicates appearance frequency of characters; numbers on
right hand are related scores.
Note 2: Ce:Cell; Ve: Vegeta; Kl: Krillin; Tr: Trunks;
Go: Goku; 18: #18; 16: #16; Gh: Gohan; Bu: Bulma;
Ti: Tien Shinhann; Pi: Piccolo; Po: Mr. Popo
Table 1 shows the five most frequent characters
and the five most related characters. For example,
ICAART 2011 - 3rd International Conference on Agents and Artificial Intelligence
678
Cell is the most frequent character and appears 266
times in vol. 32. The most related character to Cell is
Vegeta whose related score with Cell is 172.5.
3.3 Grouping
We group strongly related characters using the table
generated by the previous step. The grouping
algorithm is shown in Figure 3.
Step 1. We verify the differences between the related
scores in a raw and set the border using the biggest
difference. We make an initial group from the left-
most characters to the characters next to the border.
Step 2. We check all initial groups and merge those
include same characters in them.
Figure 3: Grouping algorithm.
For example, for the first raw of Cell, 129.4
(172.5-43.1) is the biggest among (172.5-43.1),
(43.1-24.0), ..; Cell and Vegeta are grouped into an
initial group. Likewise, Vegeta and Cell are grouped
from the second raw. These two initial groups are
merged into one group.
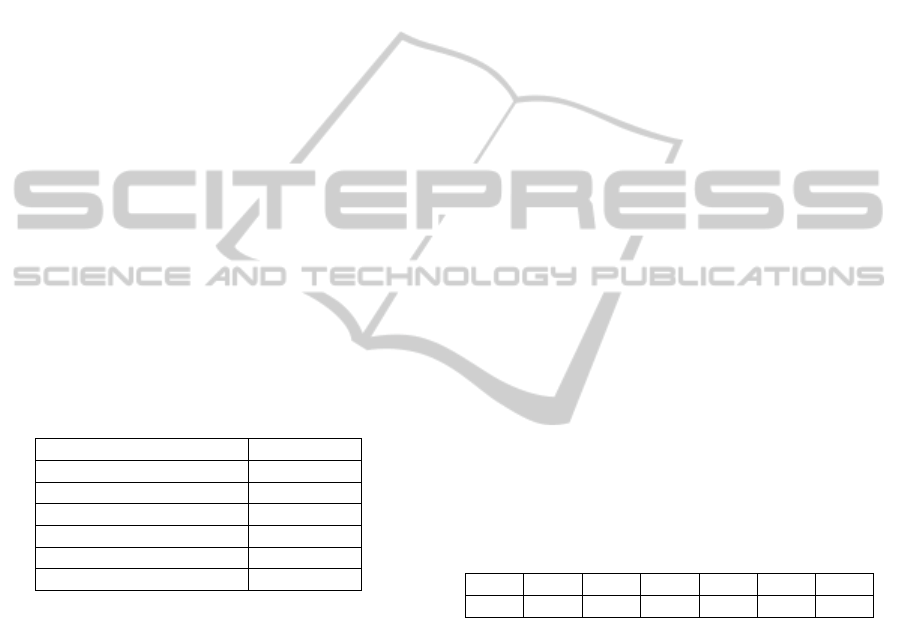
Table 2 shows the grouping results from Table 1.
The right column shows the evaluation value in our
experiment.
Table 2: Grouping results.
Group Evaluation
Cell, Vegeta 5.0
Krillin, Trunks 3.8
Goku, Gohan 5.0
Tien Shinhan, Piccolo 3.0
#18, #16 4.8
average 4.3
3.4 Generating Character Connections
We generated character connections using the
frequencies of characters, their related scores, and
groups. The algorithm is shown in Figure 4.
Step 1. Characters whose frequencies are in the top
three are displayed at the center.
Step 2. Characters whose frequencies are ranked
fourth or fifth are displayed alongside.
Step 3. When there are groups for all displayed
characters, the characters in identical groups are
displayed near the displayed characters.
Step 4. Characters who are not displayed in Step 1 to
3 are displayed alongside by ordering frequencies.
Step 5. Lines are drawn between characters whose
related scores are exceed 10.
Figure 4: Algorithm of generating character connections.
For example, Cell, Vegeta, Krillin, Trunks are
displayed at the center in Step 1. Goku is displayed
at the top left in the Step 2. Gohan is displayed near
Goku in Step 3. After character connections are
displayed, the position of some characters (e.g.
Krillin and Trunks) are moved by manually, as in
Figure 2.
4 EXPERIMENT
4.1 Overview
Dragon Ball vol.32 (a book with 126 pages and 12
chapters) was used for the experiment. 12 characters
were identified. Five subjects (four male and one
female, aged 22-28) who have already read some
volumes of Dragon Ball participated in the
experiment.
We investigated (1) relatedness, (2) grouping,
and (3) character connections.
4.2 Relatedness
The five subjects evaluated the relatedness between
12 characters by five values (5: very related; 4;
related; 3: intermediate; 2: not very related; 1:
unrelated).
From these results, relations whose related
values exceeded 3.6 were extracted and sorted. We
treat this table a correct data set. The first raw of the
table is shown in Table 3.
Table 3: Correct data set for related scores.
1 2 3 4 5 6
Ce Ve 18 Go Kl Tr 16
Note: See Table 1 for abbreviations for characters.
We prepared the following comparative
methods: (a) calculated related values only using
inside frames (inside only) and (b) calculating
related values only using outside frames (outside
only).
We created a related table (Table 4) for each
method. Characters ranked under 7 were omitted
because there was no correct answer. We counted
the rank of the correct dataset: smaller is better.
Table 4 shows the table for our method. For example,
for the first raw Cell, 1 (Vegeta) + 5 (Trunks) + 6
(#16) + 4 (Krillin) + 2 (#18) + 3 (Goku) = 21. The
totals for our method, inside only, and outside only
were 62, 66, and 63, respectively. Our method was
the best.
CREATING CHARACTER CONNECTIONS FROM MANGA
679

Table 4: Dataset for our method.
1 2 3 4 5 6
Ce Ve * Tr * 16 * Kl * 18 * Go*
Ve Ce * Tr * Go* Kl 16 18
Kl Tr * Ce * 18 * Bu * 16 Ve
Tr Kl * Ce * Ve * Go Bu 16
Go Gh* Ti Ce * Tr Ve * Pi
18 16 * Kl * Ce * Ve Tr Ti
16 18 * Ce * Kl Ve Tr Ti
Gh Gk* Bu Tr Ti Pi Po
Bu Kl * Tr Pi Go Gh Ti
Ti Go Pi Ce Bu Gh Tr
Pi Ti Go Bu Tr Gh Ve
Po Go Gh Tr Ve Pi Ti
Note: *: correct
4.3 Grouping
Five subjects evaluated whether the generated
groups were appropriate by five values (5: very
appropriate; 4: appropriate; 3: intermediate; 2: not
very appropriate; 1: inappropriate).
The average value was 4.3 (See Table 2), and the
result shows the grouping algorithm is satisfactory.
4.4 Character Connections
Five subjects evaluated the created character
connections by five values as grouping. Finally, we
conducted interviews about the above experiments.
The average evaluation value for the character
connection was 4.4. All subjects believed that Cell
was the most important character, although Goku is
the hero of the Dragon Ball. They felt that the
positions of Cell (center) and Goku (upper left) were
appropriate.
These results suggest that the created character
connections expressed the contents of the volume
well and the frequency of the characters indicates
the importance.
5 RELATED WORK
No previous research creates character connections
from manga or comics.
Some research create character connections from
other media. Goto et al. (2008) create character
charts from EPG texts that introduce movies. Both
studies use natural language understanding
techniques to identify relations between characters.
They do not deal with manga or comics.
Spysee, whose algorithm is based on Matsuo et
al. (2006) extracts person information from the Web
and displays social networks. Some famous
character names were input as person names. For
example, Cell is connected not only with such other
characters as Krillin but also a voice actor of Cell in
animation based on manga. This method is not
adequate to express the character connections of
designated units such as chapters or volumes.
Ogasawara et al. (2008) extracted persons from
broadcast videos to construct a human correlation
graph and examined both text and image processing;
they didn’t create graphs.
6 SUMMARY
We presented a method to create character
connections from manga using the frequencies of
characters and their co-occurrences by referring to
frames. Preliminary experiments using Dragon Ball
vol. 32 suggest the usefulness of our approach. Since
this is merely the first step of our research, we need
to improve our algorithms and conduct further
experiments using different manga. We believe our
approach is applicable to other types of comics and
should be investigated in the future.
REFERENCES
Reid, C., 2009. Graphic Novel Sales Up 5%; Manga Off
17% , In Publishers Weekly.
Goto, J., Yagi, Y., Aizawa, A., Sekine, S., 2008.
Generation of Correlation Charts from TV programs
based on Anaphora Resolution. In The 22nd Annual
Conference of the Japanese Society for Artificial
Intelligence. (CD-ROM) (in Japanese).
Matsuo, Y., Mori, J., Hamasaki, M., Ishida, K., Nishimura,
T., Takeda, H., Hashida, K., Ishiduka, M., 2006.
Polyphonet: An advanced social network extraction
system, In WWW2006, 397-406.
Ogasawara, T., Takahashi, T., Ide, I, Muase, H., 2005.
Construction of a Human Correlation Graph from
Broadcasted Video, In The 22nd Annual Conference of
the Japanese Society for Artificial Intelligence. (CD-
ROM) (in Japanese).
ICAART 2011 - 3rd International Conference on Agents and Artificial Intelligence
680
