
COMPARISON OF LINEAR CLASSIFICATION METHODS FOR
P300 BRAIN-COMPUTER INTERFACE ON DISABLED SUBJECTS
Nikolay V. Manyakov, Nikolay Chumerin, Adrien Combaz and Marc M. Van Hulle
Laboratory for Neuro- and Psychofysiology, K.U.Leuven, Herestraat 49, POBox 1021, 3000 Leuven, Belgium
Keywords:
Brain-computer interface, P300, Linear classifier, Classification accuracy, Amyotrophic lateral sclerosis, Mid-
dle cerebral artery stroke, Subarachnoid hemorrhage.
Abstract:
In this paper, we investigate the accuracy of linear classification techniques for a P300 Brain-Computer Inter-
face used in a typing paradigm. Fisher’s Linear Discriminant Analysis (LDA), Bayesian Linear Discriminant
Analysis (BLDA), Stepwise Linear Discriminant Analysis (SLDA), linear Support Vector Machine (SVM)
and a method based on Feature Extraction (FE) were compared. Experiments were performed on patients
suffering from Amyotrophic Lateral Sclerosis (ALS), middle cerebral artery (MCA) stroke and Subarachnoid
Hemorrhage (SAH), in on-line and off-line mode. Our results show that BLDA yields a significantly higher
accuracy than the other linear techniques we have compared, at least for our group of subjects.
1 INTRODUCTION
Research on brain-computer interfaces (BCIs) has
witnessed a tremendous development in recent years
(Sajda et al., 2008), and has enjoyed much attention
even in popular media. Although a lot of research
was done on invasive BCIs, leading to brain implants
decoding neural activity directly, which are primarily
tested on animals, noninvasive BCIs, e.g., based on
electroencephalograms (EEG) recorded on the sub-
ject’s scalp, have recently enjoyed an increasing at-
tention since they do not require any surgical pro-
cedure, and can therefore be more easily tested on
human subjects. Several noninvasive BCI paradigm
have been described in the literature, but the one we
concentrate on, relies on the event-related potential
(ERP, a stereotyped electrophysiological response to
an internal or external stimulus (Luck, 2005)).
One of the most explored ERPs is the P300. It can
be detected while the subject is shown two types of
events with one occurring much less frequently than
the other (”rare event”). The rare event elicits an ERP
consisting of an enhanced positive-going signal com-
ponent with a latency of about 300 ms after stimulus
onset (Luck, 2005). In order to detect the ERP, the
recording of one trial is usually not enough, and the
recordings of several trials need to be averaged. Aver-
aging is required because the recorded signal is a su-
perposition of the activity related to the stimulus and
all other ongoing brain activity. By averaging, the ac-
tivity that is time-locked to a known event (e.g., the
onset of the attended stimulus) is extracted as an ERP,
whereas the activity that is not related to the stimu-
lus onset is expected to be averaged out. The stronger
the ERP signal, the fewer trials are needed, and vice
versa.
There has been a growing interest in the ERP de-
tection problem, as witnessed by the increased avail-
ability of BCIs that rely on ERP detection. A noto-
rious example is the P300 mind-typer (Farwell and
Donchin, 1988), and with which subjects are able to
type words and sentences on a computer screen. This
application meets the BCI’s primary goal, namely, to
improve the quality of life of neurologically impaired
patients suffering from pathologies such as: amy-
otrophic lateral sclerosis, brain stroke, brain/spinal
cord injury, cerebral palsy, muscular dystrophy, etc.
But, as is mostly the case with BCI research, they
have been tested primarily on healthy subjects. Only
very few attempts have been made on patients (Ni-
jboer et al., 2008; Sellers and Donchin, 2006; Pic-
cione et al., 2006; Hoffmann et al., 2008; Silvoni
et al., 2009; Sellers et al., 2010). Several of these
patient tests (Nijboer et al., 2008; Sellers et al., 2010)
deal with P300-based on-line typing, however, since
only very few patients were tested, it is still must be
investigated whether the P300 mind-typer is suited for
them.
In addition, studies that report on the perfor-
mance of different P300 classifiers were only made
328
V. Manyakov N., Chumerin N., Combaz A. and M. Van Hulle M..
COMPARISON OF LINEAR CLASSIFICATION METHODS FOR P300 BRAIN-COMPUTER INTERFACE ON DISABLED SUBJECTS.
DOI: 10.5220/0003273903280334
In Proceedings of the International Conference on Bio-inspired Systems and Signal Processing (BIOSIGNALS-2011), pages 328-334
ISBN: 978-989-8425-35-5
Copyright
c
2011 SCITEPRESS (Science and Technology Publications, Lda.)

for healthy subjects. It, thus, remains to be seen how
the comparison will look like for disabled subjects,
and how this will affect the choice of the best classi-
fier. This is indeed an important question since the
P300 responses from healthy subjects and disabled
patients can be quite different (Sellers and Donchin,
2006). Thus, the results of the classification perfor-
mance comparison for healthy subjects could possi-
bly not be valid for disabled ones. In addition, the
outcomes of the comparison, performed on healthy
subjects, also lead to slightly different conclusions.
In (Krusienski et al., 2006) a comparison of several
classifiers (Pearson’s correlation method, Fisher’s lin-
ear discriminant analysis (LDA), stepwise linear dis-
criminant analysis (SLDA), linear support-vector ma-
chine (SVM) and Gaussian kernel support vector ma-
chine) was performed on 8 healthy subjects. It was
shown that SLDA and linear SVM render the best
overall performance. In (Mirghasemi et al., 2006) it
was shown that, among linear SVM, Gaussian kernel
SVM, multi-layer perceptron, LDA and kernel LDA,
the best performance was achieved by LDA. Based on
these studies, albeit different sets of classifiers were
used in the comparison, one can conclude that lin-
ear classifiers work better than nonlinear ones, at least
for the P300 BCI. This statement is also supported by
other researchers (e.g., in (Lotte et al., 2007)).
Figure 1: Typing matrix of the Mind Speller. Rows and
columns are flashed in random order; one trial consists of
flashing all six rows and all six columns. The intensification
of the third column (left panel) and the second row (right
panel) are shown.
In this paper, we report on tests performed on
a group of partially disabled patients suffering from
Amyotrophic Lateral Sclerosis (ALS), Middle Cere-
bral Artery (MCA) stroke, and Subarachnoid Hemor-
rhage (SAH). We compare several linear techniques
for P300 BCI classification. In addition to the linear
techniques mentioned above, we also add two more
methods (i.e., Bayesian linear discriminant analysis
and a method based on feature extraction). Thus, in
our study we compare a much more extensive set of
linear classification techniques, and perform our com-
parison on disabled patients, instead of healthy sub-
jects, both of which distinguishes our approach from
others.
2 METHODS
2.1 EEG Data Acquisition
The EEG recordings were performed using a proto-
type of an ultra low-power 8-channels wireless EEG
system. The wireless EEG system was developed
by IMEC
1
and built around their ultra-low power 8-
channel EEG amplifier chip (Yazicioglu et al., 2006).
The data are transmitted with a sampling frequency
of 1000 Hz for each channel. We used a brain-cap
with large filling holes and sockets for activeAg/AgCl
electrodes (ActiCap, Brain Products). The recordings
were made with eight electrodes located primarily on
the parietal pole, namely at positions Cz, CPz, P1, Pz,
P2, PO3, POz, PO4, according to the international
10–20 system. The reference electrode and ground
were placed on the left and right mastoids.
2.2 Experiment Design
Twelve subjects, na¨ıve to BCI applications, partici-
pated in the experiments (ten male and two female,
aged 37–66 with an average age of 51.25). The sub-
jects were suffering from different types of brain dis-
orders. The experimental protocol was approved by
the ethical committee. After the recordings were
made, four subjects were excluded from further clas-
sifier comparison, since their performance was close
to chance level, which could be due to the nature of
their brain disorder or because they did not understand
the experiment. The information about the patients
(EEG data of which where used for the analysis) in-
cluding their diagnoses, age and gender is presented
in Table 1.
We have used the same visual stimulus paradigm
as the one used in the first P300-based speller, which
was introduced by Farwell and Donchin in (Farwell
and Donchin, 1988): a matrix of 6×6 symbols. Each
experiment was composed of a training and several
testing stages. During both stages, columns and rows
of the matrix were intensified (see Figure 1) in a ran-
dom manner. The intensification duration was set to
100 ms, followed by a 100 ms of no intensification.
Each column and each row flashed only once during
one trial, so each trial consisted of 12 stimulus pre-
sentations.
During the training stage, 11 symbols, taken from
the typing matrix, were presented to the subject. For
each symbol, 10 intensification for each row/column
were performed. The subject was asked to count the
1
Interuniversity Microelectronics Centre (IMEC),
http://www.imec.be
COMPARISON OF LINEAR CLASSIFICATION METHODS FOR P300 BRAIN-COMPUTER INTERFACE ON
DISABLED SUBJECTS
329

Table 1: Information about the patients.
Patient ID Age Gender Diagnosis
subject 1 43 M Amyotrophic lateral sclerosis (2002). Moderate bulbar palsy. Severe weakness
of upper and lower limbs and spasticity in lower limbs.
subject 2 51 M Right MCA stroke (2008) with hypertension (stage II) and mild left hemipare-
sis.
subject 3 58 M Spontaneous SAH and secondary intracerebral hemorrhage in the right hemi-
sphere (2002) with hypertension (stage III) and severe left hemiparesis.
subject 4 54 F Left MCA stroke (2005) with mild motor aphasia and right hemiparesis.
subject 5 52 M Posterior circulation stroke (2002). Right hemiparesis with dysarthria.
subject 6 54 M Left MCA stroke (16.10.2009) with right hemiparesis and motor aphasia.
subject 7 36 M Acute left MCA stroke with partial motor aphasia, right hemisensory loss.
subject 8 65 M Right MCA stroke (2008) with hypertension (stage III) and mild left hemipare-
sis.
number of intensifications of the corresponded sym-
bol. The counting was used only for keeping subject’s
attention on the symbol.
The recorded data was filtered (in the 0.5–15 Hz
frequency band with a fourth-order zero-phase dig-
ital Butterworth filter) and properly cut into signal
tracks. Each of these tracks consisted of 1000 ms
of recording, starting from the stimulus onset. Then,
each of these tracks was downsampled, by retaining
every 25th sample, and assigned to one of two pos-
sible groups: target and nontarget, according to the
stimuli that they were locked to. For classifier train-
ing, we constructed a set of 1000 target-, and the same
amount of non-targetaveraged brain responses, where
the averages were taken based on k randomly selected
responses from the corresponding groups. The num-
ber k was equal to the number of intensification se-
quences (trails), for each stimulus, during the testing
stage.
Amplitude values at specific moments in time, of
the downsampled EEG signal, restricted to the in-
terval 100–750 ms after stimuli onset, were taken
as features. All these features were normalized to
their Z-score through the estimation of f
n,t
= (x
n
(t)−
x
n
(t))/σ
x
n
(t)
, where x
n
(t) is the EEG amplitude of n-
th channel (electrode) at time t, after the stimulus on-
set, x
n
(t) the average of x
n
(t) and σ
x
n
(t)
the standard
deviation for all training examples of both the target
and nontarget recordings of the training set. Com-
bining all those features, we obtained a feature vector
f = [ f
1
,..., f
N
]
T
, which was used as input for the lin-
ear classifier w
1
f
1
+ w
2
f
2
+ ···+ w
n
f
n
+ b = w
T
f+ b
(see further)
2
. After substitution of the feature vec-
tor f into the abovementioned equation, we obtain a
2
Since we use Z-scores as features, and since we use
a balanced training set (equal numbers of target and non-
target responses), the parameter b should be close to zero.
distance (multiplied by factor
√
w
T
w) from the point
in feature space to the separating hyperplane, with the
sign indicating to which side of the hyperplane the
point belongs, i.e., the target or non-target class.
After training the classifier, each subject per-
formed several on-line test sessions during which
(s)he was asked to mind-type a few words. The typing
performance (ratio of correctly typed symbols) was
used for estimating the classification accuracy. For
these on-line test sessions, we used the classifier that
was trained on data averaged over 15 trials. Thus,
each subject attempted to type a symbol based on 15
row/column intensifications. During typing, the EEG
data was stored for further off-line analysis based on
a smaller amount k of trials (in this case we used all
k-combination of 15 trails for each typed letter for as-
sessing the accuracy).
The testing stage differs from the training stage
by the way the signal tracks were grouped. During
training, the system “knows” exactly which one of 36
possible symbols is attended by the subject at any mo-
ment of time. Based on this information, the collected
signal tracks can be grouped into only two categories:
target (attended) and non-target (not attended). How-
ever, during testing, the system does not know which
symbol is attended by the subject, and the only mean-
ingful way of grouping is by stimulus type (which in
the proposed paradigm can be one of 12 types: 6 rows
and 6 columns). Thus, during the testing stage, for
each trial, we had 12 tracks (from all 12 groups) of
1000 ms EEG data recorded from each electrode. The
averaged EEG response for each electrode was deter-
mined for each group. The selected features of the av-
eraged data were then fed into the classifier. As a re-
sult, the classifier produces 12 (for each row/column)
values (c
1
,...,c
12
) which describe the distance to a
separating hyperplane in the feature space together
with the sign. The row index i
r
and the column in-
BIOSIGNALS 2011 - International Conference on Bio-inspired Systems and Signal Processing
330

dex i
c
of the classified symbol were calculated as:
i
r
= argmax
i=1,...,6
{c
i
}, and i
c
= argmax
i=7,...,12
{c
i
}−6.
The symbol on the intersection of the i
r
-th row and
i
c
-th column in the matrix was then taken as the result
of the classification and presented, as a feedback, to
the subject in the on-line session.
3 CLASSIFICATION METHODS
3.1 Fisher’s Linear Discriminant
Analysis
Fisher’s Linear Discriminant Analysis (LDA) is one
of the most widely used classifiers in P300 BCI sys-
tems (Krusienski et al., 2006; Panicker et al., 2010).
It was reported that it can even outperform other clas-
sifiers (Mirghasemi et al., 2006). Its main idea is
to find a projection from the N-dimensional feature
space onto a one dimensional space w
T
f for which
the ratio of the variance between the two classes (tar-
get and non-target) vs. the variance within the classes
is maximal. This ’optimal’ projection is estimated as
w = (Σ
−1
+ Σ
+1
)
−1
(µ
+1
−µ
−1
), where Σ and µ de-
fine the covariances and the means of the two classes
(target and non-target) that need to be separated.
3.2 Stepwise Linear Discriminant
Analysis
Stepwise Linear Discriminant Analysis (SLDA) was
used in the patient studies of P300 BCI (Nijboer
et al., 2008; Sellers and Donchin, 2006). It can be
considered as an extension of LDA with an incor-
porated filter feature selection. SLDA adds and re-
moves terms from a linear discriminant model based
on their statistical significance in regression, thus,
producing modelthat is adjustable to the training data.
It was shown that SLDA performs equally well or
even better than several other classification methods
in P300 BCI (Krusienski et al., 2006). For our com-
parison analysis, we have used the same procedure
as in (Krusienski et al., 2006) (in the forward step,
the entrance tolerance p-value < 0.1; in the backward
step, the exit tolerance p-value > 0.15). The process
is iterated until convergence, or until it reaches a pre-
defined number of 60 features.
3.3 Bayesian Linear Discriminant
Analysis
Bayesian Linear Discriminant Analysis (BLDA) was
used for P300 BCI in patients (Hoffmann et al., 2008).
It is based on a probabilistic regression network. As-
sume that the targets t
i
(in the case of a classification
problem these are +1 and −1) are linearly dependent
on the observed features f
i
= [ f
i
1
,..., f
i
N
]
T
with an ad-
ditive Gaussian noise term ε
n
: t
i
= w
T
f
i
+ ε
i
. As-
suming further an independent generation of the ex-
amples from a data set, the likelihood of all data is
p(t|w,σ
2
) =
∏
N
i=1
(2πσ
2
)
−1/2
exp
−
(t
i
−w
T
f
i
)
2
2σ
2
. Ad-
ditionally to this, we have to introduce a prior dis-
tribution over all weights as a zero-mean Gaus-
sian p(w|α) =
∏
n
j=1
α
2π
1/2
exp
−
α
2
w
2
j
. Using
Bayes’s rule, we can define the posterior distribu-
tion p(w|t,α,σ
2
) = (p(t|w, σ
2
)p(w|α))/p(t|α,σ
2
),
which is Gaussian with mean µ = (F
T
F+σ
2
αI)
−1
F
T
t
and covariance matrix Σ = σ
2
(F
T
F+ σ
2
αI)
−1
, where
I is an identity matrix and F is a matrix with each
row corresponding to a training example in feature
space, t a column-vector of true labels (classification)
for all corresponding training examples. As a result,
our separation plane will have the form µ
T
f. This so-
lution is equivalent to a penalized least-square esti-
mate E(w) =
1
2σ
2
∑
N
i=1
(t
i
−w
T
f
i
)
2
+
α
2
∑
n
j=1
w
2
j
(Tip-
ping, 2004).
3.4 Linear Support Vector Machine
In P300 BCI research, Support Vector Machine
(SVM) is regarded as one of the more accurate classi-
fiers (Thulasidas et al., 2006; Krusienski et al., 2006).
The principal idea of a linear SVM is to find the
separating hyperplane, between two classes, so that
the distance between the hyperplane and the clos-
est points from both classes is maximal. In other
words, we need to maximize the margin between
the two classes (Vapnik, 1995). Since it is not al-
ways the case that the two classes are linearly sep-
arable, the linear SVM idea was also generalized to
the case where data points are only required to fall
within the margin (and even are on the wrong side
of the decision boundary) by adding a regularization
term. For our analysis, we used use method proposed
in (Combaz et al., 2010), which uses linear least-
squares SVM (Suykens et al., 2002) to solve the min-
imization problem min
w,b,e
(
1
2
w
T
w) + γ
∑
N
i=1
e
2
i
with
respect to y
i
(w
T
f
i
+ b) = 1 −e
i
, i = 1,...,n, where f
i
corresponds to training points in feature space, and y
i
is the associated output (+1 for the responses to the
target stimulus and −1 for the non-target stimulus).
COMPARISON OF LINEAR CLASSIFICATION METHODS FOR P300 BRAIN-COMPUTER INTERFACE ON
DISABLED SUBJECTS
331
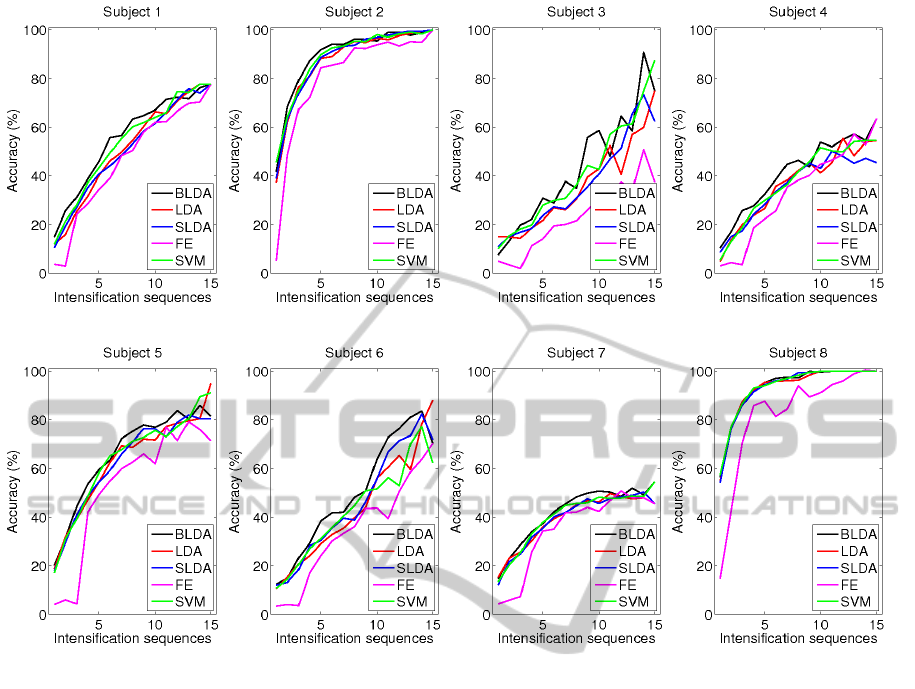
Figure 2: Classification accuracy as a function of the number of intensifications for every subject, and for all discussed
classification methods.
The regularization parameter is estimated through a
line search on cross-validation results.
3.5 Method based on Feature
Extraction
Another classification method in P300 BCI research
(Chumerin et al., 2009) relies on the one-dimensional
version of a linear feature extraction (FE) ap-
proach proposed by Leiva-Murillo and Art´es-Rodr´ı-
guez in (Leiva-Murillo and Artes-Rodriguez, 2007).
The method searches for the ”optimal” subspace max-
imizing (an estimate of) the mutual information be-
tween the set of projections Y = {w
T
f
i
} and the set
T of corresponding labels t
i
= {−1,+1}. Accord-
ing to (Leiva-Murilloand Artes-Rodriguez, 2007), the
mutual information between the set of projections Y,
and the set of corresponding labelsC can be estimated
as: I(Y,C) =
∑
N
t
p=1
p(t
p
)(J(Y|t
p
) −logσ(Y|t
p
)) −
J(Y), with N
t
= 2 the number of classes, Y|t
p
the
projection of the p-th class’ data points onto the di-
rection w, σ(·) the standard deviation, and J(·) the
negentropy, estimated using Hyv¨arinen’s robust esti-
mator (Hyv¨arinen, 1998).
4 RESULTS
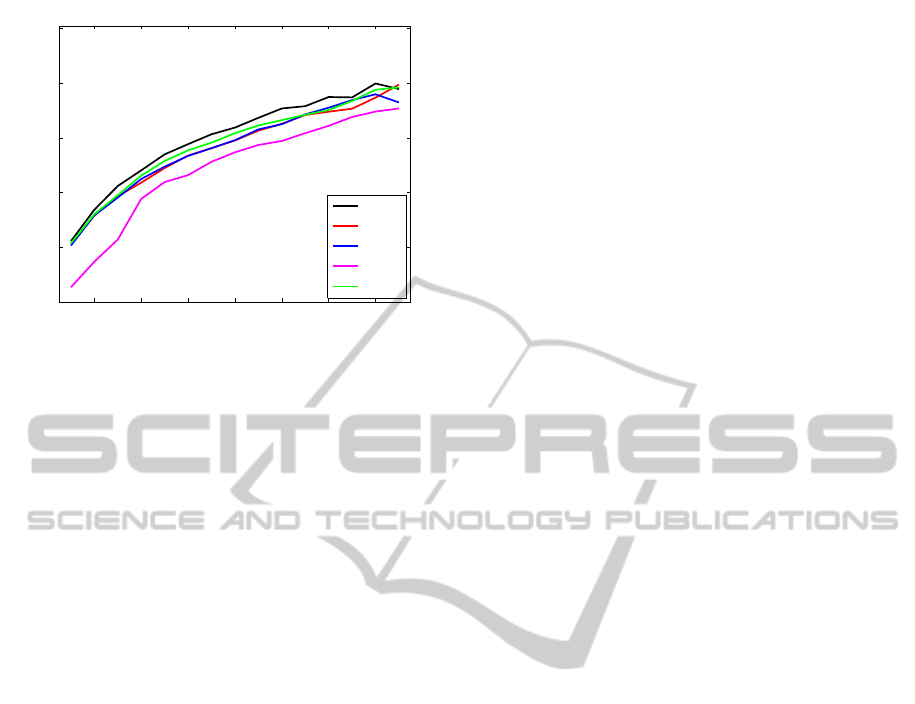
The performance results are shown in Figure 2 for in-
dividual subjects, and in Figure 3 as a grand average
among all subjects. In order to verify the statistical
significance of the comparison, we used the nonpara-
metric Friedman’s test (Corder and Foreman, 2009)
between each pairs of different methods to test the
difference in the medians of the accuracy results. We
have found that the accuracy based on BLDA is sig-
nificantly (p < 0.001) better than any other. Linear
SVM is second. As for SLDA and LDA, there is no
any significant difference between them.
We have also analyzed the mistyped (erroneously
detected) symbols [results not shown]. We havefound
that, for all classification method, the misclassifica-
tions mostly occur for either a misclassified row or
column, and the erroneously typed symbols are in
BIOSIGNALS 2011 - International Conference on Bio-inspired Systems and Signal Processing
332
2 4 6 8 10 12 14
0
20
40
60
80
100
Intensification sequences
Accuracy (%)
BLDA
LDA
SLDA
FE
SVM
Figure 3: Average classification accuracy as a function of
the number of intensifications for all discussed classifica-
tion methods.
close proximity on the screen to the desired ones.
We observed that some subjects were not com-
fortable with the visual stimulation protocol we used
during the on-line sessions. This discomfort was ex-
pressed by the frequent (3–8 Hz) eye blinking of the
subjects. For those subjects, we had to adapt the stim-
ulation protocol in terms of the interstimuli interval,
which was increased up to 300 ms (150 ms of inten-
sification followed by 150 ms of no intensification).
This shows that working with patients can be quite
different.
5 CONCLUSIONS
We have compared five linear classification methods
for a P300-based BCI, tested on disabled patients. We
have found that BLDA yields significantly better re-
sults compared to the other classification methods we
considered, with linear SVM as the second one in
accuracy. These results can be helpful in deciding
what classifier to use for patients. Additionally to this,
since the classifiers could produce differentoutcomes,
one could benefit from combining them using a co-
training approach (Panicker et al., 2010), to improve
the classification performance.
ACKNOWLEDGEMENTS
NVM is supported by the Flemish Regional Min-
istry of Education (Belgium) (GOA 10/019). NC is
supported by the European Commission (IST-2007-
217077). AC is supported by a specialization grant
from the Agentschap voor Innovatie door Weten-
schap en Technologie (IWT, Flemish Agency for In-
novation through Science and Technology). MMVH
is supported by research grants received from the
Excellence Financing program (EF 2005) and the
CREA Financing program (CREA/07/027) of the
K.U.Leuven, the Belgian Fund for Scientific Research
- Flanders (G.0588.09), the Interuniversity Attraction
Poles Programme – Belgian Science Policy (IUAP
P6/054), the Flemish Regional Ministry of Education
(Belgium) (GOA 10/019), and the European Commis-
sion (STREP-2002-016276, IST- 2004-027017, and
IST-2007-217077), and by the SWIFT prize of the
King Baudouin Foundation of Belgium.
The authors wish to thank Valiantsin Raduta and
Yauheni Raduta from Neurology Department of Brest
Regional Hospital (Brest, Belarus) for the assistance
with the recording of EEG data on patients. The
authors also grateful to Refet Firat Yazicioglu, Tom
Torfs and Cris Van Hoof from the Interuniversity Mi-
croelectronics Centre (IMEC) in Leuven for provid-
ing with the wireless EEG system.
We would like to thank Prof. Philip Van Damme
from Experimental Neurology Department at Katho-
lieke Universiteit Leuven for his help in translating
the diagnoses from Russian.
REFERENCES
Chumerin, N., Manyakov, N. V., Combaz, A., Suykens,
J. A., Yazicioglu, R. F., Torfs, T., Merken, P., Neves,
H. P., Van Hoof, C., and Van Hulle, M. M. (2009).
P300 detection based on feature extraction in on-line
brain-computer interface. Lecture Notes in Computer
Science, 5803:339–346.
Combaz, A., Chumerin, N., Manyakov, N. V., Suykens, J.,
and Van Hulle, M. M. (2010). Error-related potential
recorded by eeg in the context of a p300 mind speller
brain-computer interface. In Machine Learning for
Signal Processing, IEEE Workshop on, pages 65–70,
Kittil¨a, Finland.
Corder, G. and Foreman, D. (2009). Nonparametric Statis-
tics for Non-Statisticians: A Step-by-Step Approach.
New York, J. Wiley.
Farwell, L. and Donchin, E. (1988). Talking off the top of
your head: toward a mental prosthesis utilizing event-
related brain potentials. Electroencephalography and
clinical Neurophysiology, 70(6):510–523.
Hoffmann, U., Vesin, J.-M., E. T., and Diserens, K. (2008).
An efficient P300-based brain-computer interface for
disabled subjects. Journal of Neuroscience Methods,
167:115–125.
Hyv¨arinen, A. (1998). New approximations of differen-
tial entropy for independent component analysis and
projection pursuit. In Proceedings of the 1997 con-
ference on Advances in neural information processing
COMPARISON OF LINEAR CLASSIFICATION METHODS FOR P300 BRAIN-COMPUTER INTERFACE ON
DISABLED SUBJECTS
333

systems, pages 273–279. MIT Press Cambridge, MA,
USA.
Krusienski, D., Sellers, E., Cabestaing, F., Bayoudh, S.,
McFarland, D., Vaughan, T., and Wolpaw, J.(2006). A
comparison of classification techniques for the P300
Speller. J. Neural. Eng., 3:299–305.
Leiva-Murillo, J. and Artes-Rodriguez, A. (2007). Maxi-
mization of mutual information for supervised linear
feature extraction. IEEE Transactions on Neural Net-
works, 18(5):1433–1441.
Lotte, F., Congedo, M., L´ecuyer, A., Lamarche, F., and Ar-
naldi, B. (2007). A review of classification algorithms
for EEG-based Brain-Computer Interface. Journal of
Neural Engineering, 4:R1–R13.
Luck, S. (2005). An introduction to the event-related poten-
tial technique. MIT Press Cambridge, MA.
Mirghasemi, H., Fazel-Rezai, R., and Shamsollahi, M.
(2006). Analysis of P300 classifiers in Brain Com-
puter Interface speller. In Proceedings of the 28th
IEEE EMBS Annual International Conference, pages
6205–6208.
Nijboer, F., Sellers, E., Mellinger, J., Jordan, M., Matuz,
T., Furdea, A., Halder, S., Mochty, U., Krusienski, D.,
Vaughan, T., Wolpaw, J., Birbaumer, N., and K¨ubler,
A. (2008). A P300-based brain-computer interface
for people with amyotrophic lateral sclerosis. Clini-
cal Neurophysiology, 119:1909–1916.
Panicker, R., Puthusserypady, S., and Sun, Y. (2010). Adap-
tation in P300 Brain-Computer Interface: A two-
classifier co-training approach. IEEE Trans Biomed
Eng, 57.
Piccione, F., Giorgi, F., Tonin, P., Priftis, K., Giove, S., Sil-
voni, S., Palmas, G., and Beverina, F. (2006). P300-
based brain-computer interface: Reliability and per-
formance in healthy and paralysed participants. Clin-
ical Neurophysiology, 117:531–537.
Sajda, P., M¨uller, K.-R., and Shenoy, K. (2008). Brain-
computer interfaces. IEEE Signal Proccessing Maga-
zine, 25(1):16–17.
Sellers, E. and Donchin, E. (2006). A P300-based brain-
computer interface: Initial test by ALS patients. Clin-
ical Neurophysiology, 117:538–548.
Sellers, E., Vaughan, T., and Wolpaw, J. (2010). A brain-
computer interface for long-term independent home
use. Amyotrophic Lateral Sclerosis, pages 1–7.
Silvoni, S., Volpato, C., Cavinato, M., Marchetti, M.,
Priftis, K., Merico, A., Tonin, P., Koutsikos, K., Bev-
erina, F., and Piccione, F. (2009). P300-Based Brain-
Computer Interface Communication: Evaluation and
Follow-up in Amyotrophic Lateral Sclerosis. Fron-
tiers in Neuroscience, 3(60):1–12.
Suykens, J., Van Gestel, T., De Brabanter, J., De Moor, B.,
and Vanderwalle, J. (2002). Least square support vec-
tor machines. World Scientific, Singapore.
Thulasidas, M., Guan, C., and Wu, J. (2006). Robust clas-
sification of EEG signal for brain-computer interface.
IEEE Transactions on Neural Systems and Rehabili-
tation Engineering, 14(1):24–29.
Tipping, M. E. (2004). Bayesian inference: An introduc-
tion to principles and practice in machine learning. In
Bousquet, O., von Luxburg, U., and R¨atsch, G., edi-
tors, Advanced Lectures on Machine Learning, pages
41–62. Springer.
Vapnik, V. (1995). The Nature of Statistical Learning The-
ory. Springer-Verlag.
Yazicioglu, R., Merken, P., Puers, R., and Van Hoof, C.
(2006). Low-power low-noise 8-channel EEG front-
end ASIC for ambulatory acquisition systems. In The
32nd European Solid-State Circuits Conference. Pro-
ceedings of, pages 247–250.
BIOSIGNALS 2011 - International Conference on Bio-inspired Systems and Signal Processing
334
