
COMPUTER ASSISTED CANCER DIAGNOSIS SYSTEM
USING PET/CT DELAYED SCAN IMAGE
Rui Zhang, Takako Sato and Hiroshi Arisawa
Graduate School of Yokohama Nat. Univ., 79-7, Tokiwadai, Hodogayaku, Yokohama, 240-8501,Japan
Keywords: PET/CT, Whole-body delayed scan, CAD, CADS, Tumor detection, SUV, DTA.
Abstract: In this paper, a new method for CADS (computer assisted diagnosis system) is proposed: whole-body
PET/CT delayed scan. Whole-body PET/CT imaging is quite useful for detecting cancerous regions,
however sometimes too many “suspicious areas” due to ambiguous signs within 3D images. We propose a
method in which two images i.e. original images and whole-body delayed scan images are compared and
the true positive regions are identified. For the purpose of detection, a matching algorithm for comparing
each region on both two images has been developed. It contributes not only to improve accuracy of a
diagnosis but to reduce “false positive” regions. We compare this new method with the routine one and
show its supporting technologies and advantages. In the end we indicate our research emphasis.
1 BACKGROUND
Since computer-aided diagnosis (CAD) was first
researched by the laboratory of Kurt Rossmann
during the 1980’s, the research on CAD systems has
been increasing, which constituted a sturdy
foundation for the basis of CAD systems. One
application for these systems is aiding radiologist
with growing burden of making effective and
efficient diagnoses from increasing amounts of
imaging data. For that end, a large number of
research on computer assisted diagnosis system
(CADS) has been proposed (Jiang et al, 2001)
(Toriwaki,
2000) (Tsai and Lee, 2001) (Cheng,
Akiyama, Wang, Itoh, 1998) (Ukai, 2000).
The diagnostic method for cancer detection using
the PET/CT images is a core technology in CADS; it
has shown its superiority in the clinical management
of cancer. During cancer inspection by PET/CT scan,
drugs called FDG (fluorodeoxyglucose) are injected
into patient. After 1 hour, gamma rays emitted from
the patient are photographed by the nuclear imaging
system. Because much more FDG is taken into a
cancer cell than a normal cell, as a result, we
observed the concentration of FDG absorbed by the
tissues and organs to distinguish between normal and
abnormal areas.
To further improve the accuracy of the diagnosis,
a second scan, known as PET delayed scan is
performed. A half hour after the PET/CT scan a PET
delayed scan is performed at specific areas where
potential tumor was shown in the original
whole-body scan. By comparing the original image
with the delayed scan image, a more accurate
diagnosis is achieved. If the value of SUV (standard
uptake value) of a certain part in the delayed scan
image is higher than the corresponding part’s SUV in
the whole-body scan, this part is likely to be a
malignant pattern which indicates a true positive.
Otherwise this part is likely to be a benign pattern
which means it is a true negative. PET delayed scan
is not very prevalent in the diagnosis for tumor
detection. Only a few hospitals use it for about 10%
of their patients.
Still PET delayed scan is one of the promising
technologies for the medical image processing
system. But this technology is only applied to
specific parts of the body but not to the entire body.
So we propose a new method of cancer diagnosis:
Whole-body PET/CT delayed scan with CADS.
2 PROCEDURE OF NEW
METHOD OF WHOLE-BODY
PET/CT DELAYED SCAN
A large number of data and experiments testify the
usefulness of dual time imaging in tumor detection
(Matthies et al, 2002) (Zhuang et al, 2001).
399
Zhang R., Sato T. and Arisawa H..
COMPUTER ASSISTED CANCER DIAGNOSIS SYSTEM USING PET/CT DELAYED SCAN IMAGE .
DOI: 10.5220/0003287203990404
In Proceedings of the International Conference on Health Informatics (HEALTHINF-2011), pages 399-404
ISBN: 978-989-8425-34-8
Copyright
c
2011 SCITEPRESS (Science and Technology Publications, Lda.)
Part-body delayed scan could distinguish between
malignant and inflammatory lesions by comparing
SUVs of corresponding sites in two images thereby
reducing the false positive results. FDG is absorbed
adequately by the tumor during the half hour after
the first scan so that cancerous areas are diagnosed
more easily, which means delayed scan could
decrease false negative results. However, the
disadvantage of dual time imaging for part of the
body is also obvious. The cancerous cells have the
characteristic of normal metastasis. The site where a
tumor is may be not found if this site shows a false
positive result in the first scan and is excluded from
the delayed scan. So we propose the new method of
PET/CT whole-body delayed scan.
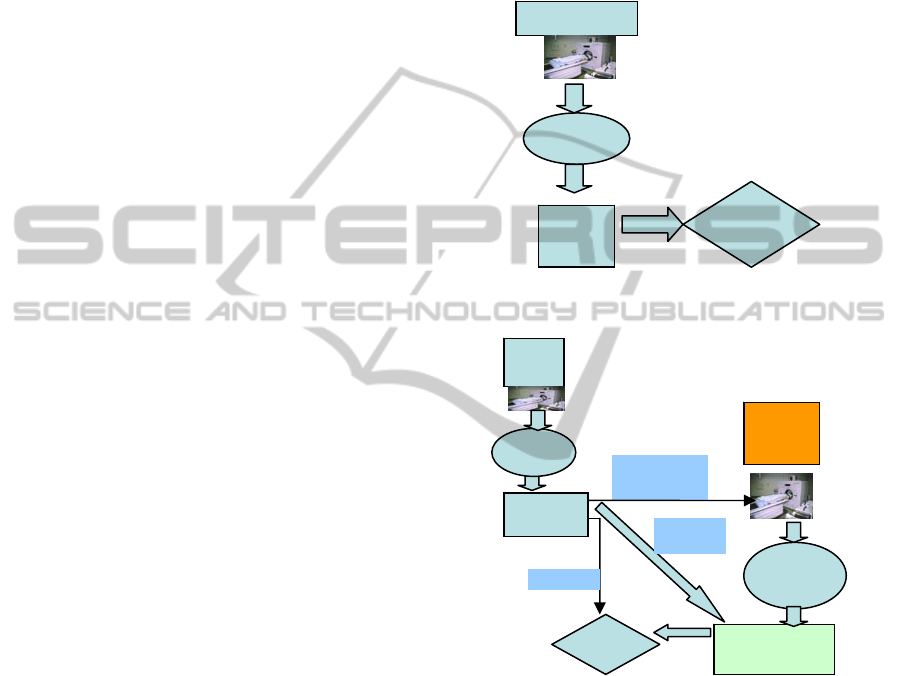
Figure 1 is the description of radiologist’s routine
method of PET/CT scan. Figure 2 describes the
diagnostic process of a delayed scan which is
utilized but not so prevalently nowadays, and Figure
3 shows the procedures of tumor detection using a
whole-body PET/CT delayed scan in the future.
In figure 1, patients accept the whole-body
PET/CT scan only once, and then radiologist makes
the final diagnosis by the PET/CT image. For the
figure 2 and 3, there are three differences between
these two figures: firstly, it is obvious that the
delayed scan of figure 3 is taken over the whole
body while the other is only the suspicious area;
secondly, recently, only 10% of patients could be
subject to a second PET scan on the suspicious parts;
we hope in the future this new cancer diagnosis
method of whole-body PET/CT delayed scan could
be used for all the patients after the first PET scan.
Thirdly, the computer assisted diagnosis system
(CADS) in figure 3 is utilized.
In figure 3, most diagnoses and comparisons are
made by the CADS, not by the doctor. The
whole-body delayed scan process produces the
double workload of reading images for radiologists
because the area of the second image increases to the
whole body. That is the main reason why
whole-body delayed imaging has not been used in
clinical medicine. The CADS will solve this problem
by reducing false positive results significantly and
having the task of comparing the original images
with the delayed images done by a computer. The
doctor only does the final diagnose which is
simplified by the CADS. So the CADS constitutes
the principal advantage and precondition for the
deploying of whole-body delayed scan. Now
Arisawa laboratory in Japan is devoted to the study
of the CADS.
The CADS is a system which imitates diagnosis
of radiologist. The most important part of the CADS
is a diagnosis algorithm which could interpret a
doctor’s methodology during PET/CT scan diagnosis
and uses the proper PET/CT terminology to describe
the program’s action so that it would simulate the
performance of the radiologist. This system is
designed so that a doctor can monitor the process of
diagnosis from the local to the whole body level, to
evaluate diagnosis’s validity and to recommend
improvement.
Figure 1: Routine method of PET/CT scan.
Figure 2: Diagnostic process of delayed scan which is
utilized but not so prevalently nowadays.
3 SUPPORTING
TECHNOLOGIES
The realization of this new method needs many
technologies. Now we introduce supporting
technologies which we are devoted to research.
3.1 Multi-organ Identification and
Cancer Diagnosis
Obtaining an organ’s shape and position is crucial
Doctor’s
diagnosis
PET/CT scan
Final result
images
PET Delayed
scan
for the
suspicious
areas
Delayed
images for
10% patients
Doctor’s
diagnosis
PET/CT
First scan
Doctor’s diagnosis by
comparing two kinds of
images
30mins later, 10%
patients
Final
result
images
10% original
images
90%patients
HEALTHINF 2011 - International Conference on Health Informatics
400
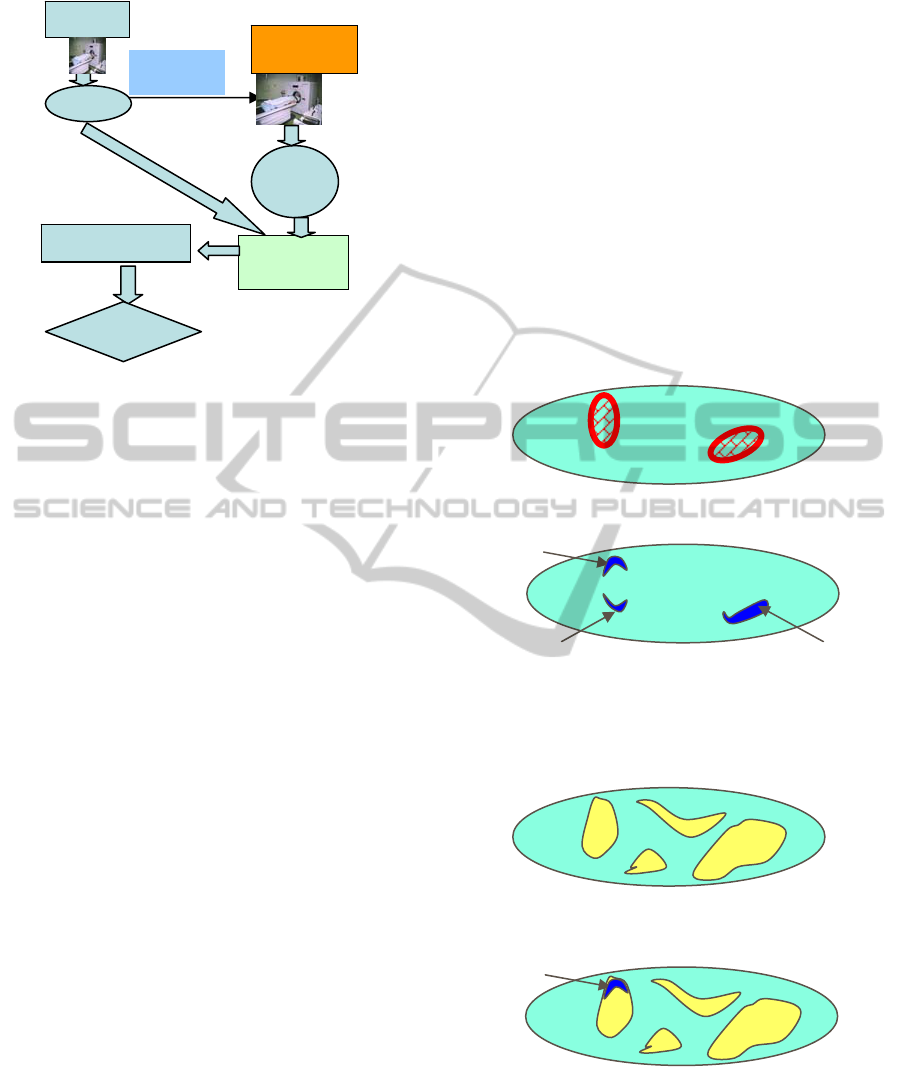
Figure 3: Procedure of tumor detection with the new
method of PET/CT scan for the whole body in the future.
step before tumor detection. Some researchers think
that the first processing step of a CAD system in the
future should understand the normal structure of the
human body by the processing of input images
(Kobatake, 2009). The outline image of an organ
from a PET/CT scan is very useful to confirm the
location of the accumulation of cancer. In general,
PET images readily allow identification of certain
organs like the brain due to high metabolism, while
CT images are most suitable for extracting the areas
of the lungs and the skeleton due to their distinctly
differences in density compared to soft tissue (Wen,
Leung, Eberl, Feng, Bai, 2008). But this issue is the
difficult point in the research of cancer diagnosis all
along.
Multi-organ cancer diagnosis is the future of
computer assisted diagnosis system. There are
different criterions for tumor detection in different
organs. Existing works are mostly focusing on
specific organs such as lung and breast (Takeo,
Shimura, Imamura, Shimizu, Kobatake, 2005).
Research about other organs such as liver,
gallbladder and so on are in the primary stage.
3.2 Dynamic Threshold Adjustment
Setting appropriate threshold values such as SUVs in
PET/CT images contributes to not only identify the
organs and acquire the figures of organs exactly but
also finding tumors and extract the shape of cancer.
Even in one organ, dynamic threshold values are
needed to obtain the organ’s boundary and ensure the
location of cancerous cells. DTA (dynamic threshold
adjustment) method (Arisawa, 2009) is proposed for
this situation. DTA is useful for extracting the
outline of an organ and position of a tumor, it could
elevate the precision of diagnosis and it is an
important focus for further research
In cancer detection, DTA method can notice fine
differences of threshold values of abnormality. That
is, in the preliminary stage, detecting whole
“critical” areas (c-areas) which have sharp increasing
of SUV locally, then calculating the average value
(c-value) of the c-area. This c-area should be
extended if some spots have a higher SUV than
c-value around the original c-area. Finally, for all the
extended c-area refiltering will be done depending
on the organ-specific value. The remaining c-areas
are considered “abnormal” accumulations (Arisawa,
2009).
Figure 4: Target areas for tumour detection.
Figure 5: Extracting the areas which have sharp increasing
of SUV locally, and then calculate the average value of
c-area (c-value of area No1 is 3.0; c-value of No 2 is 2.8;
c-value of No 3 is 4.0).
Figure 6: Obtaining the suspicious areas based on the
c-value of No.1 area.
Figure 7: Preserving the areas which overlap with No.1
area.
First PET/CT
scan
Comparing the two
kinds of images by
CADS
Whole-body PET/CT
delayed scan
Delayed
images for
all patients
Simply diagnosis by doctor
images
Final result
30mins later, all
patients
1
2 3
1
COMPUTER ASSISTED CANCER DIAGNOSIS SYSTEM USING PET/CT DELAYED SCAN IMAGE
401
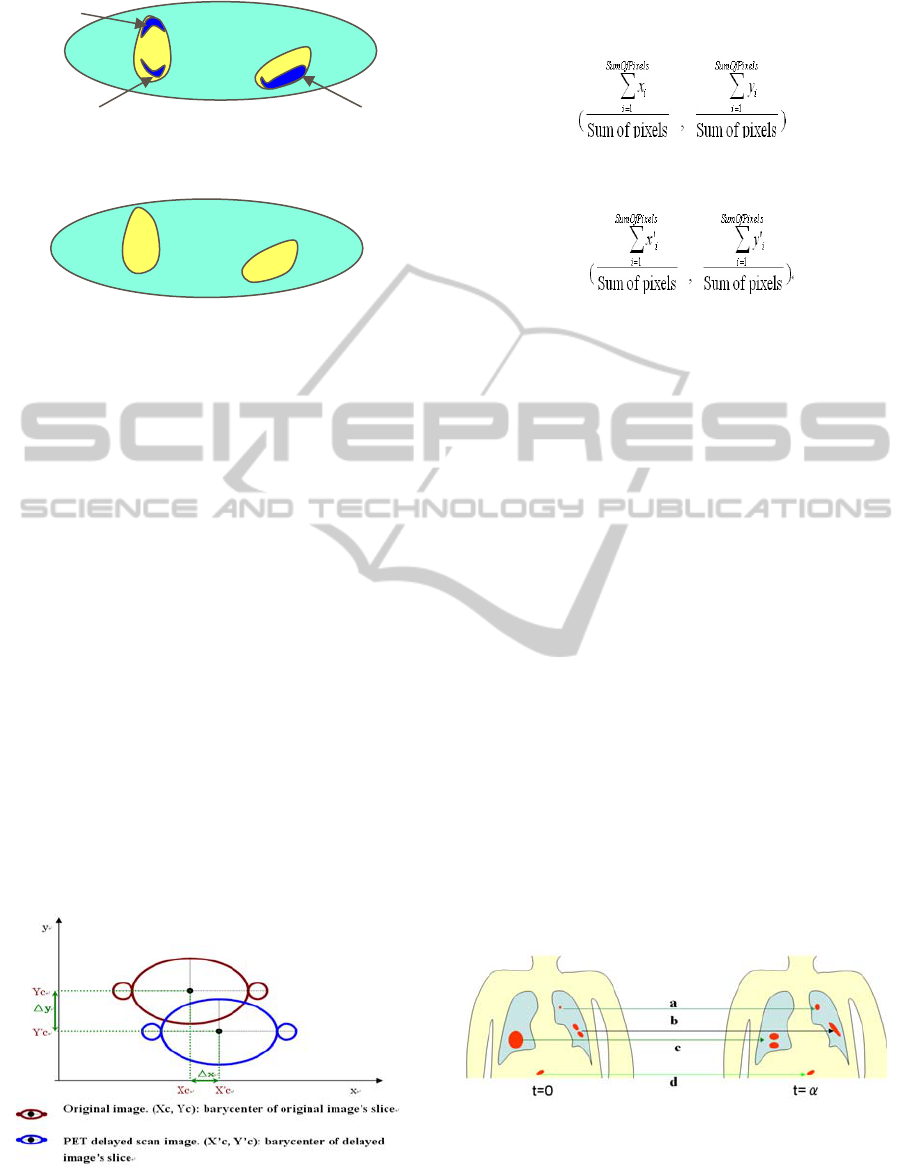
Figure 8: Applying the same operation on the No.2 and
No.3 areas.
Figure 9: Result of tumour candidates by the DTA method.
3.3 Position Adjustment of Images
Position adjustment between previous PET/CT
image and delayed scan PET/CT image is an
important step to ensure whether the areas have
cancer or not. There is a wait of about 30 minutes
between first PET/CT scan and the delayed scan, the
two images subject to many differences caused by
changes in a patient’s laying positions and persistent
absorption of FDG by organs during the 30 minute
interval. For example, the position of the body in
both images is changed; the areas of FDG
accumulation in both pictures are altered. Research
involving position adjustment of images includes
two aspects: (1) image adjustment, and (2)
accumulation area adjustment (HONG, Sato,
Arisawa, 2008).
(1)Image adjustment includes rescaling of size
and barycenter between two images and so on. We
rescale the size of delayed image by the method of
Linear Interpolation.
In normal condition, the patient’s barycenters of
original image and second image are different.
Figure 10: The difference between barycenters of two
images.
The computing formula of patient’s barycenter of
original image:
(Xc, Yc)
=
(1)
The computing formula of patient’s barycenter of
delayed image:
(X’c, Y’c)
=
(2)
The differentials between patient’s barycenters of
two images:
Δx = X’c – Xc
(3)
Δy = Y’c – Yc
(4)
So we can rescale the delayed image by the
formulas of relationship between the original
image’s point (x, y) and delayed image’s point(x’,
y’):
x’ = x + Δx
(5)
y’ = y + Δy
(6)
(2)
Accumulation area adjustment is to make
accumulation mapping for two images. There are
four possibilities for accumulations’ changes by
comparing the original image and delayed image: (a)
the SUV of delayed image becomes higher than the
SUV of original image(in figure, SUV = 6.7→7.9);
(b)
Two accumulations combine together; (c) One
accumulation separates to two parts; (d) The position
of accumulation in image is changed.
For the accumulation of (a), this part indicates
true positive and accumulation of (d), we could
conclude it is false positive result because the
cancer’s accumulation could not
transfer.
Accumulation (b) and (c), we should do further
analysis to make sure whether there is cancer or not.
Figure 11: The changes between original image’s
accumulations and delayed image’s accumulations.
2 3
1
HEALTHINF 2011 - International Conference on Health Informatics
402
3.4 Comparing the SUVs of Two
Images
During the interval of 30 minutes between first scan
and delayed scan, normal cells will release the FDG
so that SUV of normal region decreases; meanwhile
cancer cell continue to absorb the FDG in that 30
minutes so that its SUV increases. Therefore,
comparing the SUVs of the first scan image with the
ones of the delayed scan image is a research subject
for this new method. Generally speaking, lesions
such as in the lung area with decreased or stable
SUVs over time are likely to have a benign etiology.
In contrast, lesions with increased SUVs over time
are likely to be caused by malignancy (Matthies et al,
2006). At present there are no identified standards
for whole-body tumor detection by comparing SUVs
of two images, which is one of our research
objectives.
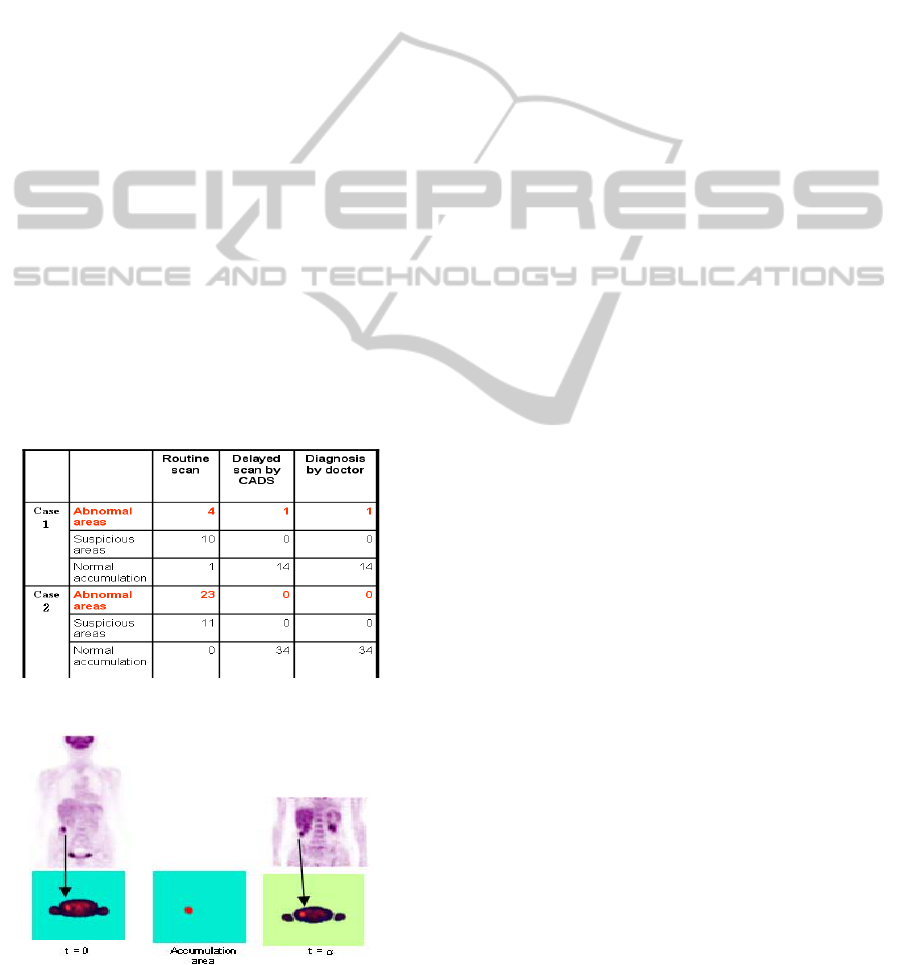
4 EXPERIMENTAL RESULT
Using the above procedure, we have already
implemented a preliminary experiment. The result
shows that a delayed scan with CADS reduces the
false positive results, which mean a more precise
diagnosis is achieved.
Figure 12: Experimental result by 3 different methods.
Figure 13: PET image of case 1.
5 ADVANTAGES
5.1 Accomplishment of More
Comprehensive Diagnosis
More comprehensive diagnosis could be achieved by
the whole-body PET /CT delayed scan. Now PET
delayed scan of specific parts of the body allows a
doctor to make omissions of cancerous area during
the diagnosis process. Unlike other diseases, cancer
is not necessarily only limited to one primary organ,
but also may involve local and distant metastases to
the lymphatic system and other organs (Knoepp and
Ravenel, 2006). So PET /CT delayed scan for the
whole body diagnosed is a potentially promising
method for the tumor detection.
5.2 Achieving More Accurate Diagnosis
The CADS makes the result of tumor detection more
reliable and precise. Mistakes maybe made by the
radiologist’s diagnoses because of doctor’s
negligence for the tiny accumulation of high SUV.
But in CADS, there are standard SUVs which are
determined by computer to distinguish tumor areas
and normal areas. The CADS has a higher sensitivity
for the SUVs so as to make more accurate diagnosis.
5.3 Decreasing the Burden of
Radiologist
Nowadays, a great number of diagnoses by doctors
are needed in tumor detection. Adding CADS
processing to doctors’ diagnoses by the whole-body
PET/CT delayed scans will simplify the diagnosis
for radiologists, especially for the doctors in the
countries where PET/CT imaging for tumor
detection is a regular health test for the patients.
6 CONCLUSIONS
The new method of PET/CT delayed scan for the
whole body has been briefly introduced. We hope
delayed scan in the future could apply to all the
patients, not only 10% patient, and achieve
whole-body PET/CT delayed scan instead of
part-body PET delayed scan. For the realization of
this new method, computer algorithms are extremely
important to make the diagnosis active and
automated. Whole-body PET/CT delayed scan
should be one of the trends in computer assisted
diagnosis system. In the future, our research will
COMPUTER ASSISTED CANCER DIAGNOSIS SYSTEM USING PET/CT DELAYED SCAN IMAGE
403

focus on position adjustment of images in many
situations such as patient’s arms putting down beside
body during the first scan in order to capture the
arms but holding them up over the head during the
second scan in order to reduce noises, which has a
big influence in PET/CT imaging for the breast area.
ACKNOWLEDGEMENTS
We express our appreciation to Dr. Ryogo
Minamimoto of National Center for Global Health
and Medicine, Professor Tomio Inoue of the
Yokohama City University Graduate School of
Medical Studies and Dr. Seishi Jinnouchi of Atsuchi
Neurosurgical Hospital PET Center.
REFERENCES
Jiang, H., Masutoh, N., Nishimura, O., Okumura, T.,
Yamamoto, S., Iisaku, S., Matsumoto, T., Tateno, Y.,
Iinuma T., Matsumoto, M., 2000. Computer-Aided
Diagnosis System of Lung Cancer Screening by
X-Ray CT, IEICE TRANS.(D-II)
,
J83-D-II (1),
333-341.
Toriwaki, J., 2000. Trends and Future Problems in
Computer Aided Diagnosis of X-ray Images, IEICE
TRANS.(D-II), J83-D-II (1), 3-26.
Tsai, D., Lee, Y., 2001. Fuzzy Reasoning Based
Computer-Aided Diagnosis for Automated
Discrimination of Myocardial Heart Disease from
Ultrasonic Images, IEICE TRANS.(A)
,
j84-A(12)
,
1431-1438.
Cheng, X., Akiyama, I., Wang, Y., Itoh, K., 1998. Breast
Tumor Diagnosis System Using Three Dimensional
Ultrasonic Echography,IEICE TRANS.(D-II)
,
J81-D-II
(1), 1402-1410.
Ukai, Y., Niki, N., Satoh, H., Watanabe, S., 2000.
Computer Assisted Diagnosis System for Coronary
Calcifications Based on Helical CT Images,IEICE
TRANS.(D-II)
,
J83-D-II (1), 342-350.
Matthies, A., Hickeson, M., Cuchiara, A., et al.2002,Dual
time point 18F-FDG PET for the evaluation of
pulmonary noudles. J. Nucl. Med., 43;871-875.
Zhuang, H., Pourdehnad, M., Lambright, E. S., et al.2001.
Dual time point 18F-FDG PET imaging for
differentiating malignant from inflammatory processes.
J. Nucl. Med., 42(9);1412-1417.
Takeo H., Shimura K., Imamura T., Shimizu A., Kobatake
H., 2005, Detection System of Clustered
Microcalcifications on CR Mammogram (Biological
Engineering), IEICE transactions on information and
systems, E88-D(11), 2591-2602
Hidefumi Kobatake, 2009.Trends in Research on CAD in
Japan, The Institute of Electronics,Information and
Communication Engineers—IECE Technical Report
217~218.
Lingfeng Wen, Wilson Leung, Stefan Eberl, Dagan Feng,
Jing Bai, 2008, A preliminary study on the
knowledge-based delineation of anatomical structures
for whole body PET-CT Studies, Proceedings of the
5th International Conference on Information
Technology and Application in Biomedicine
Hiroshi Arisawa, 2009 . Improvement of Automated
Cancer Detection System Using PET-CT Images,
RNSA pp.921
Hoang Thuy Hong, Takako Sato, Hiroshi Arisawa, 2008
Improvement of Cancer Detecting Ability in PET
Automated Diagnosis System by Using Delayed Scan
Images, Paper Volume of the 7th Information
Technology Forum of Information
ProcessingAacademy,pp.453-454, Sep.
U. W. Knoepp and J. G. Ravenel, "CT and PET imaging in
non-small cell lung cancer," Critical Reviews in
Oncology Hematology, vol. 58, pp. 15-30, 2006.
HEALTHINF 2011 - International Conference on Health Informatics
404
