
COLOUR CORRECTION FOR ASSESSING PLANT PATHOLOGY
USING LOW QUALITY CAMERAS
Sion Hannuna, Timo Kunkel, Nantheera Anantrasirichai and Nishan Canagarajah
Department of Computer Science, University of Bristol, Woodland Road, Bristol, BS8 1UB, U.K.
Keywords:
Plants, Pathology, Colour, Characterisation, MacBeth ColorChecker, Mobile phone, Camera.
Abstract:
We describe a framework for standardising the colour of plant images taken using both mobile phones and
compact cameras. This is with a view to maximising the accuracy of plant pathology diagnosis. Rather than
attempt to characterise each camera, we place cheap and easily portable custom colour targets in the scene
being captured. We propose a novel weighted least squares formulation for optimising the transformation
function deduced for each image, where the relative contribution for each patch is proportional to the number
of closely matching pixels in the image to be transformed. We also introduce our custom colour target which
has been designed to preferentially map plant colours and facilitate simple automatic extraction from the image
being processed. We provide subjective and objective results demonstrating the efficacy of our approach. It is
anticipated that the methods described here could be applied to any application where perceptual consistency
is of value.
1 INTRODUCTION
The appearance of images depends on various ele-
ments. On the acquisition side, it is influenced by the
interaction of the scene’s content, the lighting con-
ditions and the capture device. On the display side
it is affected by the screen set-up and its local envi-
ronment with both influencing how the human visual
system perceives the scene (Fairchild, 2005). For ex-
ample the same image will look different under arti-
ficial and natural lighting. Note that these perceptual
differences are not just a byproduct of the HVS: the
actual pixel values of the same object are highly de-
pendent on capture conditions. This makes the use of
colour and intensity information as features for auto-
matic analysis very problematic.
One way of addressing the issues originating on
the capture side is by using a fully characterised cam-
era under controlled lighting coupled with a monitor
calibrated to the ambient lighting of the user’s envi-
ronment (Fairchild, 2005). This is not always feasible
in applications where the capture conditions and ex-
act device properties are not known, for example in
rural areas where the use of specialised equipment is
difficult or not easily achievable.
This work forms part of a proposed agriculture
disease mitigation system which aims to provide a
mobile phone based ‘Farmer to Expert’ service, whi-
ch facilitates prompt access to disease and pest mit-
igation advice. In order to enable the expert to pro-
vide relevant information, they are provided with data
about the farmers’ crops. This would include soil type
and pH, crop variety and the pesticides and fertilizers
being used.
The text-based information available to the expert
will be augmented with mobile phone photos of the
crops, which have been captured and uploaded by the
farmer at the time of advice being sought. Unfortu-
nately, the photos taken will be sensitive to a number
of factors including camera type and lighting incident
on the scene. Ideally, the images would be processed
in such a way as to provide the expert with a visual
representation of the affected crops that reflects the
true nature of the scene.
In this paper we propose a cheap and easily imple-
mented approximation to such a solution that makes
use of automatically detected colour charts facili-
tating its integration into colour-managed imaging
pipelines. The motivation for maximising how real-
istic the plant images are is that a great deal of infor-
mation about the plants’ health may be gleaned from
their colours. Figure 1 shows two red maple leaves
afflicted with different mineral deficiencies. Different
capture conditions can greatly affect how those im-
ages appear. In addition to striving for perceptual con-
sistency, objective colour consistency increases the
326
Hannuna S., Kunkel T., Anantrasirichai N. and Canagarajah N..
COLOUR CORRECTION FOR ASSESSING PLANT PATHOLOGY USING LOW QUALITY CAMERAS.
DOI: 10.5220/0003291303260331
In Proceedings of the International Conference on Bioinformatics Models, Methods and Algorithms (BIOINFORMATICS-2011), pages 326-331
ISBN: 978-989-8425-36-2
Copyright
c
2011 SCITEPRESS (Science and Technology Publications, Lda.)

(a) (b)
Figure 1: Iron (a) and magnesium (b) deficiency in red
maple (Acer rubrum L.). Images by John Ruter, University
of Georgia, Bugwood.org.
potential for fully exploiting colour as a feature in au-
tomated systems.
2 STANDARDISING FOR
LIGHTING AND CAMERA
VARIATION
Recall that the aim of our system is to standardise im-
ages from low quality cameras such that they are both
consistent with one another and provide a faithful rep-
resentation of the scene they depict. To facilitate both
subjective and objective assessment of the efficacy of
the algorithms described here, the photos taken by a
Canon EOS 5D mkII DSLR camera are assumed to
reflect the truest representation of the scene and pro-
vide a ground truth / target for the output from the
other cameras used: in a ‘live’ setup colour chart val-
ues measured under standardised lighting would be
used to deduce the necessary transformation.
2.1 Colour Chart Specification
In order to obtain an independent measure of the
colour in an image, colour targets are placed in the
scene which is to be captured. A common target
widely used in colorimetry and photography is the X-
Rite (former Gretag-MacBeth) ColorChecker. In our
experiments we employ both this target and one of
our own devising that has been tailored to our needs.
Specifically, a white border has been added to facil-
itate automatic detection and ‘greenish’ colours have
been more numerously represented. It was anticipated
that by more heavily weighting areas of the gamut
where foliage colours generally reside, they may be
more accurately transformed.
As the longer term objective of this work involves
deployment in rural India, the replication cost of the
colour targets has to be low. This is achieved by using
a traditional chemical printing process creating costs
of less than 10 cents per target. To avoid specular
highlights in the colour target, it is printed on matte
Figure 2: Custom colour target designed to preferentially
map plant colours and enable automatic segmentation. Note
that the white numbered boxes in the figure are for illustra-
tion purposes only and not part of our implemented target.
photo-paper. A further design decision was to print
the target in credit-card size. This enables the farmer
to have the target at hand when needed.
The custom target shown in Figure 2 offers three
groups of colour patches. Group 1 is composed
of achromatic colours (from white to black in 20%
steps). Group 2 includes primary (RGB in 100% and
50% opacity) as well as secondary colours (CMY).
The last group, 3, contains green tones created in CIE
L
∗
a
∗
b
∗
colour space with L
∗
values of 25, 50 and 75
as well as a
∗
and b
∗
set to -65/65, -65/0 and 0/65. Note
that our custom chart, like the X-Rite ColorChecker
Passport, has only 24 patches. The colour charts gen-
erally used in device characterisation, usually contain
more patches (e.g. the ColorChecker DC has 192).
Whilst this increases the potential for generalisation,
the detection accuracy of the individual patches on a
credit-card sized target will decrease with an increas-
ing number of patches.
2.2 Colour Chart Extraction
Whilst the X-Rite colour target is hand segmented by
labeling its four corners, the custom colour chart is
automatically segmented by exploiting the white bor-
der surrounding the black background to the patches.
Specifically, the images are converted to greyscale
and the contrast is maximised. These are then thresh-
olded to produce binary images to which a Canny
edge detector is applied. By considering the intersec-
tion point of perpendicular edges in conjunction with
the processed greyscale image, it is possible to seg-
ment the chart’s border and hence the patches within.
Finally the difference between the values of the de-
tected colours and the expected colours is calculated.
The colour chart is correctly detected if the difference
value is within acceptable variation.
COLOUR CORRECTION FOR ASSESSING PLANT PATHOLOGY USING LOW QUALITY CAMERAS
327

2.3 Deducing a Transformation Matrix
The patch values for the source image to be processed
and the ground truth image taken by the DSLR are
used to deduce a transformation for the source im-
age. This process is analogous to the characterisation
of imaging devices including digital cameras. Vari-
ous characterisation methods exist (Luo and Rhodes,
2001; Tominaga, 1999). They essentially involve de-
ducing a mapping for targets that have known device
independent CIE XYZ values. Linear and polynomial
transformations have been used to this end as well as
neural networks. However, an important distinction
for our application should be noted: normally char-
acterisation is done once for a given device. Hence
it is important that the mapping used generalises for
all conceivable scenes and lighting conditions. Con-
versely, in our application, we only need the mapping
to work well for one particular image.
To exploit this stipulation we have experimented
with weighting the relative cost for the residual error
of particular patches under the deduced transforma-
tion according to how numerous image pixels closest
to that patch are in a given image. Hence, in most
of our images greens and browns would be favoured
as they primarily depict plants. For the quadratic and
linear transformations we utilise, this lends itself to a
weighted least squares optimisation. We term this our
‘heuristic’ approach, whereas normal least squares
will hereafter be referred to as ‘pure’.
The colour targets we tested only have 24 patches.
We found this was not enough correspondences for
training MLP neural networks and Support Vector
Machines as generalisation was poor. Conversely,
the quadratic and linear transformations considered
here produce perceptually convincing results. Cheung
and Westland describe a quadratic mapping function
(Cheung and Westland, 2002) formulation that may
be solved as a linear system (see Equation 1):
X = a
1
R + a
2
G + a
3
B
+ a
4
RG + a
5
RB + a
6
GB
+ a
7
R
2
+ a
8
G
2
+ a
9
B
2
+ a
10
Y = a
11
R + a
12
G + a
13
B
+ a
14
RG + a
15
RB + a
16
GB
+ a
17
R
2
+ a
18
G
2
+ a
19
B
2
+ a
20
Z = a
21
R + a
22
G + a
23
B
+ a
24
RG + a
25
RB + a
26
GB
+ a
27
R
2
+ a
28
G
2
+ a
29
B
2
+ a
30
(1)
We experimented with this formulation as well, as
a basic linear transformation shown in Equation 2 and
a simplified version of the polynomial described in
Equation 1. where the constant and interaction terms
for the tristimulus values were dropped as given in
Equation 3.
X = a
1
R + a
2
G + a
3
B
Y = a
4
R + a
4
G + a
6
B
Z = a
7
R + a
8
G + a
9
B
(2)
X = a
1
R + a
2
G + a
3
B
+ a
4
R
2
+ a
5
G
2
+ a
6
B
2
Y = a
7
R + a
8
G + a
9
B
+ a
10
R
2
+ a
11
G
2
+ a
12
B
2
Z = a
13
R + a
14
G + a
15
B
+ a
16
R
2
+ a
17
G
2
+ a
18
B
2
(3)
For each of the colour charts, the above formu-
lations were tested using both least squares optimi-
sation (‘pure’) and weighted least squares based on
the content of the image being processed (‘heuristic’).
Specifically for each pixel the Euclidian distance from
every patch was determined. Each patch’s weighting
was based upon the total number of pixels that were
closest to it in the camera’s device dependent RGB
colour space. This process is analogous to preselect-
ing colour patch values on the basis of the application
area. Cheung and Westland (Cheung and Westland,
2004) note that it would be sensible to select a char-
acterization set based on the colour of the object being
measured. Our approach is to augment this process by
skewing the optimisation such that colours depicted in
the image or more heavily favoured.
3 RESULTS AND EVALUATION
Two data sets are presented here. The first were taken
at our university botanical gardens in late spring. Fif-
teen different plants were photographed with 5 differ-
ent cameras including the DLSR which acts as our
ground truth. Generally 2-3 shots were taken with
each camera to ensure at least one of acceptable qual-
ity would be available. Objective results and sample
images are provided below. Analysis was performed
using the X-Rite ColorChecker. Results for the poly-
nomial function defined in Equation 1 were relatively
poor in comparison and thus are not presented here.
This may be as 24 samples were inadequate to train
a function of this complexity as others have reported
that 40 to 60 are a suitable number (Luo and Rhodes,
2001).
The second data set trials our custom colour
chart and compares it’s effectiveness against the Col-
orChecker chart in out application. Once again 5 cam-
eras were used including the DSLR. In these photos,
collections of leaves from different plants were used.
BIOINFORMATICS 2011 - International Conference on Bioinformatics Models, Methods and Algorithms
328
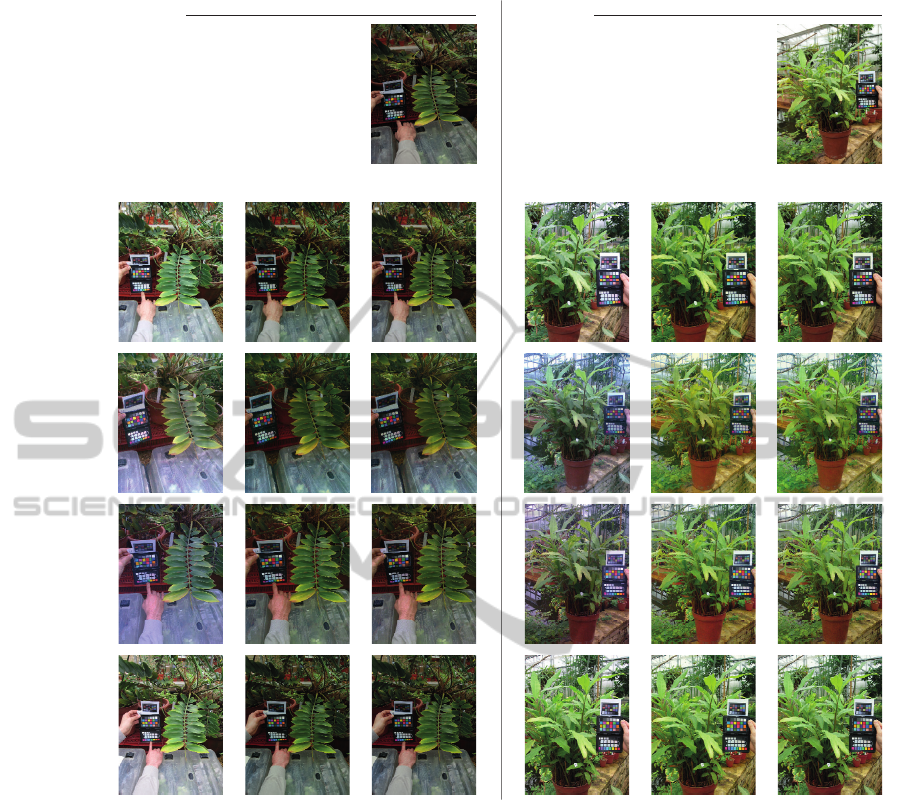
Fujifilm
Finepix F30
Canon
EOS 5DmkII
(Reference)
Scene 1 Scene 2
Apple
iPhone 3G
Nokia 6300
Canon
Ixus 100 IS
Source Pure Heuristic Source Pure Heuristic
Figure 3: Sample scenes visually demonstrating relative efficacy of our methodology.
Example results for our algorithms for both the
botanical gardens and the scene containing sample
leaves are provided in Figures 3 and 4 respectively.
In each figure source and destination images are con-
trasted against the simplified quadratic transformation
with and without the use of weighted least squares.
Note that the transformed images look more similar to
the target than the source image. The images in Fig-
ure 4 were processed using our custom chart, whereas
those in Figure 3 utilised the ColorChecker.
To obtain an objective measure of similarity we
follow Rubner et al.’s approach (Rubner et al., 1998)
to assessing the distance between the transformed im-
ages and the target. Note that as the images are taken
form different viewpoints it is not possible to perform
a pixel-wise comparison.
Rubner et al. (Rubner et al., 1998) demonstrate
that their Earth Mover’s Distance (EMD) metric used
in conjunction with images transformed into CIE-
LAB colour space effectively clusters perceptually
similar images and hence is employed here. Global
CIE-LAB colour histograms for the target, source,
and transformed images were generated using 10 bins
per channel. The EMD was calculated for the latter
three images with respect to the target image. Note
that as the target image is taken from a slightly dif-
ferent perspective to the others, one would not expect
even ‘perceptually perfect’ correspondences to yield
a zero EMD.
Figure 6 summarises the EMD results for out
transformations compared against the EMD for the
source image. In all cases the images are significantly
‘closer’ to the target after being transformed. For
the botanical gardens’ images the simplified quadratic
COLOUR CORRECTION FOR ASSESSING PLANT PATHOLOGY USING LOW QUALITY CAMERAS
329

formulation outperforms the linear transform for the
Fujifilm Finepix F30 and the Apple iPhone 3G,
whereas the linear transform is better for other two
cameras. However, both produce faithful results and
these numbers are in good agreement with our expe-
rience of eyeballing the images.
Encouragingly, the custom target performs, in
general, as well as the ColorChecker, indeed it works
better for the Nokia 6300 images in the limited test
we performed. Furthermore, our approach using
weighted least squares optimisation, generally per-
forms slightly better than using the standard least
squares approach.
Source HeuristicPure
Fujifilm
Finepix F30
Canon
EOS 5DmkII
(Reference)
Apple
iPhone 4
Nokia 6300HTC Hero /
Droid Eris
Sample Leaves
Figure 4: Scene visually demonstrating relative efficacy of
our methodology. The white rectangles in the source images
represent the sample patches used to compute the ∆E values
25 to 28 in Figure 5.
1 10 20 28
28 28
1 10 20 28
0
10
20
30
40
CIE ΔE
76
CIE ΔE
76
ColorChecker Patch
Fujifilm Finepix F30
ColorChecker Patch
Nokia 6300
1 10 20
0
10
20
30
40
ColorChecker Patch
HTC Hero
0 10 20
ColorChecker Patch
Apple iPhone 4
Samples from Scene
Samples from ColorChecker
Heuristic Approach
Pure Approach
Source Image
Figure 5: The colour difference for all four cameras.
The numbers on the abscissa represent the standard Col-
orChecker patches (left to right, top to bottom, starting with
black patch). Further, patch number 25 to 28 represent mea-
surements in the scene shown in Figure 4.
For the results depicted in Figure 4, the trans-
formation function was optimised using our custom
chart. This enables us to use the ColorChecker target
as a test set for calculating the colour differences for
its 24 patches. We also analysed four hand selected
image regions. In both cases, the CIE ∆E
76
colour
difference metric was used. The results are shown
in Figure 5. The colour difference is reduced signif-
icantly for all four cameras for both the ‘pure’ (stan-
dard least squares) and ‘heuristic’ (weighted least
squares) approach. CIE ∆E values between 3 and 6
are normally not perceived as different by naive ob-
servers. Note that some of the ColorChecker values
show a relatively high error (> 10). These are usually
colours which are perceptually distant to the ‘green-
ish’ values of interest (e.g. the deep red patch 10 and
the orange patch 18).
4 DISPLAY
After the colours of the input image have been
mapped using our colour target, the photograph can,
for example, be converted to the sRGB colour space.
In a fully colour-managed imaging pipeline e.g. us-
ing ICC-profiles and calibrated display devices, it is
now faithfully represented. Alternatively, the percep-
BIOINFORMATICS 2011 - International Conference on Bioinformatics Models, Methods and Algorithms
330

Source Image Standard Transf. Heuristic Transf.
Simple-Quadratic
EMD (X-Rite)
Simple-Quadratic
EMD (Chemical Print)
Simple-Quadratic
EMD (X-Rite)
Linear
EMD (Chemical Print)
Linear
EMD (X-Rite)
Linear
EMD (X-Rite)
0
200
400
600
Mean EMD from
Ground Truth Image
0
200
400
600
Mean EMD from
Ground Truth Image
0
200
400
600
Mean EMD from
Ground Truth Image
Nokia
iPhone
3G
F30
IXUS
Nokia
iPhone
3G
F30
IXUS
Nokia
iPhone 4
F30
Hero
Nokia
iPhone 4
F30
Hero
Sample Leaves
Botanical Gardens
Figure 6: Mean EMD for all image analysed.
tual accuracy of our approach can be further increased
by adjusting the photo of the plant to the current state
of human visual system. This can be achieved by ap-
plying a colour appearance model (CAM), which ex-
tends the above imaging pipeline by taking into ac-
count the display’s environment, before showing the
image (Fairchild, 2005).
5 CONCLUSIONS
An approach to standardising plant images for pathol-
ogy diagnosis has been detailed. The efficacy of our
custom colour chart and the use of a weighted least
squares formulation has been demonstrated. It is an-
ticipated that the method described here will be ap-
plicable to other applications utilising colour images,
that cannot be captured in repeatable way, for quality
control and assessment purposes. Future work will
more rigorously test our approach by applying it to
other classes of image. Furthermore, we plan to com-
bine the standardised colour information with other
image features to enable automatic classification and
diagnosis.
ACKNOWLEDGEMENTS
The authors would like to acknowledge the support of
the IU-ATC (http://www.iu-atc.com). We also thank
the Bristol University Botanical Gardens.
REFERENCES
Cheung, T. L. V. and Westland, S. (2002). Color camera
characterisation using artificial neural networks. Pro-
ceedings of the 10th Color Imaging Conference, pages
117–120.
Cheung, T. L. V. and Westland, S. (2004). Color selections
for characterization charts. Proceedings of the Second
European Conference on Colour in Graphics, Imag-
ing and Vision, pages 116–119.
Fairchild, M. D. (2005). Color Appearance Models. Wiley-
IS&T Series in Imaging Science and Technology, 2nd
edition.
Luo, M. and Rhodes, P. (2001). A study of digital cam-
era colorimetric characterisation based on polynomial
modelling. Color Research and Application, 26:76–
84.
Rubner, Y., Tomasi, C., and Guibas, L. J. (1998). A metric
for distributions with applications to image databases.
In ICCV, page 59, Washington, DC, USA.
Tominaga, S. (1999). Color coordinate conversion via neu-
ral networks. Colour Imaging: Vision and Technol-
ogy, ed. Lindsay W. MacDonald and M. Ronnier Luo,
pages 166–178.
COLOUR CORRECTION FOR ASSESSING PLANT PATHOLOGY USING LOW QUALITY CAMERAS
331
