
On the Development of an Automatic ECG Monitoring
System for Diabetic Patients
Nuno Gonc¸alves
1
and Luis Coelho
2
1
Rheinisch-Westf
¨
alische Technische Hochschule Aachen
Aachen, Germany
2
ESEIG, Instituto Polit
´
ecnico do Porto
Vila do Conde, Portugal
Abstract. Diabetes has become progressively common throughout the world due
to changes in the lifestyle and in the eating habits. Among other consequences,
this disease seriously affects the circulatory system, whose complications are the
leading cause of death in diabetics. In this paper we present a new device, de-
veloped specifically for diabetics, which allows estimating blood glucose levels
and, simultaneously, automatically detect potentially pathological electrocardio-
graphic patterns. We will present the entire processing sequence system and will
give special importance to the modules targeting the electrocardiogram (ECG)
and its analysis. A set of reference databases has been used as support for perfor-
mance evaluation. The system proved to be able to effectively detect changes in
the ECG morphology for occurrences of different nature and in various contexts.
The use of the ECG signal, whose acquisition is non-invasive, provides comfort
to the user and has the advantage of allowing a continuous patient monitoring.
1 Introduction
Diabetes is a chronic condition that occurs when the pancreas does not produce enough
insulin, defined as type 1, or when the body cannot effectively use the insulin it pro-
duces, defined as type 2. Most of the diabetics are affected by the latter. Diabetes preva-
lence has been growing epidemically for both men and women and in all age groups.
According to the World Health Organization, around 171M people in the world were
diagnosed with diabetes in 2000, and it is estimated that the number will double by
2030 [1]. Most of this increase will occur as a result of a 150% rise in developing coun-
tries like India, China and Indonesia (all in the top 10 countries with higher diabetes
cases) [2]. The metabolic disturbances associated with this pathology, if not diagnosed
and treated, can bring with time, among other complications, severe damages to the
circulatory systems. In fact, diabetes has become one of the major causes of premature
illness and death in most countries, mainly through the increased risk of cardiovascular
disease (CVD). Diabetes confers about a two-fold excess risk for a wide range of vascu-
lar diseases, independently from other conventional risk factors. Cardiovascular disease
is responsible for between 50% and 80% of deaths in people with diabetes [3]. This
article describes a new system, aimed for diabetic patients, that continuously monitors
Gonçalves N. and Coelho L..
On the Development of an Automatic ECG Monitoring System for Diabetic Patients.
DOI: 10.5220/0003301700130022
In Proceedings of the 1st International Living Usability Lab Workshop on AAL Latest Solutions, Trends and Applications (AAL-2011), pages 13-22
ISBN: 978-989-8425-39-3
Copyright
c
2011 SCITEPRESS (Science and Technology Publications, Lda.)

Single‐lead
ECG
DKF+PLA
ECGTe m plates
ECGAnalysis(v4)
Reducedversionwithglicemiaestimation
FeatureExtraction
&Analysis
Criticalvalues
ECGState
Information
Glycaemiaval.
(userinput)
GlycaemiaEst.
DynamicTime
Warping
Glyc.Estimation
(hypoglycaemia)
Glycaemiavs
QTcinterval
Optimal
Templa te
Selection
Fig. 1. ECG analysis pipeline.
cardiac function by ECG acquisition and analysis. It can provide, on one hand, esti-
mates of glycaemia, which increases patient’s quality of life by decreasing the amount
of daily finger pricks, and, on the other hand, can automatically discriminate between
a regular ECG morphology or an abnormal pattern requiring the attention of a medical
professional. This function is particularly important since several cardiopathic states
create confusion, dizziness, fainting or weakness which decreases the ability to react or
ask for help. The system is housed in a small autonomous device (around the size of
cellular phone), with processing and communication functions, and only requires the
connection of external electrodes.
In this paper we will describe the full system giving special detail to the signal pro-
cessing sub-systems. The next section starts by introducing the used databases during
the system’s development and then covers the ECG segmentation algorithm as well as
the ECG pattern classification sub-system. Additionally a brief description of a signal
correction algorithm is also included. Section 3 contains a wide evaluation of the system
whose results are then thoroughly discussed. Conclusions and future work are finally
presented in Section 4.
2 System Description
Our wearable acquisition system was based on a custom built instrumentation amplifier
that feeds a 10 bit ADC with a sampling rate of 250Hz. An ARM7 controller with a
BlueGiga bluetooth module provided a connection to a computer when necessary. The
functional system’s architecture is depicted in figure 1. The described algorithms can
run locally, at the wearable device, or on a remote PC.
2.1 Database
The development of the presented system relied on the QT database [4], widely used
in scientific literature and publicly available at the PhysioNet web archives. Besides
the data itself the database includes a set of manual and automatic annotations that are
useful for performance evaluation and comparison of results. This database contains a
statistically significant number of QRST complexes while encompassing a wide variety
of wave morphologies. To evaluate the robustness of the system we also used the MIT-
BIH Arrhythmia database [5], also available in the PhysioNet archives, which covers
14

distinct situations where arrhythmic episodes can be observed. The rich annotation pro-
vided with this database allows the discrimination of specific pathological occurrences
that were useful for restricted event-dependent performance evaluation.
2.2 ECG Automatic Segmentation
Segmentation is one of the key steps of any system that aims to evaluate ECG waves
characteristics. Several methods have been developed using a wide range of tools (e.g.
Dynamic Time Warping, Differentiated ECG) [6–8]. One of the most accepted meth-
ods, described by Laguna [6], is based on the differentiated ECG, and it’s often used
as a reference for performance comparisons between automatic segmentation systems.
Regarding automatic segmentation systems, the development of solutions based on the
Dynamic Time Warping (DTW) algorithm [9], originally developed for speech signals,
showed comparable results with the Laguna’s method. Vullings [7] presented a sys-
tem which combined Piecewise Linear Approximation (PLA) and DTW, in order to
reduce noise and enhance the DTW performance on the segmentation procedure. Nev-
ertheless, as described in [7], the application of PLA demands the assumption that the
fiducial points are near the points obtained after the linear approximation, which can
be associated to an increase of the segmentation error. For the automatic segmentation
task, we suggest a hybrid approach which uses the PLA technique combined with a
discrete Kalman Filter (DKF), so that the error from the linear approximation can be
reduced.
Kalman Filter. From a general point of view, the Kalman Filter is a tool designed for
the estimation of a n-dimensional variable, often called as the system’s state, based on
both a vector of noisy observations and an underlying model of the process. This esti-
mation can be represented in a state-space form that relies on the following equations:
x(k) = Ax(k − 1) + w(k − 1) (1)
z(k) = Cx(k) + v(k) (2)
where w and v represent the noises inherent to the process and to the observations,
respectively. The vector C establishes the relationship between the observations z(k)
and the states x(k), while the matrix A traduces the system behaviour and is built based
on an autoregressive (AR) model according to the following conformation:
A =
a(1) a(2) a(3) ··· a(p − 1) a(p)
1 0 0 ··· 0 0
.
.
.
.
.
.
.
.
. 0
.
.
.
.
.
.
0 0 0 ··· 1 0
(3)
in which a(i), i = 1, 2, . . . , p are the AR coefficients used to recover the signal as:
x(k) =
p
X
i=1
a(i)x(k − i) + w(k) (4)
15

From equations (1) and (2), the estimated samples are:
ˆ
x
k
=
ˆ
x
k−1
+ G
k
(z
k
− CA
ˆ
x
k−1
) (5)
where a new parameter G
k
is defined. This recursively calculated parameter, called the
Kalman gain, is obtained from previously defined covariances from both the observa-
tions and the states.
Piecewise Linear Approximation and the Kalman Filter. Koski’s Piecewise Linear
Approximation, presented in [10], aims to approximate a discrete signal with a set of
linear branches, considering a maximum approximation window size and a maximum
approximation error. This algorithm searches for the highest value of the approximation
window size for which the approximation error does not overcome a specified threshold.
As presented earlier in this paper, the application of PLA to ECG usefully removes its’
noise, but also introduces an uncertainty regarding the change in the location of the
fiducial points [7]. In order to obtain a de-noised ECG signal without considerable
changes on the location of the fiducial points, we applied the Kalman Filter structure
explained above, where the ECG signal is the set of observations and the output from
the PLA is considered as the underlying model of the system. The Kalman Filter is
able to estimate the new samples gathering the data from the observations and from
the PLA model, relying on these inputs according to their covariances matrices. Thus,
the Kalman Filter will produce the new estimates relying on the ECG and its’ linear
approximation with different and controllable extensions.
Dynamic Time Warping. After the application of the Kalman Filter combined with
the PLA, a template matching step is performed, in order to determine which of the
previously stored beat templates is morphologically more similar to the beats in the
ECG signal. For this purpose a cross-correlation between the templates and the signal
was implemented. The template that best suits the morphology of the ECG signal is
then used for the segmentation task, applying the DTW algorithm. This algorithm aims
to align a template and a test signal in the most efficient way. The efficiency of the
alignment can be traduced by a distance, so that the highest efficiency corresponds to the
minimization of that distance. This algorithm aligns both the template and the signal by
compressing or stretching the temporal axis, thus being an attractive solution to identify
patterns where the duration often varies. Considering the signals S = s
1
, s
2
, . . . , s
n
and T = t
1
, t
2
, . . . , t
m
, as the ECG signal with length n and template with length m,
respectively, an n × m matrix was built, where each of its’ elements is a measure of
the alignment between the respective samples. The warping path that minimizes the
total sum of the distances between the samples of the two series, the optimal path, in
equation 6, provides the best time alignment for the signals.
ˆ
Φ = arg min
φ
k
,ψ
k
K
X
k=1
δ(s
φ
k
, t
ψ
k
).m
k,Φ
M
Φ
(6)
In equation (6),
m
k,Φ
M
Φ
represents the specific weight from the element k, along one
path Φ. Nevertheless, these two parameters are often absent and thus, every element
16

k have the same weight. Our DTW implementation considered as distance between
samples δ(s
φ
k
, t
ψ
k
) the quadratic error:
δ(s
φ
k
, t
ψ
k
) = (s
φ
k
− t
ψ
k
)
2
(7)
This formulation provided the basis that allowed to identify ECG components and
their related interest points.
2.3 Glycaemia Estimation
It is known that blood glucose variations can have consequences in the morphology
of the ECG wave. In hypoglycaemic states the effects are more direct and conditions
such as fluctuation in cardiac frequency and in the ST interval, enlarged QT segment,
fusion of T and U waves or decrease in T peak value can be observed [11]. Furthermore,
several authors report the existence of a direct correlation between the duration of the
QT segment and the blood glucose levels [12, 13]. This knowledges allows the system
to provide glucose level estimates using a linear model whose parameters are obtained
from the segmentation module and from manually measured glucose levels supplied
by the user. The estimates should be calculated only when in bradycardiac rhythms are
detected.
2.4 ECG Analysis and Classification
The purpose of the presented ECG analysis is to generate warnings, for the patient
and/or for a medical professional, resulting from the automatic detection of an abnormal
cardiac function. For class detection we used an SVM classifier. To build a prototype
feature vector for feeding the classifier we considered a broad range of wave charac-
teristics that cover intra and inter period informations as well as some of their related
statistics. For each ECG period we used the duration of 10 segments plus the corrected
QT duration (QTc) calculated according to the Bazett’s formula:
QT c =
QT
√
RR
(8)
where RR represents the interval from the onset of one QRS complex to the onset of the
next QRS complex. The non-flat segments P1, P2, T1, T2, R1 and R2 were modelled
using linear approximations (slope and origin intersection values) and the peak values
for P, Q, R, S and T were also included. By observing the last 10 ECG periods we extract
several inter-frame relations. We calculated 4 first-order statistics, namely the average,
standard deviation, skewness and kurtosis for all the describes parameters. Additionally,
for the peak values P, Q, R, S and T, we extracted a five-point amplitude perturbation
quotient (S
5
) as the average absolute difference between the amplitude A of a period
i and the average of the amplitudes of it and its four closest neighbours (two on each
side, K = 2), divided by the average amplitude:
S
5
=
1
N
P
N
i=1
A
i
−
1
2K+1
P
K
k=−K
A
i+k
1
N
P
N
i=1
A
i
(9)
17

A similar metric was also calculated for the time instants of the mentioned peaks. This
thus yields a final feature vector, with 150 dimensions, composed by all the described
characteristics. Since the classifier system was developed to work on a mobile device
with low-resource hardware we had to optimize the feature vector in order to reduce
calculation complexity. In a first step, considering that the values on each dimension
followed a Gaussian distribution, we normalized the feature components by calculating
their Z-values. This procedure centred the points in the origin and equalized the range
of values. We then defined as outliers all the points who exceed in value two standard
deviations, in any vector dimension, and removed them. A variation of the Kolmogorov-
Smirnov test was used to verify the initial assumption that the values on each dimension
followed a normal distribution. To prune dimensions of the feature space we analysed
the discriminative power provided by each feature using a t-test with 90% confidence
interval. The test allowed to understand if the mean values of the feature for the two
classes were different and if the information provided by a given feature could allow
to distinguish between classes. The features that have not passed these tests where dis-
carded. The discriminatory power of the remaining features was individually quantified,
for two equiprobable classes, using the Fisher’s discriminatory ratio (FDR). With this
metric we sorted the features in descending order and built a new feature list using the
following procedure:
1. The best ranked feature f
1
is the top-ranked in the FDR’s ranked list. The next
feature f
2
is obtained by
f
2
= max
j
w
1
F DR
j
− w
2
ρ
2
f
1
,j
, j 6= f
1
(10)
where F DR
j
is the feature’s FDR value, ρ
f
1
,j
represents the cross-correlation be-
tween the feature in analysis and the remaining features and w
1
and w
2
are used
defined weights that allow to adjust the contribution of each criteria to the overall
feature ranking (in our case we used w
1
= 0.3 and w
2
= 0.7).
2. The next feature is selected using an analogous formulation but now considering
the average correlations with all the previously selected features:
f
k
= max
j
(
w
1
F DR
j
−
a
2
k − 1
k−1
X
r=1
ρ
2
f
r
,j
)
, j 6= f
r
, r = 1, 2, . . . , k − 1 (11)
with k = 3, 4, . . . , m.
From this multi-criteria ranked feature list we have selected the 20 highest ranked
features and performed an exhaustive search for combinations of 10 features using a
scatter matrices [14] based approach. As cost function for class separability measure-
ment we used the J
3
criteria defined as:
J
3
= trace
S
−1
w
S
b
(12)
where S
w
is the intraclass scatter matrix, defined as:
S
w
=
C
X
c=1
P
i
S
i
(13)
18

where P
i
is the probability of each class c and S
i
is the related covariance matrix. Still
in equation 12, S
b
represents the interclass scatter matrix,
S
b
=
c
X
i=1
P
i
(µ
i
− µ
0
)(µ
i
− µ
0
)
T
(14)
where µ
i
is the class mean vector and µ
0
is the mean vector considering all classes.
Using an exhaustive search we combined sets of 10 features from the 20, previously se-
lected, and retained the one that maximized the J
3
criterion. The features that composed
our final vector optimized for normal and non-normal cardiac function discrimination
were µT1, RpeakS
5
, BL3 kurtosis, BL3, R2 skewness, µT2, BPM, R1slope, BPM stan-
dard deviation and T1origin.
3 Evaluation and Results
As previously stated, the ECG records, used for template extraction and testing, were
extracted from the QT database. As the scope of this article refers to the development
of an automatic single-lead ECG system, only records acquired through the same lead
have been considered. Sixteen manually annotated templates were extracted from the
database and processed according to the suggested method, in order to build a tem-
plate library. A total of 387 beats were automatically segmented and the point specific
results are shown in table 1. The table follows the conformation adopted in [7] in or-
der to provide a more comprehensive comparison. Furthermore, we present the interval
duration results regarding the corrected QT interval, as the duration of this interval is
specially important. The segmentation is applied in the processed ECG but the final re-
sults must report to the raw ECG signal. Figures 2 and 3 show the relationship between
the processed and the raw ECG beat and the associated segmentation. We can observe
that the proposed hybrid PLA plus Kalman methodology can efficiently enhance the
characteristic ECG waves while simultaneously smoothing signal fluctuations.
Table 1. Error (mean and standard deviation), in milliseconds, produced by the automatic seg-
mentation system, for the specific fiducial points and intervals.
P
on
P P
end
Q R S
µ 21.98 13.06 8.54 13.16 12.34 11.81
σ 21.06 4.12 5.98 11.61 3.20 3.01
T
on
T T
end
QT RR QT
c
µ 14.45 11.42 11.25 10.44 1.76 11.18
σ 20.25 21.53 7.71 10.90 2.07 12.07
The results presented in table 1 show that the suggested segmentation method ap-
pears to be suitable for application to an automatic segmentation system. Comparing to
the results collected in [7], the mean error produced by our method is comparable but
slightly higher than the mean error obtained by both Vulling’s and Laguna’s methods.
Nevertheless, in our approach, the standard deviation results are clearly lower than the
19
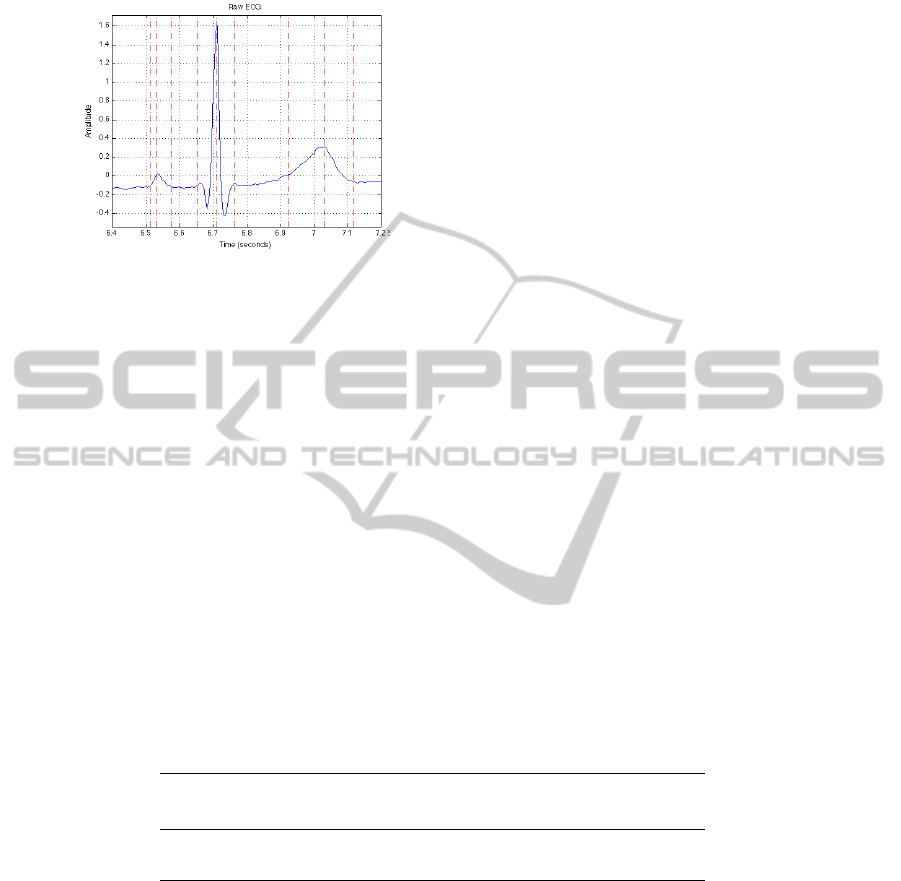
Table 1. Error (mean and standard deviation), in milliseconds, produced by the automatic seg-
mentation system, for the specific fiducial points and intervals.
P
on
P P
end
Q R S
µ 21.98 13.06 8.54 13.16 12.34 11.81
σ 21.06 4.12 5.98 11.61 3.20 3.01
T
on
T T
end
QT RR QT
c
µ 14.45 11.42 11.25 10.44 1.76 11.18
σ 20.25 21.53 7.71 10.90 2.07 12.07
Fig. 2. Segmentation results for one beat on the
raw signal.
Fig. 3. Segmentation results for one beat on the
processed signal.
that our method is promising concerning the improvement of the precision of such au-
tomatic segmentation systems. We must highlight that the proposed algorithm relies on
the analysis of a single signal which greatly reduces the refinement possibilities when
additional signals are considered. Furthermore, regarding the duration of the QT, RR
and corrected QT intervals, the obtained results show good possibilities of application
in an automatic segmentation system. In any case the system’s segmentation accuracy
showed enough reliability to robustly feed the following classification module.
To evaluate the automatic warning generator, based on the described classifier sys-
tem, we trained the system by randomly selecting 80% of dataset records and keeping
the remaining 20% for evaluation purposes. This procedure was repeated 100 times in
order to obtain confidence intervals for the evaluation results. Table 2 shows the classi-
fication confusion matrix as well as the related confidence intervals.
The proposed framework provided promising results despite the very high diversity
of ECG morphologies. The number of correctly predicted situations is high even when
the signal is polluted with Gaussian additive noise (SNR=14dB). In scientific literature
there are very few works that address the described problem with the proposed objec-
tives. Most works are directed to medical instrumentation systems that only grasp a
single pathology whereas few cover broad spectrum classification tasks based on sim-
ple, low resource, wearable devices.
Fig. 2. Segmentation results for one beat on
the raw signal.
Table 1. Error (mean and standard deviation), in milliseconds, produced by the automatic seg-
mentation system, for the specific fiducial points and intervals.
P
on
P P
end
Q R S
µ 21.98 13.06 8.54 13.16 12.34 11.81
σ 21.06 4.12 5.98 11.61 3.20 3.01
T
on
T T
end
QT RR QT
c
µ 14.45 11.42 11.25 10.44 1.76 11.18
σ 20.25 21.53 7.71 10.90 2.07 12.07
Fig. 2. Segmentation results for one beat on the
raw signal.
Fig. 3. Segmentation results for one beat on the
processed signal.
that our method is promising concerning the improvement of the precision of such au-
tomatic segmentation systems. We must highlight that the proposed algorithm relies on
the analysis of a single signal which greatly reduces the refinement possibilities when
additional signals are considered. Furthermore, regarding the duration of the QT, RR
and corrected QT intervals, the obtained results show good possibilities of application
in an automatic segmentation system. In any case the system’s segmentation accuracy
showed enough reliability to robustly feed the following classification module.
To evaluate the automatic warning generator, based on the described classifier sys-
tem, we trained the system by randomly selecting 80% of dataset records and keeping
the remaining 20% for evaluation purposes. This procedure was repeated 100 times in
order to obtain confidence intervals for the evaluation results. Table 2 shows the classi-
fication confusion matrix as well as the related confidence intervals.
The proposed framework provided promising results despite the very high diversity
of ECG morphologies. The number of correctly predicted situations is high even when
the signal is polluted with Gaussian additive noise (SNR=14dB). In scientific literature
there are very few works that address the described problem with the proposed objec-
tives. Most works are directed to medical instrumentation systems that only grasp a
single pathology whereas few cover broad spectrum classification tasks based on sim-
ple, low resource, wearable devices.
Fig. 3. Segmentation results for one beat on
the processed signal.
results of the other two methods, unless for the onset of the P wave. This fact suggests
that our method is promising concerning the improvement of the precision of such au-
tomatic segmentation systems. We must highlight that the proposed algorithm relies on
the analysis of a single signal which greatly reduces the refinement possibilities when
additional signals are considered. Furthermore, regarding the duration of the QT, RR
and corrected QT intervals, the obtained results show good possibilities of application
in an automatic segmentation system. In any case the system’s segmentation accuracy
showed enough reliability to robustly feed the following classification module.
To evaluate the automatic warning generator, based on the described classifier sys-
tem, we trained the system by randomly selecting 80% of dataset records and keeping
the remaining 20% for evaluation purposes. This procedure was repeated 100 times in
order to obtain confidence intervals for the evaluation results. Table 2 shows the classi-
fication confusion matrix as well as the related confidence intervals.
Table 2. Confusion matrix for cardiac function classifier. (Values are in percentage and the num-
ber of actual occurrences in the database was used as reference for the calculation. The two
columns on the right represent the actual situations as found on the reference dataset.)
QTdb QTdb noise corrupted
Predicted Normal Not-Normal Normal Not-Normal
Normal 77.3 ± 8.3% 20.6 ± 6.2% 75.2 ± 8.8% 23.9 ± 8.1%
Not-Normal 22.7 ± 8.3% 79.4 ± 6.2% 24.8 ± 8.8% 76.1 ± 8.1%
The proposed framework provided promising results despite the very high diversity
of ECG morphologies. The number of correctly predicted situations is high even when
the signal is polluted with Gaussian additive noise (SNR=14dB). In scientific literature
there are very few works that address the described problem with the proposed objec-
tives. Most works are directed to medical instrumentation systems that only grasp a
single pathology whereas few cover broad spectrum classification tasks based on sim-
ple, low resource, wearable devices.
The number of false negatives and false positives is an issue for real users because
20

in can reduce the confidence in the system’s judgement. However the system was evalu-
ated in conditions that are distant from a real daily usage in a single patient. In most real
cases the number of cardiopathic patterns that can be observed in a single patient is very
limited which highly reduces the discriminatory difficulty. In these restricted domains
the system is able to perform much better. In table 3 we present the obtained results
when considering a specific cardiac dysfunction. (For evaluation we used a bootstrap-
ing technique due to the reduce number of records.) We can observe that the number of
correctly identified situations is much higher as is the number of false predictions.
Table 3. Confusion matrix for cardiac dysfunction detection when the development domain was
reduced to a single pathological context. (Values are in percentage and the number of actual
occurrences in the database was used as reference for the calculation. The two columns on the
right represent the actual situations as found on the reference dataset.)
Context Predicted Normal Not-Normal
Atrial Premature Contraction Normal 80.3 ± 10.3% 19.2 ± 3.2%
Not-Normal 19.7 ± 10.3% 80.8 ± 3.2%
Premature Ventricular Contraction Normal 91.5 ± 3.7% 9.2 ± 4.6%
Not-Normal 8.5 ± 3.7% 90.8 ± 4.6%
Bundle-Branck Block Normal 85.9 ± 6.4% 16.5 ± 5.1%
Not-Normal 14.1 ± 6.4% 83.5 ± 5.1%
Ventricular tachycardia Normal 88.7 ± 5.2% 18.1 ± 8.2%
Not-Normal 11.3 ± 5.2% 81.9 ± 8.2%
Sinus bradicardia Normal 93.6 ± 4.9% 7.7 ± 4.0%
Not-Normal 6.4 ± 4.9% 92.3 ± 4.0%
4 Conclusions and Future Work
Arrhythmias or abnormal heart rhythms are common cardiac disorders and may cause
serious health risks. These disorders are characterized by the change in rate or rhythm
of the heartbeat and their prevalence is highly increased by diabetes. In this paper we
present a new device, developed specifically for diabetics, which allows estimating
blood glucose levels and, simultaneously, automatically detect potentially pathological
electrocardiographic patterns. We have presented the functional system’s architecture
and provided a thoroughly explanation of the main modules. The system’s performance
was evaluated with widely used methodologies and the obtained results were compared
with those reported by other authors. Both segmentation and classification modules
showed comparable results with better marks in some points. The proposed device uses
the information from a single ECG lead which increases the analysis difficulty but repre-
sents a low discomfort for the user. The daily usage of the proposed device can increase
the user’s quality of life and reduce the risk of cardiac related emergencies.
The system is still under development and some further improvements are already
envisioned. For example, to reduce the number of false alarms we are introducing the
possibility of adapting the classification system using a medically supervised error cor-
rection procedure.
21

References
1. Gan, D.: Diabetes Atlas. International Diabetes Federation, Brussels (2003)
2. Wild, S., Roglic, G., Green, A., Sicree, R., King, H.: Global prevalence of diabetes: estimates
for the year 2000 and projections for 2030. Diabetes Care 27 (2004) 1047–1053
3. The Emerging Risk Factors Collaboration: Diabetes mellitus, fasting blood glucose concen-
tration, and risk of vascular disease: a collaborative meta-analysis of 102 prospective studies.
The Lancet 375 (2010) 2215 – 2222
4. Laguna, P., Mark, R. G., Goldberger, A., Moody, G. B.: A database for evaluation of al-
gorithms for measurement of qt and other waveform intervals in the ecg. Computers in
Cardiology 24 (1997) 673–676
5. Moody, G., Mark, R.: The mit-bih arrhythmia database on cd-rom and software for use with
it. In: Proc. of Computers in Cardiology, Chicago, USA (1990) 185–188
6. Laguna, P., Jan
´
e, R., Caminal, P.: Automatic detection of wave boundaries in multilead
ECG signals: validation with the CSE database. Computers and biomedical research, an
international journal 27 (1994) 45–60
7. Vullings, H., Verhaegen, M., Verbruggen, H.: Automated ECG segmentation with dynamic
time warping. Proceedings of the 20th Annual International Conference of the IEEE Engi-
neering in Medicine and Biology Society. Vol.20 Biomedical Engineering Towards the Year
2000 and Beyond (Cat. No.98CH36286) 20 (1998) 163–166
8. Zifan, A., Saberi, S., Moradi, M. H., Towhidkhah, F.: Automated ECG Segmentation Using
Piecewise Derivative Dynamic Time Warping. Life Sciences (2005) 181–185
9. Sakoe, H., Chiba, S.: Dynamic programming algorithm optimization for spoken word recog-
nition. IEEE Trans. on Acoustics, Speech and Signal Processing 26 (1978) 43–49
10. Koski, A.: Segmentation of digital signals based on estimated compression ratio. IEEE trans.
on Biomedical Eng. 43 (1996)
11. Garcia, E. V., Marques, J. L. B., Pesquisas, G. D., El
´
etrica, D. D. E., Tecnol
´
ogico, C.: Es-
tudo para a detecc¸
˜
ao n
˜
ao-invasiva de hipoglicemia baseada na an
´
alise do electrocardiograma.
Sleep (Rochester) 5 (2001)
12. Lindstrom, T., Jorfeldt, L., Tegler, L.: Hypoglycaemia and cardiac arrythmias in patients
with type 2 diabetes mellitus. Diabetic Medicine 9 (1992) 536–541
13. Markel, A., Keidar, S., Yasin, K.: Hypoglycaemia induced ischaemic ecg changes. La presse
Medical 9 (1994) 78–79
14. Fukunaga, K.: Introduction to Statistical Pattern Recognition. Academic Press (1990)
22
