
A VISUALIZATION BASED SIMULATOR
FOR SYN FLOOD ATTACKS
Tom Terry Jr., Huiming Yu, Ken Williams, Xiaohong Yuan
Department of Computer Science, North Carolina A&T State University, Greensboro, NC, U.S.A.
Bill Chu
Department of Software and Information Systems, University of North Carolina at Charlotte, Charlotte, NC, U.S.A.
Keywords: SYN flood, Visualization based, Network security, Education tool.
Abstract: In this paper we present a visualization based simulator to help students gain knowledge of SYN flood
attacks. The design principles of the simulator are user friendly, visualization based, and easy to install and
use. The animation simulator demonstrates normal network traffic, exhibits how a SYN flood attack occurs,
and shows how using a firewall might prevent SYN flood attacks. A set of short quizzes has been designed
to help students to understand the concepts. The visualization based simulator for SYN flood attacks has
been designed and implemented in the Department of Computer Science at North Carolina A&T State
University to enhance information assurance education. This simulator was used in COMP 620 Information,
Privacy and Security in the fall 2010 and received excellent results.
1 INTRODUCTION
In today’s society e-commerce and information
availability play a very important role in our lives.
People want around the clock access to information
and their favorite websites. If a company’s website
were to go down for one minute, it could result in
millions of dollars being lost. As technology
advances and availability increase, the internet
becomes more and more prone to different types of
attacks.
Denial of Service (DoS) is a serious attack that
can be categorized as two types; stopping a service
and resource exhaustion (IBM, Gao and Ansari,
2005). Stopping a service is the crashing of a system
or network. In most cases it requires intervention
from an administrator to reboot or power off the
system for the system to get back online. The second
type involves flooding the system or network with so
much information that the system cannot respond.
One of the more severe types of attacks would be a
SYN flood, which is simply a type of Denial of
Service (CERT
®
Advisory, 1996). SYN flood attacks
are used for a variety of reasons. A person could be
holding a grudge against a company and decide to try
to simply shut down its website. A hacker could be
trying to find a back door while administering a SYN
flood attack on a company’s website. Or even a
company’s competition could be trying to sabotage
them. One thing is for sure, the effects could be
costly.
We have taught various network attacks in
undergraduate and graduate classes for years.
According to students’ feedback some of them have
difficulty to fully understand how SYN flood works
based simply on textual presentation in classroom.
For these students a visualization based education
tool can help them to understand how packets are
transmitted among computers through a network,
how a SYN flood attack occurs and how SYN flood
attacks could be prevented. A Visualization Based
Simulator for SYN Flood Attacks (VSSFA) has been
designed and implemented in the Department of
Computer Science at North Carolina A&T State
University (NC A&T SU) to help students better
understand normal network traffic, SYN flood attacks
and prevention techniques. This simulator can be
used in network security, computer security and Web
security courses by instructors in classroom or by
students outside classroom.
In this paper, we discuss designs and
251
Terry Jr. T., Yu H., Williams K., Yuan X. and Chu B..
A VISUALIZATION BASED SIMULATOR FOR SYN FLOOD ATTACKS.
DOI: 10.5220/0003309502510255
In Proceedings of the International Conference on Imaging Theory and Applications and International Conference on Information Visualization Theory
and Applications (IVAPP-2011), pages 251-255
ISBN: 978-989-8425-46-1
Copyright
c
2011 SCITEPRESS (Science and Technology Publications, Lda.)

implementation of the Visualization Based Simulator
for SYN Flood Attacks, and present our teaching
experience and lessons learned. In section 2 the
objectives will be discussed. How SYN flood works
will be described in section 3. The details of the
designs and implementation of the simulator will be
presented in section 4. In section 5 functions of the
simulator will be exhibited. In section 6 assessment
results will be given. The conclusions will be
presented in section 7.
2 OBJECTIVES
Network attacks are import topics of Information
Assurance and computer security. In order to help
students to effectively understand SYN flood attacks
and learn prevention techniques, a Visualization
Based Simulator for SYN Flood Attacks has been
developed. The objectives of this tool are to provide
students a visualization based simulator, a step by
step demonstration of SYN flood attacks and a better
understanding of SYN flood attack impact and
prevention. The VSSFA can be used in computer
security, network security, Web security, wireless
security courses by instructors in the classroom or by
students outside the classroom.
3 UNDERSTANDING SYN
FLOOD ATTACKS
A SYN flood attack is one type of Denial of Service.
The process of requesting a webpage is initiated by a
three-way handshake to establish a TCP connection.
First the client sends a request packet to establish a
connection to the server. Inside the connection
request packet the TCP SYN flag is set. Once the
server receives the initial request packet, it responds
to the source IP address of the packet it received by
sending back to the client a SYN-ACK request
packet. This packet has both the SYN and ACK TCP
flags set. Once the client receives the SYN-ACK
request packet, it will respond to the server by
sending back a packet with the ACK flag set. This
response is sometimes called a SYN-ACK-ACK
packet to distinguish it from a normal data
acknowledgement. When the server receives the
SYN-ACK-ACK packet a connection is established.
During a SYN flood attack the three-way handshake
is not completed. An attacker sends many SYN
packets as if opening many connections. These
connection request packets contain the SYN flag as
well as a spoofed source IP address. The server will
receive these packets and respond to the spoofed IP
addresses by sending SYN-ACK request packets. At
the same time the server stores each SYN packet
request in its TCP backlog queue. Each packet will
have a lifetime, possibly as long as three minutes.
The server will then wait for a SYN-ACK-ACK
packet, which it will never receive. Soon the TCP
backlog queue will become full creating a temporary
Denial of Service. All further incoming connection
request will be ignored. As soon as one packet’s
lifetime expires another new connection request can
be received.
4 DESIGNS
AND IMPLEMENTATION
The principle of the design of the visualization based
simulator is to be user friendly, visualization based,
and easy to install and use. Different colors are used
to mark various stages of network traffic (Scott). A
set of short quizzes were designed to help users
understand basic concepts. This simulator
demonstrates the process of normal network traffic,
how a SYN flood attack occurs and how a firewall
can partially prevent SYN flood attacks. This
visualization based simulator contains three
demonstrations. The first one is normal network
traffic, which displays how the TCP three way
handshake works. The second one is a SYN flood
attack, which displays what happens during SYN
flood attacks. Prevention method is the last
demonstration, which displays a firewall as a possible
prevention method to a SYN flood attack. This
simulator can be viewed from a web site as an applet,
using Macromedia Flash Player, which is available to
download for free from the internet. For the best
results, Internet explorer 7 or higher is recommended.
This simulator can be installed on a personal
computer and executed in standalone mode. Several
main considerations are described in the following
sections.
• Visualization based
Visualization has been used for years in computer
science to help students understand algorithms and
data structures. In this simulator visualization
techniques are used to let students view dynamic
normal network traffic, how a SYN flood attack
occurs, and how a firewall possibly prevents SYN
flood attacks. This simulator allows students to select
difference traffic views, to take corresponding
quizzes and to view the results.
IVAPP 2011 - International Conference on Information Visualization Theory and Applications
252

• Consistency of Displays
An important consideration of the design is how long
students need to learn and use this tool. The
visualization based simulator demonstrates three
different network traffics. Consistency is the main
consideration. All traffic displays are in same format
as shown in figure 1. The top part of the display area
contains ten computers, routers, a server and a TCP
backlog queue. The second part is the control area
that consists of five Demo Controllers and five
buttons (Main, Prev., Next, Help and Challenge). The
third part is the quiz area that contains questions,
select radio buttons and answers.
• Using Different Colors
Five colors are used to emphasize various stages of
network traffic. Blue represents SYN request packets
from a client to the server. Red means SYN-ACK
request packets from the server to clients. Green
represents the final acknowledgement SYN-ACK-
ACK packets from the client to the server. When
SYN flood attacks occur, black represents packets
that attackers send to the server, and yellow
represents SYN-ACK requests packets the server
sends to the spoofed IP address. Different colors are
also used for Trash bucket, firewall, backlog queue
and computers.
• Help Functions
The Help function is another major consideration in
the design. Each demonstration contains a help
button. The help button describes the functionality of
each button used in the demonstration. This was put
in place to ensure that users do not have to guess the
functions of each button before using it.
• Function Buttons
Each of the demonstrations also contains the
following ten function buttons: play, pause, stop,
rewind, fast-forward, Main, Prev., Next, Help, and
Challenge. The first five buttons are self explanatory.
The main button will allow a user to go back to the
main screen. The Prev. button, which stands for
previous, will take a user back to the previous
demonstration. The next button will take the user to
the next demonstration. As stated earlier the help
button describes the functionality of each button that
is used in the demonstration. The last button is the
challenge button. The challenge button offers users a
short quiz on the demonstration to test their
knowledge.
The Visualization Based Simulator for SYN
Flood Attacks was implemented using Macromedia
Flash. Flash is lightweight and works well with html.
Flash is also perfect for motion and animation. The
version of flash that was used for this simulation was
Macromedia Flash MX 2004 (Adobe). It is composed
of html and ActionScript 2.0, which is similar to
JavaScript.
5 FUNCTION OF
THE SIMULATOR
The visualization based simulator provides three
demonstrations and a set of quizzes. To start the
demonstration, a user will first access the homepage.
The homepage contains four links. These links are
Home, Introduction of SYN flood, SYN flood
animated demo, and Other links. Introduction of SYN
flood will give users a detailed description of what a
SYN flood attack is and how it works. The SYN
flood animated demo link connects to the actual
visualization based traffic demonstrations. The Other
links bring a user links to other Computer Science
Department simulation tools.
The main page is the first page of the actual
visualization based simulator. It provides four
different options. On the left side there are buttons:
Normal Network Traffic, SYN Flood Attack,
Prevention Method and HOME. Once a user clicks on
any button, except the home, a brief description of
that demonstration will appear in a window in the
middle of the screen along with a corresponding Start
Demo button, which will run the demonstration. The
default button is Normal Network Traffic. The home
button will take a user back to the website’s
homepage.
5.1 Normal Network Traffic
This demonstration exhibits how the TCP three-way
handshake occurs in normal network traffic. Details
are shown in figure 1. The simulation scenario
consists of ten computers. Three of them, shown in
black, represent attackers and will not be used for this
demonstration. This demonstration also includes a
server and a TCP backlog queue. The TCP backlog
queue is used to hold connection requests to the
server until it receives their final acknowledgement or
until their lifetime expires. First the client sends a
SYN packet request to the server. The packet color
will be BLUE. Once the server receives the packet, it
sends back to the client a SYN-ACK request packet.
The packet color changes to RED, and the client’s
request is stored on the TCP backlog queue. As soon
as the client receives the SYN-ACK request, it will
respond to the server with a SYN-ACK-ACK. The
packet color changes to GREEN as shown in figure 1.
The server will receive the client’s SYN-ACK-ACK
A VISUALIZATION BASED SIMULATOR FOR SYN FLOOD ATTACKS
253
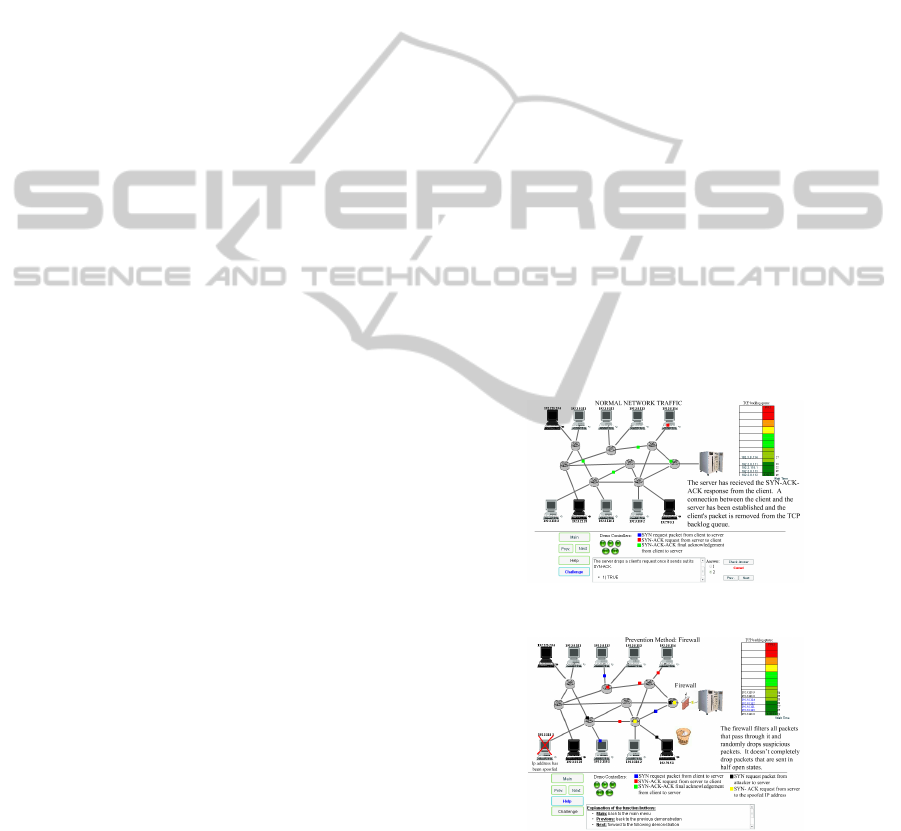
and a connection to the server is established. The
client’s initial request is removed from the TCP
backlog queue. The process will continue in this same
manner each time a new request has arrived.
5.2 SYN Flood Attacks
The SYN flood attack demonstrates an incomplete
connection handshake. It exhibits of how an actual
SYN flood attack occurs and what happens during
that time period, as shown in figure 2. The
demonstration includes ten computers, one server,
and its TCP backlog queue. Three black computers
represent attackers. One computer, marked with a red
x, represents the IP address that has been spoofed.
The server is the targeted computer. The TCP
backlog queue stores all received SYN requests with
their IP addresses. The wait time is the lifetime of
each packet since it was received by the server, and
waits for a final acknowledgement from the client.
During the SYN flood attack, a combination of
attackers and normal computers begin to make
requests to establish a connection to the server.
Attackers will begin sending out a large number of
SYN packets, using a spoofed source IP address, to
make a request to connect to the server. The packet
color of the attacker’s SYN request packets is
BLACK as is shown in figure 2. Once the server
receives the request it will send out a SYN-ACK
request to the spoofed IP address and wait for its
response, which it will never receive. The packet
color changes to YELLOW. Each request will be
stored in the TCP backlog queue and will expire
when its wait time runs out. For this demo the wait
time is located next to each packets request on the
TCP backlog queue. At the same time the regular
computers will begin making requests to connect to
the server as well. Packet color for regular computers
is BLUE. The TCP backlog queue will become full
since it is trying to process requests faster than it can
handle them. At this time, for the demonstration, a
trash bucket and a lock will appear as shown in figure
2. The lock represents the TCP backlog queue is full
and no new SYN request can be accepted. The trash
bucket represents some of the packets being dropped.
It shows access being denied because the TCP
backlog queue is full. Once the wait time of each
packet, which is thirty-two seconds for this
demonstration, runs down, the SYN packet will be
removed from the TCP backlog queue. The new
arriving packets will be accepted.
5.3 Prevention Method
In the prevention method demonstration, a firewall is
placed in between the last router and the server as a
prevention method for the SYN flood attack. Details
are shown in figure 3. Firewalls are useful against
SYN flood attacks but they cannot completely stop
SYN flood attacks. Firewalls help to slow down SYN
flood attack, filter out packets that are sent in a half
open state and increase server efficiency. In this
demonstration the firewall only drops some of the
half open packets, which are sent from attackers, but
not all. The packets that are filtered out by the
firewall are dropped at random. This demonstration is
similar to the SYN flood attack. Attackers will begin
sending out a large number of SYN packets, using a
spoofed source IP address, to make a request to
connect to the server. The packet color of the
attacker’s SYN request packet is BLACK as shown
in figure 3. Once the server receives the request it
will send out a SYN-ACK request to the spoofed IP
address and wait for its response, which it will never
receive. The packet color changes to YELLOW.
Each request will be stored in the TCP backlog queue
and wait for the client’s response. These packets will
stay in the TCP backlog queue until its waiting time
expires. In this demonstration some attack request
packets will pass the firewall and some will not.
Figure 3 is a snapshot of attack packets have been
filtered out and dropped into the trash bucket.
Figure 1: Normal network traffic.
Figure 2: SYN flood attack-queue full.
5.4 Quizzes
A set of quizzes is designed to help students
understand the concepts. The quiz is composed of
three questions in each demonstration. They can be
multiple-choice or fill in the blank. Once a user
IVAPP 2011 - International Conference on Information Visualization Theory and Applications
254

selects the answer to a challenge question, the user
has the option of checking the selected answer by
clicking on the Check Answer button or the user can
move to the next challenge question by clicking the
next button.
Figure 3: Prevention method: firewall.
6 ASSEMENT RESULTS
A survey was given to a class of first year graduate
students that used the SYN flood animated simulator.
This survey asked the students to assess how effective
they perceived the simulator was in explaining SYN
flood attacks. The results of the survey are shown
below in figure 4. All of the students indicated that
the SYN flood simulator helped them to understand
SYN flood attacks, helped them to understand normal
network traffic and accurately described a SYN flood
attack. These survey questions all received an average
response of 4.2 or better on a five point scale where
5.0 is a perfect score. The students also reported that
the graphic interface is user friendly with an average
response of 4.2. This was enforced by several
comments that reported that the user interface,
particularly the animation, improved the students
understanding of how the attack worked. The lowest
ranked survey question (with a score of 3.1 out of 5)
related to their knowledge of how to prevent SYN
flood attacks. While the SYN flood animator
addresses this issue, solutions to SYN flood attacks
can be complex.
Figure 4: Averages of assessment survey responses.
7 CONCLUSIONS
A Visualization Based Simulator for SYN Flood
Attacks has been designed and implemented to
visually educate the students on how a SYN flood
works, and to accurately depict and show how a SYN
flood attack occurs. It was noticed that students learn
well when they have a hands on tools that they can
use to visually see how different attacks work. This
visualization based simulator showed students three
scenarios: Normal Network Traffic, SYN Flood
Attack, and a Prevention Method. Overall one thing is
clear, firewalls help to slow down SYN flood attacks
but it does not completely prevent them.
The SYN flood simulator has been used in the
first year graduate class COMP 620 Information,
Privacy and Security in the fall 2010 and received
excellent results. Our experience shows that by using
this visualization Based education tool, the students
get hands-on experience and a deep understanding of
the concept of information assurance. More broadly,
this simulator can be used in computer science,
information management system, computer
engineering in any colleges and universities to help
students understand SYN flood concepts and get
hands-on experiences as part of information
assurance curricular activities.
ACKNOWLEDGEMENTS
This work was partially supported by National
Science Foundation under the award numbers DUE-
0723491and DUE-0830686.
REFERENCES
Adobe, Adobe Flash Support Center, Available at: <http://
www.adobe.com/support/flash> [Accessed 10 October
2010].
CERT
®
Advisory, CA-1996-21 TCP SYN flooding and IP
Spoofing Attacks, Aailable at: <http://www.cert.org/
advisories/CA-1996-21.html> [Access 10 January
2011]
IBM, Internet Security Systems, Available at: <http://
www.iss.net/security_center/advice/Exploits/TCP
YN_flood/default.htm> [Accessed 12 December 2010]
Gao, Z. and Ansari, N., May 2005, Tracing Cyber Attacks
from the Practical Perspective, IEEE Communications
Magazine, Vol. 43, Issue 5.
Scott A., User Interface Design Tips, Techniques, and
Principles, Available at: <http://www.ambysoft.com/
essays/userInterfaceDesign.html> [Accessed 10
October 2010].
A VISUALIZATION BASED SIMULATOR FOR SYN FLOOD ATTACKS
255
