
PREDICTED RELATIVE METABOLOMIC TURNOVER
Predicting Changes in the Environmental Metabolome from the Metagenome
Peter E. Larsen, Frank Collart, Folker Meyer and Jack A. Gilbert
Argonne National Laboratory, Argonne, Illinois, U.S.A.
Keywords: Metagenomics, Metatranscriptmics, Marine, Ecology, Metabolomics, Modeling, Metabolites.
Abstract: Metagenomics, the sequencing and analysis of genomic DNA extracted directly from an environment, can
provide insight into taxonomic and functional diversity, but there are few tools for directly comparing
metabolomes predicted from metagenomic data sets. We present a new method, Predicted Relative
Metabolomic Turnover (PRMT), for comparing the predicted environmental metabolomes encoded in
separate metagenomes and identifying those compounds predicted to be differentially metabolized. The
PRMT method was validated using three separate sets of ocean metagenomic sequence studies, totaling 15
metagenomic samples, over 4.5 million sequence fragments and over 840 million base pairs. These data sets
enable the construction of models representative of the environmental metabolome of the English Channel.
Not only did 88% of the predicted metabolic Predicted Metabolic Relative Turnover shows excellent
correlation with observed oceanographic parameters, but PRMT derived parameters are shown to generate
potentially constructive and testable biological hypotheses that could form the basis for future biological
experiments.
1 INTRODUCTION
Marine biomes dominate the planet’s surface and
single-celled microorganisms are responsible for up
to 98% of the oceans’ primary metabolic
productivity (Jørgensen and Boetius, 2007). These
extremely diverse microbial communities inhabit an
ocean zone containing the largest active pool of
near-surface carbon on the planet (Buesseler et al.,
2007) and are a dominant force in the planet’s
biogeochemical cycles. Understanding the nutrient
and carbon turnoveres of the world’s oceans has key
applications for understanding global ecology. One
now widely used tool for gaining insights into the
components and functionality of this ecosystem is
metagenomic sequencing.
The task of understanding the metabolic
interactions in any microbial community is a
daunting one and undertaking this effort in a
dynamic fluid like the ocean is even more complex.
This problem is compounded by the difficulty
associated with access to water sampling and
obtaining reliable measurements for the metabolites
for which we have reliable analytical methodologies;
let alone the vast number of metabolites and
compounds for which we have no reliable analytical
tools. Metabolomics approaches using techniques
such as NMR or GC-MS ((Bundy et al., 2009),
(Viant, 2007), (Viant, 2008), (Lin et al., 2006))
provide a snap shot of a fraction of the metabolites
present in an ecosystem and enable characterization
of the metabolic fingerprint of a given sample. These
are powerful tools for analyzing the relative
abundance of certain metabolites and can be used in
conjunction with genomic and transcriptomic
techniques to determine the relative importance of
key metabolites in biological processes. This is
important for modeling the metabolomic network
because not all genes in a metagenome are active
when observed, and not all transcripts will form a
functioning protein or enzyme. These constraints
indicate there is a pressing need to develop
techniques that leverage computational and omics
approaches, e.g. linking metagenomics to
metatranscriptomics to metaproteomics to meta-
metabolomics.
Metagenomic perspectives have traditionally
been focused on measuring the differences in
proportions of different genes which are annotated
from shotgun-sequenced datasets (e.g. (Rusch et al.,
2007)); but the real power comes from an ability to
link metabolism to metagenomic data, which could
vastly improve our understanding of the ecosystem
dynamics occurring within an environment. Previous
337
Larsen P., Collart F., Meyer F. and Gilbert J..
PREDICTED RELATIVE METABOLOMIC TURNOVER - Predicting Changes in the Environmental Metabolome from the Metagenome.
DOI: 10.5220/0003314803370345
In Proceedings of the International Conference on Bioinformatics Models, Methods and Algorithms (Meta-2011), pages 337-345
ISBN: 978-989-8425-36-2
Copyright
c
2011 SCITEPRESS (Science and Technology Publications, Lda.)

studies linking metabolomic profiles with nucleic
acid datasets have focused on interpretation of
metatranscriptomes by linking the presence of
specific metabolites to the change in abundance of a
specific protein (Santos et al., 2010). Currently,
methods are being developed to extract a wide
variety of environmental features from metagenomic
sequence data ((Wooley et al., 2010), (Heidelberg et
al, 2010)). Additionally, metagenomics is used to
help determine the taxonomic diversity of a
microbial community, using the taxonomic marker
gene 16S rRNA, and the functional diversity through
annotation of protein coding sequences through
comparison to curated protein databases such as
RefSeq (Pruitt et al., 2007), KEGG (Kanehisa and
Goto, 2000), KEGGnoggs (Muller et al., 2010),
SEED (Overbeek et al., 2005), in cases where the
sequence quality is enabling, more expensive HMM
type searches like PFAM (Finn et al., 2008) or
TIGRfams (Selengut et al., 2007), and linking
environmental conditions with specific biological
processes detected in metagenomic data (Gianoulis
et al., 2009). Finally, metagenomic bio-prospecting
is starting to be used by some groups to find
enzymes with potentially novel activities associated
with bioremediation, pharmaceuticals, and the
search for industrial biocatalysts (e.g.
http://metasystems.riken.jp/metabiome). While
informative, simply describing and counting the
annotations found in a metagenomic dataset will
only help to describe the functional differences
between two or more ecosystems. However,
metagenomic data can be used to make predictions
about the metabolic throughput for an ecosystem and
to generate hypotheses about what chemical
compounds are being actively consumed or
synthesized.
A traditional definition for metabolic turnover is
the rate of turnover of molecules through a
metabolic pathway. Though enzymes work at
reactions rates measured in seconds or minutes,
environmental samples are compared across much
different scales. Therefore, analyses that illustrated
metabolome changes occurring over hours or
months and over distances measured in meters or
miles are more important for understanding the
impact of global changes in the ecosystem. As a
result, we require a new approach, other than
turnover is needed to describe predicted changes in
environmental metabolomes at these large-scale
resolutions.
Here, we propose a methodology for predicting
relative turnover, which we define as the predicted
metabolic consequences of changes in the relative
abundance of genes for specific enzymatic activities
between metagenomic datasets. We call this
technique Predicted Metabolic Relative Turnover
(PRMT). PRMT is not intended as a replacement for
enzyme turnover measurements. Rather the goal of
the PRMT method is to predict the changes in
metabolic capacities of two or more metagenomics
samples and use that information to predict the
effects of those changes on the relative ability to
consume or synthesize specific metabolic
compounds. We will describe our methodology for
predicting metabolic relative turnovers and
demonstrate its validity by comparing our
predictions to measurements of specific
environmental parameters in two datasets from a diel
and seasonal time course of the coastal marine
observatory L4 in the Western English Channel.
2 RESULTS
To interpret metagenomic data in terms of the
synthesis or consumption of metabolites, it is
necessary to define a useful model of an
environmental metabolome and describe that
network of interactions in terms amenable to our
approaches. We must also derive a metric by which
different environmental metabolomes can be
compared. For the purpose of this study, we define a
predicted environmental metabolome as the
complete set of possible enzymatic reactions and the
metabolic compounds implied by those reactions for
the set of enzymes encoded in a set of environmental
metagenomes. A predicted environmental
metabolome can be expressed as a connectivity
matrix, which we term the Environmental
Metabolomic Matrix (EMM). From the annotations
of the predicted protein products in a metagenome,
we can derive a measurement we term the Enzyme
Gene Count (EGC), defined here as the number of
sequences in a metagenomic sample that are
predicted to code for proteins that are annotated with
a specific enzymatic activity. Hence, there is an
EGC value for every enzyme activity in an EMM.
To enable comparisons of individual metagenomes,
this Enzyme Gene Count needs to be normalized
(nEGC) by adjusting for the total EGCs in a
metabolome and to the total EGCs in the set of
metagenomes selected for analysis.
Our proposed method generates an EMM for
every set of metagenomes and a set of PRMT values
BIOINFORMATICS 2011 - International Conference on Bioinformatics Models, Methods and Algorithms
338

Figure 1: Complete predicted environmental metabolome of L4. The complete environmental metabolic capacity network
for the L4 environmental metabolomes, constructed from metagenomic analysis is pictured here. In this figure, nodes
represent metabolic compounds and edges are enzyme-mediated transformations. There are 2692 compounds and 4697
enzymatic transformations in this combined environmental metabolome. This figure was generated in Cytoscape 2.6.1 with
spring embedded layout (Shannon et al., 2003).
for every metabolic compound in an EMM for each
collected metagenome. A PRMT value predict a
change in the rate of turnover of a compound in one
metagenome-predicted metabolome relative to
another. A positive PRMT value indicates that a
reduced turnover is expected and that the compound
is predicted to be either more likely synthesized or
less likely consumed relative to a reference
metagenome. A negative PRMT value indicates
increased compound turnover is expected and that
the compound is less likely synthesized or more
likely consumed relative to a reference metagenome.
The ability of the PRMT approach to identify
relative changes in environmental metabolomic
capacities using metagenomic data was validated in
the context of three different sampling distributions:
an environmental metabolome sampled over the
course of a day, seasonal variation in ocean
ecosystems sampled in the course of a year, and with
increasing ocean depth from 10m to 4000m. For
these characterized sample sets, the predicted
changes in metabolism can be correlated with the
relative abundance for biological measurements of
available nutrients and environmental conditions. To
be a useful biological tool, PRMT must be able not
only to replicate prior observations, but it must also
be able to make relevant predictions about a
metabolome. Here, we show that PRMT can yield
testable hypotheses about specific environmental
metabolic interactions, by selecting sub-networks of
the larger predicted metabolome for careful analysis.
Two ocean metagenomic experimental data sets
from the English Channel were used for the
demonstrations of the PRMT approach. Four
metagenomic samples were collected at six hour
intervals at a sampling station in the English
Channel to track the day-night cycle of metabolite
turnover at the surface of the L4 coastal observatory.
Eight metagenomic samples at the same location
were used to investigate seasonal metabolomic
dynamics.
Variability in the population compositions is
observed in each of the metagenomic data sets used
for PRMT validation. The oceanographic parameters
associated with the metagenomic samples also
demonstrate substantial changes in environmental
conditions and nutrient availability in environmental
samples. The change in bacterial community
composition and in environmental parameters
suggests that there is good reason to expect a change
in the overall environmental metabolome across
sampled points in these metagenomic data sets.
Hence, PRMT is a beneficial tool to compare these
environmental samples and predict change in the
environmental metabolomes as a function of time or
depth.
The set of all EC activities for each metagenomic
sampling at L4 used to construct predicted
environmental metabolomes (Figure 1). The L4
metabolome is comprised of 2610 predicted
metabolites and 5067 EC-mediated interactions. The
largest single interconnected network of metabolic
interactions consists of 1551 metabolites and 4030
EC-mediated interactions. The second largest sub-
network has 39 metabolites and 68 EC-mediated
interactions. There are 298 very small sub-networks
comprised of two-metabolites each.
To evaluate the utility of the PRMT approach to
represent the environmental metabolomes, we first
consider how well predicted compound turnoveres
PREDICTED RELATIVE METABOLOMIC TURNOVER - Predicting Changes in the Environmental Metabolome from
the Metagenome
339
correlate with the relative abundance of several
measured oceanographic parameters (chlorophyll A,
total organic nitrogen, total organic carbon, NO
2
+
NO
3
, ammonia, and soluble reactive phosphate) and
consider the results in light of biological
expectations. A positive or negative correlation of
RMF with relative environmental parameter
measurements conveys information about the
predicted network. A positive correlation, increasing
relative abundance of a parameter with increasing
RMF, indicates that when a compound is more
abundant in the environment so is the metabolic
capacity for the synthesis of that compound. A
negative correlation, increasing abundance of a
compound with decreasing RMF, indicates that
when a compound is more abundant in the
environment so is the metabolic capacity for its
consumption.
Diel metabolomic dynamics at the coastal L4
station. A diel cycle model was generated from four
metagenomic data sets derived from biological
samples obtained at the L4 station. In this analysis,
the PRMT model predictions for the relative
synthesis or catabolism of specific metabolites
represents absolute values for entire diel cycle. The
predicted PRMT for specific metabolites had a
significant, positive correlation with the direct
analytical measurements for relative abundance of
total organic nitrogen and total organic carbon
(Table 1). The positive correlation indicates
increased steady state levels (increased synthesis
and/or reduced turnover) of these compounds.
Additionally the PRMT predictions for chlorophyll
A, ammonia, and soluble reactive phosphorus,
demonstrated significant negative correlation with
the direct analytical measurements. However, the
predicted PRMT for nitrate and nitrite showed no
correlation with the observed measurements. The
positive correlation with total organic carbon and
nitrogen and negative correlation with chlorophyll a,
ammonia, and soluble reactive phosphorus indicates
that the PRMT model is potentially suggesting that
there is a synthesis of biomass occurring over the
course of a day, likely drawing on
photosynthetically-derived carbon and energy
inputs, and is consuming dissolved ammonia and
phosphorus in the process. At first look, the
significant negative correlation between PRMT-
values for chlorophyll a and the biological
measurements, indicating potentially increased
catabolic consumption of chlorophyll when it is
most abundant, appears counter-intuitive. It is
important however, to remember that PRMT does
not predict the absolute concentration or changes in
abundance of a compound in an environment, but
instead PRMT calculates the relative rate of turnover
of a metabolite in the pathway. In response to photo-
damage, there is continuous chlorophyll degradation
and repair in photosynthetic organisms and that
chlorophyll hydrolysis need not result in a net
decrease in chlorophyll concentrations((Vavilin and
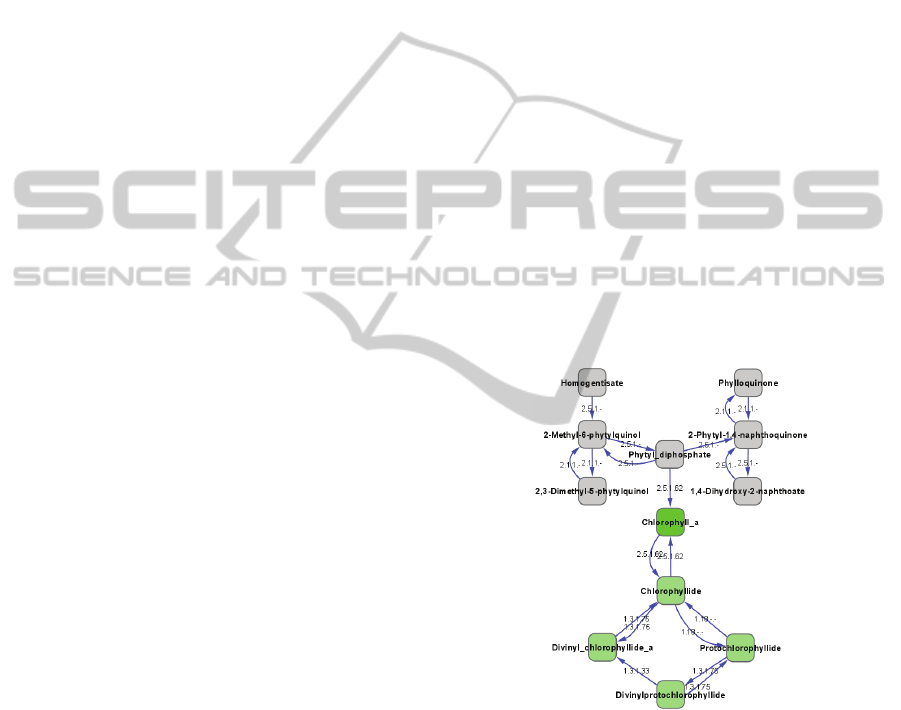
Vermaas, 2007), (Beisel et al., 2010)). This can be
confirmed by selecting from the complete
metabolome model a sub-network of compounds
within three nearest neighbors of chlorophyll A
(Figure 2). This sub-network identifies a cyclical
metabolic loop by which chlorophyll A is
hydrolyzed and replenished.
Seasonal metabolomic dynamics at the coastal L4
station. The predicted PRMT values for the relative
abundance of measured metabolites between
January, April and August 2008 at the L4 coastal
observatory all demonstrate significant negative
correlations except for nitrate concentrations (Table
2). This significant negative correlation for the
PRMT indicates that between January and August
there is a relative increase in the consumption of all
metabolites, hence when a nutrient is available the
enzymatic capacity for the metabolism of that
Figure 2: Identified metabolism pathway for chlorophyll a
turnover in L4 diel cycle data. A sub-network was
generated from the complete L4 EMM by selecting all
compounds within three nearest neighbors of chlorophyll
a. In the network, chlorophyll a is highlighted in green and
the cycle of metabolic interactions predicted to be
responsible for chlorophyll a turnover are highlighted in
light green.
nutrient is also present. Obviously, the extended
time-frame for analysis permits greater variability in
measured parameters and hence represents periods
of tremendous turnover. However, this suggests that
increase in biological productivity between January
BIOINFORMATICS 2011 - International Conference on Bioinformatics Models, Methods and Algorithms
340

and August causes an overall decrease in the
availability of nutrients, as would be expected.
Table 1: Diel Cycle Correlation of Calculated PRMT and
Observed Parameters at the L4 Station.
Measured
Oceanographc
Parameter
KEGG
Metabolites
Correlation
with all
other
metabolites
Correlation
Chlorophyll A Chlorophyll a 0.00 (0.58)
-0.86
Total Organic
Nitrogen L-Amino acid 0.00 (0.57)
0.71
Total Organic
Carbon Starch 0.00 (0.72)
0.93
NO2 + NO3 Nitrite 0.01 (0.65) 0.24
Ammonia NH3 0.00 (0.51)
-0.76
SRP
Orthophosphat
e 0.00 (0.57)
-0.91
Table 2: Seasonal Correlation of Calculated PRMT and
Observed Parameters at the L4 Station.
Measured
Oceanographc
Parameter
KEGG
Metabolites
Correlation
with all other
metabolites
Correlation
Chlorophyll A Chlorophyll a 0.03 (0.65)
-0.76
Total Organic
Nitrogen L-Amino acid 0.03 (0.76)
-0.88
Total Organic
Carbon Starch -0.03 (0.78)
-1.00
NO2 + NO3 Nitrite -0.02 (0.63)
-0.69
Ammonia NH3 0.00 (0.64)
-0.96
SRP
Orthophosphat
e -0.02 (0.61)
-0.68
3 DISCUSSION
We have presented PRMT, a technique for
producing a prediction of the metabolic relative
turnover of specific metabolites between two or
more predicted environmental metabolomes inferred
from metagenomic datasets. This represents an
initial step on the way to true multi’omic
comparative analysis by creating predictive or
modeled meta-metabolomic data from metagenomic
data. PRMT can generate hypotheses about
environmental metabolism that immediately propose
experiments in environmental monitoring. PRMT
was applied to generate biological hypotheses, as for
identification of accelerated rates of chlorophyll
turnover in response to photo damage from sunlight,
and used to deduce the metabolism of biologically or
chemically difficult to measure environmental
parameters.
One of the most significant problems facing
ecological systems science is parameterization of the
ecosystem dynamics. Long term monitoring of any
site requires considerable investment and
infrastructure to provide the capacity for collecting
samples from the site and have co-acquisition of
environmental information, e.g. salinity, pressure,
temperature, porosity, humidity, light availability.
The problems regarding the measurement of these
physical parameters pales by comparison when we
consider the measurement of nutrients and other
biological metabolites, e.g. nitrate, nitrite, ammonia,
methane, sulfate, phosphate, etc. Measuring and
storing such a wide array of environmental
parameters requires not only extensive expertise but
also financial support ,which limited the extent of
many observatories. Ongoing and future projects
such as the Global Ocean Survey, TARA Oceans,
Hawaiian Ocean Time Series, Western Channel
Observatory, Bermudan Ocean Time Series, Long
Term Ecological Research sites, NEON,
Terragenome, etc., are going to great lengths to
include as many measurements as possible of
environmental parameters. These initiatives will
help to characterize the ecology of these
communities, however, they are still only broad
stroke analyses, there are potentially millions of
metabolites associated with the microbial
communities of any environment and to perform true
metabolomic interpretation of community dynamics
it would be necessary to examine the concentrations
of all of these and how they change with time or
space.
Although calculated PRMT values tended to
correlate well with relative abundance of measured
ocean parameters, there were a few cases where
good correlation was not observed. Measured ocean
parameters might not necessarily match intracellular
concentrations where metabolite concentrations are
being affected by the metabolism of more complex
molecules not represented in the KEGG enzymatic
reactions. There may also be instances for which the
number of times an enzymatic activity is detected in
the metagenome does not directly correlate with the
relative rate of enzyme activity. Even where there
was good correlation, the data presented in Tables 1-
3 indicate that the best correlations of predicted
metabolite’s PRMT value was not always with the
metabolite’s corresponding environmental
parameter. One reason for this is the high degree of
interdependence in the EMM. A metabolite’s PRMT
is not independent, but is closely linked to the
predicted metabolites in its immediate
neighborhood. Also, in some cases an exact
correspondence between measured environmental
parameter and KEGG metabolite. While, for
example, relative abundance of TOC and PRMT
values for the KEGG metabolite starch may
PREDICTED RELATIVE METABOLOMIC TURNOVER - Predicting Changes in the Environmental Metabolome from
the Metagenome
341

correlate well, there is no reason to think that there
might not be other carbon-related metabolites that
correlate as well or better. Finally, analysis was
partially hampered by the small number of samples
relative to the large number of calculated PRMT
values and nEGCs. With biological replication of
metagenomic data, the PRMT method will be able to
interpret results in the context of statistical
significance.
A question that remains is how much
metagenomic sequencing data is ‘enough’ to capture
a useful picture of an environmental metabolome.
This study analyzed approximately less than a 1000
th
of one percent of the genetic material in the sample
volume analyzed, and of that only less that 50% of
predicted proteins could be annotated. In seeking
better annotation of metagenomic sequence data, it
is possible that PRMT analysis will also have an
application. Looking for inconsistencies in the
predicted metabolic relative turnover when
compared to environmental parameters and then
using massively parallel computing to determine the
combination of sequences, both annotated and
orphaned, which would help to improve the
relationship between observed and predicted
turnover, may help to narrow down our
investigations regarding unknown or orphaned
metagenomic sequences.
Much enzymatic functional diversity in the ocean
has yet to be discovered and the KEGG metabolic
pathways do not contain all possible enzymatic
transformations in even the ocean environmental
metabolome. Although PRMT predicted the realized
turnovers in environmental metabolomes very well
in this study, with increased understanding of
environmental metabolomes, richer sets of known
metabolic interactions, and better annotations of
metagenomic data, PRMT will perform even better,
providing a powerful tool for the analysis of
metagenomic data. While we have chosen KEGG
databases and EC activities for this study, PRMT
could also accommodate definitions of enzyme
activity by methods other than EC annotation and
can utilize other databases of metabolic interactions
such as the curated databases of metabolic networks
Metacyc (Caspi et al., 2010) or BRENDA
(Schomburg et al., 2002). The ability to predict
relative metabolic consequences of changes in
environmental metabolomes encoded by sequenced
metagenomes is expected to have applications in
carbon management, bioremediation, and annotation
of previously unknown function in metagenomic
sequence data. As additional volumes of
metagenomic data are collected, as each sequenced
metagenome contains more sequence data, and as
the accuracy and completeness of metagenomic
sequence annotations continues to improve, the
PRMT method will be able to incorporate those
advances and expand its ability to serve as an
important tool for metagenomic analysis.
4 METHODS
The principle steps of the PRMT method are the
acquisitions of annotated metagenomic data sets, the
generation of EMM and nEGC from annotated
metagenomes, and calculating PRMT values using
EMM and nEGC. Generate Environmental
Metabolome Matrix (EMM) For the purpose of
this study, an Environmental Metabolome is the set
of all detected enzyme activities encoded in a
metagenome and all of the metabolite compounds
implied by those activities. One EMM is generated
for each set of metagenomic data collected from a
given environment. This network of predicted
metabolic reactions represents the theoretical
metabolic capability of an environmental
metabolome, not necessarily the actual reactions and
compounds associated with an environment or the
reactions taking place in an ecosystem. For this
study, the set of Kyoto Encyclopedia of Genes and
Genomes (KEGG) metabolic reactions were used
the represent the set of all possible metabolic
reactions in an environmental metabolome and
Enzyme commission number (EC) annotations of
activity are used to assign function to predicted
proteins encoded in metagenomes. KEGG contains a
large collection of manually curated metabolic
pathways taken from literature references and
published materials. EC numbers are a classification
scheme for enzyme activities based on the chemical
reactions they catalyze. KEGG reactions contain
identities for the reactant compound, product
compounds, and mediating EC activity. The KEGG
compounds water, di- and tri-phospho nucleotides,
NADP+, NADPH, and CoA were excluded from the
list of possible reactants as being non-specific to
particular reactions and metabolic processes. The set
of predicted interactions in the environmental
metabolome is converted into a connectivity matrix,
referred to as the Environmental Metabolome Matrix
(EMM) by the method. If an EC-mediated reaction
is identified as reversible in the KEGG database,
then both forward and reverse reactions are included
in the EMM. If a particular transformation is
attributed to more than one EC activity, then each
activity is incorporated into the EMM. Essentially,
BIOINFORMATICS 2011 - International Conference on Bioinformatics Models, Methods and Algorithms
342

metagenomic data is mapped to specific enzymes
that enable inference of metabolic compounds
associated with these activities. The sum of these
activities and compounds as organized into a cellular
network represents the predicted environmental
metabolome. The connectivity of this network can
be represented as a matrix and normalized by
restricting the sum of all inputs or outputs to 1 or -1,
respectively. Calculate Normalized Enzyme Gene
Counts (nEGC) for Each Metagenome For each
enzyme activity in the EMM, the Enzyme Gene
Count (EGC) is determined. The EGC is the number
of sequence reads in a metagenome that are
predicted to code for proteins that are annotated to
enzymes with a specific EC enzyme activity. For
each enzyme activity, the normalized EGC (nEGC)
is calculated using the following formula:
2
log
EC EC
All
Sample sample
Sample
Ave
nEGC EGC
Ave
=
⎛⎞
⎜⎟
⎝⎠
(1)
Where
EC
s
ample
nEGC
is the normalized enzyme gene
count for activity ‘EC’ in a specific metagenome.
EC
Sample
EGC
is the number of times enzyme activity
‘EC’ was assigned to a sequence in metagenome ‘x’.
Ave
Sample
is the average of all EGC in a metagenome.
Ave
All
is the average of all EGC in the set of all
analyzed metagenomes.
Calculation of Predicted Metabolic Relative
Turnover (PRMT) It is currently impractical to
model the metabolic turnover and metabolite
concentrations for every nutrient potentially present
in the ocean environment. However, we can model
the differences in two or more environmental
metabolic networks and predict the relative synthesis
or metabolism of specific metabolites for different
environmental metabolomes and their respective
nEGCs. Here we present a novel method, Predicted
Metabolic Relative Turnover (PRMT) Analysis, for
the analysis of metagenomic data and the prediction
of differential metabolic capacities between
metagenomes. For calculating PRMT, grant certain
assumptions about the predicted environmental
metabolic network. First, we assume that all EC-
activity mediated reactions can be modeled as zero-
order for the range of conditions encountered in the
environment. Second, we assume all reactions are at
steady state equilibrium. We also assume that the
expressed enzyme concentration is proportionate to
the frequency at which the gene for that enzyme is
found in the metagenome. Additionally, we assume
that the reaction rate of an enzyme is proportionate
to enzyme concentration for the conditions
encountered in the environment.
PRMT is calculated:
(
)
xyXyx
ggMc
G
G
G
−
=
,
(2)
Where
,
x
y
c
G
is the vector of PRMT for all compounds
in EMM in metagenome ‘x’ relative to metagenome
‘y’. M
X
is the connectivity matrix for predicted
Environmental Metabolism Matrix (EMM) for the
set of all metagenomes X.
x
g
G
and
y
g
G
are vectors of
normalized enzyme gene counts (nEGC) for all
enzyme activities in metagenomes for metagenome
‘x’ and metagenome ‘y’, in the set of metagenomes
X. An example of an application of PRMT using a
simple network can be found in supplemental file
Text S1.
Calculations of PRMT returns unit-less values,
analogous to a fold change, for the predicted relative
metabolic activity in an experimental metabolome
relative to a reference metabolome for each
compound in the EMM. A positive PRMT indicates
that a compound is either more likely synthesized or
less likely consumed in the experimental
metagenome. A negative PRMT indicates that a
compound is more likely consumed or less likely
synthesized in the reference metagenome. Like a
fold change, a PRMT does not contain information
regarding concentration. A positive or negative
PRMT does not suggest an absolute tendency
towards synthesis or consumption of a compound
respectively, only its predicted relative rate of
metabolic turnover compared to another
metagenome. PRMT Correlation with Biological
Observations For the metagenomes analyzed here
by PRMT, measurements of oceanographic
parameters were also collected. To validate the
PRMT method, we considered how well PRMT
predicted changes in environmental metabolomes
compared with the actual measured changes in
oceanographic parameters. Although there are few
direct overlaps between measured parameters and
available KEGG compounds that were used in
EMM, in most cases a suitable compound useful for
comparison could be selected, such as starch for
total organic carbon or orthophosphate for soluble
reactive phosphate. For each data set, for each type
of metadata collected for an environmental sample is
expressed as relative abundance, calculated as the
base 2 log of the measured parameter value divided
by the average of parameter measurements across all
data points. Pearson’s Correlation Coefficient (PCC)
was calculated for measured values for an
oceanographic parameter and the corresponding
PREDICTED RELATIVE METABOLOMIC TURNOVER - Predicting Changes in the Environmental Metabolome from
the Metagenome
343

PRMT value for a KEGG compound in the EMM. A
correlation close to one indicates that when a
compound is present in the environment, PRMT
predicts that the enzymes involved in its synthesis
are present. A correlation close to -1 indicates that
when a compound is present in the environment,
PRMT predicts that the enzymatic pathways relevant
for its catabolism are present. A PCC close to zero
suggests that there is no relationship between the
environmental presence of a compound and its
calculated PRMT. To estimate how well paired
parameter measurements and PRMT values
correlated was generated, metabolome PCC scores
between a measured parameter and every compound
PRMT values in an EMM was calculated. The
average and standard deviation for all metabolome
PCC scores was calculated. A correlation between a
measured oceanographic parameter and its paired is
considered successful if the PCC score was less than
the average minus one standard deviation for
metabolome PCC scores, or if the PCC score was
greater than the average plus the standard deviation
of metabolome PCC scores.
REFERENCES
Jørgensen B. B, Boetius A. (2007) Feast and famine--
microbial life in the deep-sea bed. Nat Rev Microbiol
10:770-81.
Buesseler K. O, Lamborg C. H., Boyd P. W., Lam P. J.,
Trull T. W., Bidigare R. R, Bishop J. K., Casciotti K.
L., Dehairs F., Elskens M., Honda M., Karl D. M.,
Siegel D. A., Silver M. W., Steinberg D. K., Valdes J.,
Van Mooy B., Wilson S. (2007) Revisiting carbon
turnover through the ocean's twilight zone. Science
316(5824):567-70.
Bundy J. G., M. P. Davey, M. R. Viant (2009)
Environmental metabolomics: A critical review and
future perspectives. Metabolomics 5, 3-21.
Viant M. R. (2007), Metabolomics of aquatic organisms:
the new omics on the block. Mar. Ecol. Prog. Series
332, 301-306.
Viant M. R. (2008), Recent developments in
environmental metabolomics. Molecular Biosystems 4,
980-986.
Lin C-Y, M. R. Viant and R. S. Tjeerdema (2006)
Metabolomics: Methodologies and Applications in the
Environmental Sciences. J. Pestic. Sci. 31, 245-251.
Rusch D. B., Halpern A. L., Sutton G, Heidelberg K. B.,
Williamson S., et al. (2007) The Sorcerer II Global
Ocean Sampling Expedition: Northwest Atlantic
through Eastern Tropical Pacific. PLoS Biol 5(3): e77.
doi:10.1371/journal.pbio.0050077.
Santos E. M., J. S. Ball, T. D. Williams, H. Wu, F. Ortega,
R. van Aerle, I. Katsiadaki, F. Falciani, M. R. Viant, J.
K. Chipman, C. R. Tyler (2010) Identifying health
impacts of exposure to copper using transcriptomics
and metabolomics in a fish model. Environ. Sci.
Technol. 44, 820-826.
Wooley J. C., Godzik A., Friedberg I. (2010) A Primer on
Metagenomics. PLoS Comput Biol 6(2): e1000667.
doi:10.1371/journal.pcbi.1000667.
Heidelberg K. B., Gilbert J. A. and Joint I. (2010).
Review: The revolution in genomic approaches to
describe environmental microbial diversity. Microbial
Biotechnology. In press.
Pruitt K. D., Tatusova, T., Maglott D. R. (2007) NCBI
Reference Sequence (RefSeq): a curated non-
redundant sequence database of genomes,
transcripts and proteins. Nucleic Acids Res
35(Database issue):D61-5.
Kanehisa, M. and Goto, S. (200) KEGG: Kyoto
Encyclopedia of Genes and Genomes. Nucleic Acids
Res. 28, 27-30.
Muller J, Szklarczyk D, Julien P, Letunic I., Roth A.,
Kuhn M., Powell S., von Mering C., Doerks T., Jensen
L. J., Bork P. (2010) eggNOG v2.0: extending the
evolutionary genealogy of genes with enhanced non-
supervised orthologous groups, species and functional
annotations. Nucleic Acids Res. (Database
issue):D190-5.
Overbeek R., Begley T., Butler R. M., Choudhuri J. V.,
Chuang H. Y., et al. (2005) The subsystems approach
to genome annotation and its use in the project to
annotate 1000 genomes. Nucleic Acids Res. 17:5691-
702.
Finn R. D., Tate J., Mistry J., Coggill P. C., Sammut S. J.,
Hotz H. R., Ceric G., Forslund K., Eddy S. R.,
Sonnhammer E. L., Bateman A. (2008) The Pfam
protein families database. Nucleic Acids Res. 2008
Jan;36(Database issue):D281-8. Epub 2007 Nov 26.
Selengut J. D., Haft D. H., Davidsen T., Ganapathy A.,
Gwinn-Giglio M., Nelson W. C., Richter A. R., White
O. (2007) TIGRFAMs and Genome Properties: tools
for the assignment of molecular function and
biological process in prokaryotic genomes. Nucleic
Acids Res. 35(Database issue):D260-4.
Gianoulis T. A., Raes J., Patel P. V., Bjornson R., Korbel
J. O., Letunic I., Yamada T., Paccanaro A., Jensen L.
J., Snyder M., Bork P., Gerstein M. B. Quantifying
environmental adaptation of metabolic pathways in
metagenomics. Proc Natl Acad Sci U S A. 2009 Feb
3;106(5):1374-9. Epub 2009 Jan 22.
Vavilin D., W. Vermaas (2007) Continuous chlorophyll
degradation accompanied by chlorophyllide and
phytol reutilization for chlorophyll synthesis in
Synechocystis sp. PCC 6803. Biochim Biophys Acta.
1767(7):920-9.
Beisel KG, Jahnke S, Hofmann D, Köppchen S, Schurr U,
Matsubara S (2010) Continuous turnover of carotenes
and chlorophyll a in mature leaves of Arabidopsis
revealed by 14CO2 pulse-chase labeling. Plant
Physiol 152(4):2188-99.
Gilbert J. A., Thomas S., Cooley N. A., Kulakova A.,
Field D., Booth T., McGrath J. W., Quinn J. P., Joint I.
(2009) Potential for phosphonoacetate utilization by
BIOINFORMATICS 2011 - International Conference on Bioinformatics Models, Methods and Algorithms
344

marine bacteria in temperate coastal waters. Environ
Microbiol 1:111-25.
Quinn J. P., Anna N. Kulakova, Natalie A. Cooley and
John W. McGrath (2007) New ways to break an old
bond: the bacterial carbon–phosphorus hydrolases and
their role in biogeochemical phosphorus cycling.
Environmental Microbiology 9(10), 2392–2400.
Panas, P., Ternan, N. G., Dooley, J. S., and McMullan, G.
(2006) Detection of phosphonoacetate degradation and
phnA genes in soil bacteria from distinct geographical
origins suggest its possible biogenic origin. Environ
Microbiol 8: 939–945.
Caspi R., Altman T., Dale J. M., Dreher K., Fulcher C. A.,
Gilham F., Kaipa P., Karthikeyan A. S., Kothari A.,
Krummenacker M., et al (2010) The MetaCyc
database of metabolic pathways and enzymes and the
BioCyc collection of pathway/genome databases.
Nucleic Acids Res 38: D473–D479
Schomburg I., Chang A., Schomburg D. BRENDA,
enzyme data and metabolic information. Nucleic
Acids Res. 2002 Jan 1;30(1):47-9.
Meyer F., Paarmann D., D'Souza M., Olson R., Glass E.
M. et al. (2008) The metagenomics RAST server - a
public resource for the automatic phylogenetic and
functional analysis of metagenomes. BMC
bioinformatics 9, 386.
Gilbert J. A., Field D., Huang Y., Edwards R., Li W.,
Gilna P., Joint I. (2008) Detection of large numbers of
novel sequences in the metatranscriptomes of complex
marine microbial communities. PLoS One 3(8):e3042.
DeLong E. F., Preston C. M., Mincer T., Rich V., Hallam
S. J., Frigaard N. U., Martinez A., Sullivan M. B.,
Edwards R., Brito B. R., Chisholm S. W., Karl D. M.
(2006). Community genomics among stratified
microbial assemblages in the ocean's interior. Science
311(5760):496-503.
Karl, D. M. and R. Lukas (1996) The Hawaii Ocean Time-
series (HOT) Program: Background, rationale and
field implementation. Deep-Sea Res. II, 43, 129-156.
Shannon P., Markiel A., Ozier O., Baliga N. S., Wang J.
T., Ramage D., Amin N., Schwikowski B., Ideker T.
(2003) Cytoscape: a software environment for
integrated models of biomolecular interaction
networks. Genome Res. 13(11):2498-504.
PREDICTED RELATIVE METABOLOMIC TURNOVER - Predicting Changes in the Environmental Metabolome from
the Metagenome
345
