AUTOMATIC FACADE IMAGE RECTIFICATION AND
EXTRACTION USING LINE SEGMENT FEATURES
Chun Liu
INRIA Rocquencourt, Domaine de Voluceau, 78153 Le Chesnay, France
Keywords:
Perspective rectification, Line segment detection, Image segmantation, Markov random field, Symmetry de-
tection.
Abstract:
Recently image based facade modeling has attracted significant attention for 3D urban reconstruction because
of low cost on data acquisition and large amount of available image processing tools. In image based facade
modeling, it normally requests a rectified and segmented image input covering only the facade region. Yet this
requirement involves heavy manual work on the perspective rectification and facade region extraction. In this
paper, we propose an automatic rectification and segmentation process using line segment features. The raw
input image is firstly rectified with the help of two vanishing points estimated from line segment in the image.
Then based on the line segment spatial distribution and the luminance feature, the facade region is extracted
from the sky, the road and the near-by buildings. The experiments show this method successfully work on
Paris urban buildings.
1 INTRODUCTION
Urban modelingis becoming an intense research topic
because of practical interests and usages in several ar-
eas such as tourism, environment, military, economy,
etc. Among all methodologies for obtaining 3D city
representations, image based approach is preferred
most because this approach offers low cost and has a
lot of flexibility. This image based approach involves
detecting and recognizing the overall structure of a
building and the individual elements from 2D ground
images, which will be used later for 3D reconstruction
of the cities.
The first step in image based modeling procedure
(see figure 1) is to rectify the raw image against the
perspective distortion and to extract region of interest.
Upon the completion of this process, a rectified and a
much cleaner image input with less distortion and in-
terference from unrelated image content is produced.
This way, the determination of building structure and
the recognition of various building elements become
much easier and more straightforward.
However less research work has been done on the
automation of this process. This is due to the fact
that the urban scenes have added many layers of com-
plexity into the process automation. And usually this
task is left to the manual processing in most interac-
tive modeling softwares. Consequently, in the large
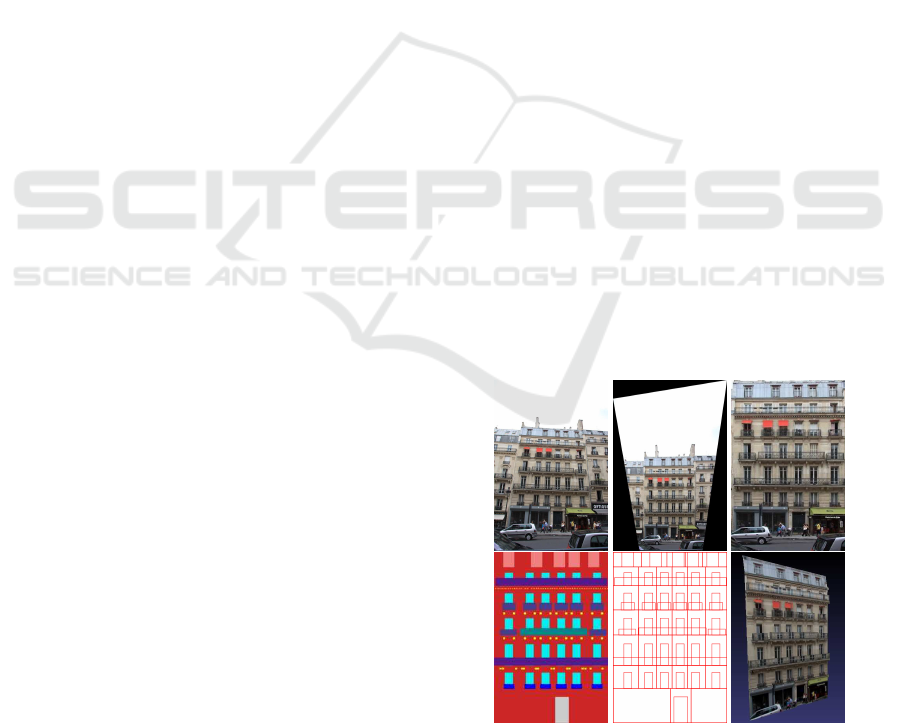
Figure 1: Modeling Procedure. left to right, up to down,
original image, rectified image, segmented facade image,
image semantic segmentation, geometry detection, final
model.
scale urban modeling with numerous facade images,
the manual rectification and extraction process can be
heavy and painful for the human modelers.
This paper describes an unsupervised automatic
process for rectification and extraction of complex fa-
cade images in Paris urban area. In this process, we
first extract line segments from the image and then
estimate the horizontal and vertical vanishing points.
104
Liu C..
AUTOMATIC FACADE IMAGE RECTIFICATION AND EXTRACTION USING LINE SEGMENT FEATURES.
DOI: 10.5220/0003316401040111
In Proceedings of the International Conference on Computer Vision Theory and Applications (VISAPP-2011), pages 104-111
ISBN: 978-989-8425-47-8
Copyright
c
2011 SCITEPRESS (Science and Technology Publications, Lda.)

The line segment is defined as the edge with a pre-
cise length. Using the two vanishing points, the ho-
mography matrix which defines the image projection
is estimated and the image is rectified. Next in the
rectified image, the unwanted regions such as the sky,
the road and the neighbourhood area are recognized
by using the line segment spatial distribution and the
luminance features. As a result, the region of inter-
est where the building facade locates is extracted for
further analysis tasks.
The assumption and the requirement for this
method is that the facade images need to be taken in
a cloudy morning, or evening, of later Spring or early
Autumn, when the building facades are relatively il-
luminated homogeneously and less occluded by veg-
etation. In addition, the image needs to be taken with
large angle objective so the facade will be contained
in one single image. These restrictive conditions en-
sure that the facade image will preserve maximum de-
tails and different parts of the facade can be relatively
easy to differentiate in terms of geometry, color and
texture.
1.1 Related Work
The perspective rectification and image segmentation
for natural and urban scene interpretation have been
studied intensively in computer vision.
The general procedure for the interpretation in-
volves three steps, feature extraction, feature process-
ing based on mathematical modeling of the problem
and the final inference. The selection of features are
crucial and problem-specific. The widely used fea-
tures include shape, color and textures. Those visual
appearances are extracted straightforwardly and com-
pared directly using various error metrics. However,
in complicated urban scenes, where human made ob-
jects could be highly textured and occluded, those
visual appearance features are not suitable for direct
comparison. For instance, a blazing window glass can
reflect any visual content from the sky or neighbour-
hood which is interfering and not related to the true
characteristics so that two identical windows may ap-
pear different visually.
The edges, which are the discontinuities over the
borders of objects on images, can provide strong clues
for object shape and location information. This is es-
pecially apparent in man-made objects where many
rectangular surfaces exist such that horizontal and
vertical edges are often seen. For complex shape de-
tection, one can take advantage of processing edges
elaborately. Similarly, proper clustering of the edges
can be utilized to analyze the overall typology of the
man made objects such as architectures where repe-
tition and symmetry of primitive geometries are the
typical composition characteristics. In addition, the
distribution of edges could reveal other useful infor-
mation such as the orientation of the scene.
Traditionally, the detection of line segment, is
based on edge detection and the Hough trans-
form (Matas et al., 1998). And the line segment hy-
pothesis is usually validated by hard decisions on the
gap and length thresholds. As a result, this detec-
tion often produces false line segments, which can be
harmful to further edge feature processing. Rafael et
al (Grompone von Gioi et al., 2010) proposed a fast
line segment detection algorithm which provides al-
most no false line and the computation time is linear.
This algorithm takes gradient as input and searches
for line region by considering less false detection. The
output from this algorithm is close to human percep-
tion such that in case of a noisy like texture, there will
be no line segment detected. With this line segment
detector, the line segment is robust and less biased for
computer vision problems.
In processing architectural photos, the successful
perspective rectification depends on accurate estima-
tion of vanishing points, which are intersecting points
from line segments on images. In highly rectangular
textures (Liebowitz and Zisserman, 1998), lines can
be easily extracted and rectification is completed by
combining affine rectification with vanishing points
and metric rectification with other priors like known
angles between lines. However, generally, such prior
information can not be obtained automatically and
needs human interaction. In general case (Kalantaria
et al., 2008), the image is rectified by using two van-
ishing points and solving the homography matrix di-
rectly. The certainty of less interference from false
line detection is provided by using RANSAC algo-
rithm. However, the rectification is less efficient due
to abundant false line segments.
The segmentation of outdoor scene could also
benefit from line segment detection. Derek Hoeim
(Hoiem et al., 2005) proposed a decision tree based
machine learning algorithm for outdoor scene seg-
mentation. In his method, the direction of edges
is considered as key feature and was shown to pro-
vide useful information in differentiating objects. De-
spite the method’s general application, the amount of
manual labeling work can be terrifying. Similarly in
the unsupervised approaches, the interpretation of the
sky can rely on edge analysis (Laungrungthip et al.,
2008). In this case, the sky can be thought of as
clean regions against the ground, different to previ-
ous assumption that the sky is more blue than the
ground (Laungrungthip, 2008) (Schmitt and Priese,
2009) (Zafarifar and de With, 2006).
AUTOMATIC FACADE IMAGE RECTIFICATION AND EXTRACTION USING LINE SEGMENT FEATURES
105
The removal of the ground from the outdoor scene
is also of interest in automobile navigation. Most lit-
erature in road detection have described using photos
taken from the air (Quartulli and Datcu, 2004) or from
road vehicles in which case the road is in the center of
the image. There are less works on road detection on
static building photos because the ground-level urban
scene is too complex to analyze. Therefore, the de-
tection of road will need more computation-intensive
detection of pedestrians and cars.
The subsequent sections are organized as follows.
Section 2 discusses the line segment features and
its advantage against the conventional edge features.
Section 3 describes the perspective rectification pro-
cedure. Section 4 presents how the facade region
is extracted from backgrounds such as the sky, the
ground and the neighbourhood. Section 5 provides
the results and the conclusion.
2 LINE SEGMENT FEATURES
Line Segment features provide more precise informa-
tion of object geometries on images. In complex ur-
ban scene, where luminance and occlusion can not be
controlled, line segments can reveal the image discon-
tinuity over the object borders with strong confidence
compared to other regional features such as color and
texture. Moreover,the use of specific line segment de-
tection (Grompone von Gioi et al., 2010), has allowed
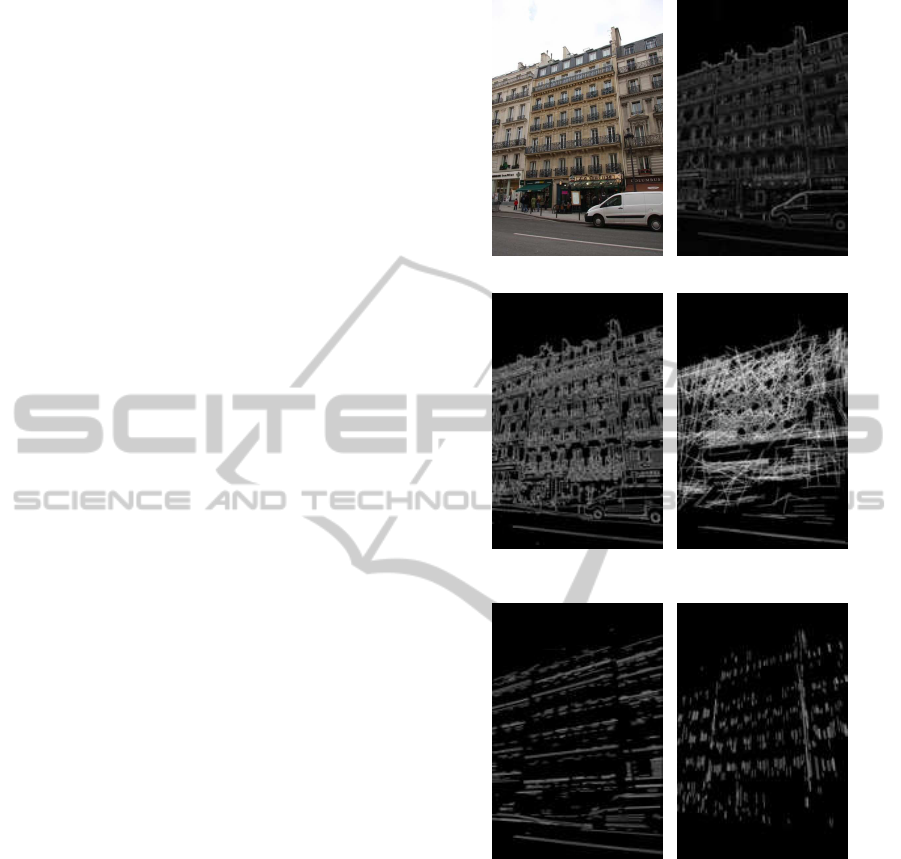
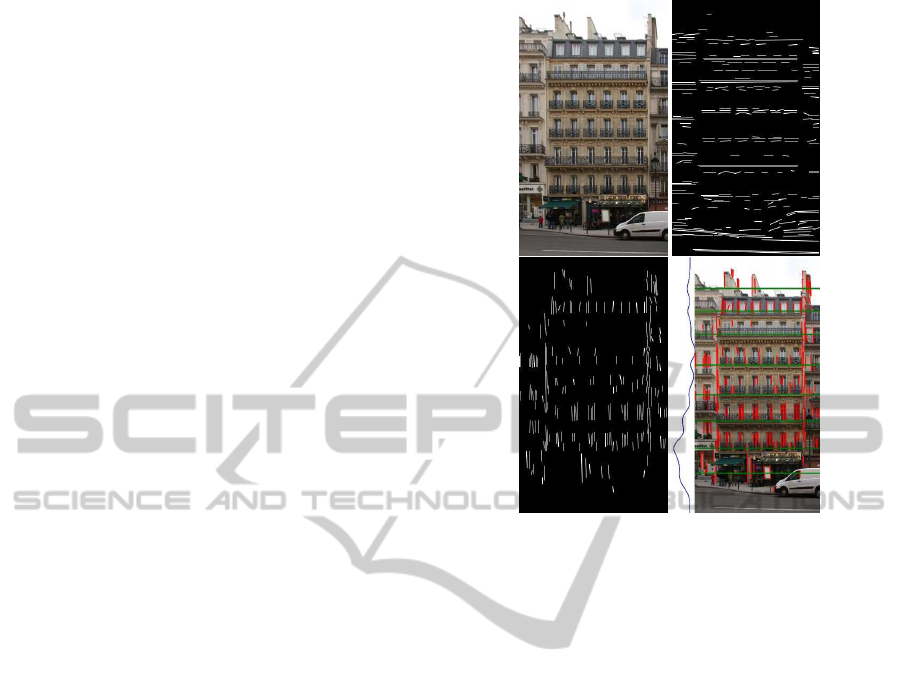
the robust estimation of object geometry. Figure 2
shows the comparison of line segment detection with
other edge detection methods.
Line segments can also be used to discover the
high level structure information of an image. The spa-
tial distributions of line segments can indicate more
clues such as the existence or the discontinuity of rep-
etition and symmetry. Figure 2 clearly shows that, the
separation for floors, tiles and facades can be deter-
mined from horizontal and vertical line segment de-
tections. Furthermore, the orientation of the scene
can also be determined since all the horizontal lines
are converging to the left. This line segments conver-
gence will in turn indicate the location of the vanish-
ing point, which is useful for perspective rectification.
3 PERSPECTIVE
RECTIFICATION
In computer vision, the mapping of object (building
facades) 3D coordinates onto the imager of the cam-
era is a planar homography. Denote the points from
(a) Original image (b) Sobel Detector
(c) Canny Detector (d) Probabilistic Hough Trans-
form
(e) Horizontal line segment de-
tection
(f) Vertical line segment detec-
tion
Figure 2: Edge Detection vs Line Segment Detection.
building facades in the real world as
~
P
w
, and pixels on
images as
~
P
i
, we have the homography as below:
~
P
i
=
h
11
h
12
h
13
h
21
h
22
h
23
h
31
h
32
h
33
~
P
w
(1)
where h
33
is set to 1.0 and
~
P
w
,
~
P
i
are in R
3
,
~
P
w
= [a
w
x
w
,a
w
y
w
,a
w
]
T
, a is scaling factor,
~
P
i
=
[x
i
,y
i
,1.0]
T
. The homography H has eight degrees
of freedom. Therefore, eight equations are needed to
determine all the coefficients. Given four point cor-
VISAPP 2011 - International Conference on Computer Vision Theory and Applications
106
respondences, image points (x
i
k
,y
i
k
). and points in
the real world (x
w
k
,y
w
k
), k = 0,... ,3, H will be deter-
mined.
Provided the vanishing points which we assume
to consist of two points, one is for the horizontal van-
ishing point and the other is for the vertical vanishing
point, it is possible to construct four point correspon-
dences between the real world (the scaling factor a is
set to 1.0) and image.
3.1 Rectification Process
Considering vanishing points configuration as figure
4. VP0 is the horizontal vanishing point and VP1 is
the vertical vanishing point. Then we project lines
from the vanishing points to the image. Subsequently,
they will intersect at four points around the image, A,
B, C and D. In real world, horizontal lines AC and
BD should be parallel, and so do vertical lines AB and
CD.
As a result, if we can wrap the four lines AC, BD,
AB and CD back to the four lines defining the image
frame rectangles, the image will be rectified such that
all lines pointing to the same vanishing points are con-
verted back to be parallel. By applying this 2D wrap-
ping (the Z coordinate in the real world is set to 1.0),
the image is rectified. Considering this wrapping,
the four points correspondences between A, B, C,
D and four image corners, upper left, upper right,
lower left, lower right can be used to determine the
homography matrix.
3.2 Vanishing Points Estimation
The procedure starts from line segment detections.
On the facade image, the horizontal and the vertical
line segments are picked up with proper angle quota
between the line and the image width axis. The hori-
zontal lines should have angles smaller than 45
◦
while
the vertical lines should have angles larger than 45
◦
.
After line segment extraction, the estimation of
vanishing points is done in horizontal and vertical
direction separately but follows the same procedure.
The initial vanishing point estimation is taken by cal-
culating the mean point of intersecting points from
every non-parallel line segments. Next, the Leven-
berg Marquardt optimization is performed to estimate
the optimal vanishing point location by checking how
the vanishing point fits every line segment. However,
due to image distortion, image noise, and line seg-
ment perturbation not pointing to the vanishing points
from non rectangular objects on the facades, the opti-
mization result from line segments is biased. There-
fore, we need to use RANSAC (see Algorithm 1) to
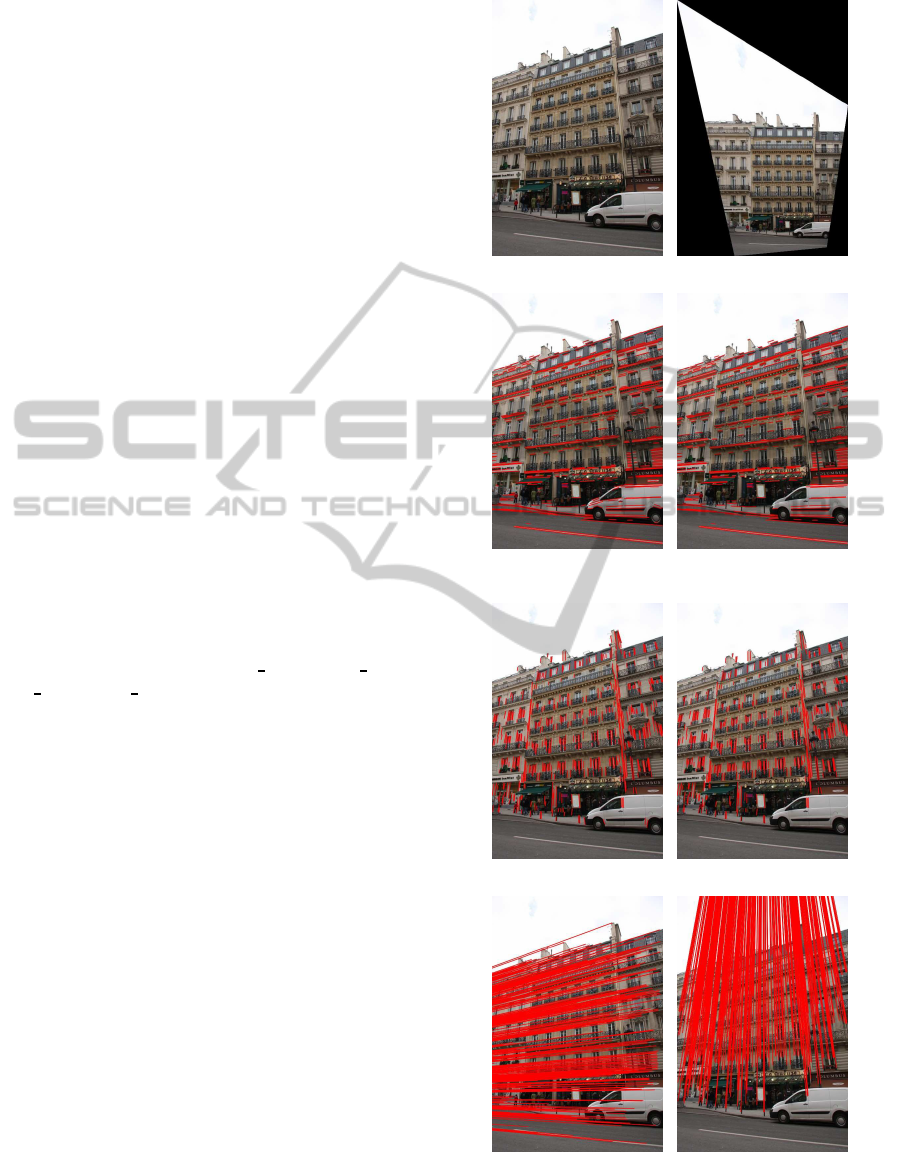
(a) original image (b) rectification result
(c) horizontal line segments (d) horizontal line segment in-
liers
(e) vertical line segments (f) vertical line segment inliers
(g) horizontal lines projection
from vanishing points
(h) vertical lines projection
from vanishing points
Figure 3: Perspective rectification process.
AUTOMATIC FACADE IMAGE RECTIFICATION AND EXTRACTION USING LINE SEGMENT FEATURES
107
A
B
C
D
V P 0
V P 1
Figure 4: One configuration on two vanishing points.
minimize the effect from imperfect line segment sam-
ples. From figure 3(c), 3(d), 3(e) and 3(f), it can be
seen that after RANSAC the number of line segments
is reduced (especially on the roof and the ground floor
near the car).
Algorithm 1: Line segment samples filtering using
RANSAC.
Set number inliers=0, angle std=10e+5
Set angle threshold=10
◦
Set N=1000, p=0.99
for i = 0 to N do
Randomly select half of the line segments
Calculate vanishing point using LM optimiza-
tion
Construct auxiliary line segment from vanishing
point and middle point of the line segment
Calculate the angle between the line segment and
auxiliary line segment for all line segments
if angle<angle threshold then
set it as inlier
end if
Calculate angle standard deviation for all inliers
if (number of inliers > number inliers) k
(number of inliers==number inliers && in-
lier angle std < angle std) then
update inliers
update angle std
end if
Set e = 1− number inliers/total lines
Set N = 1og(1− p)/log(1 − (1− e)
4
)
end for
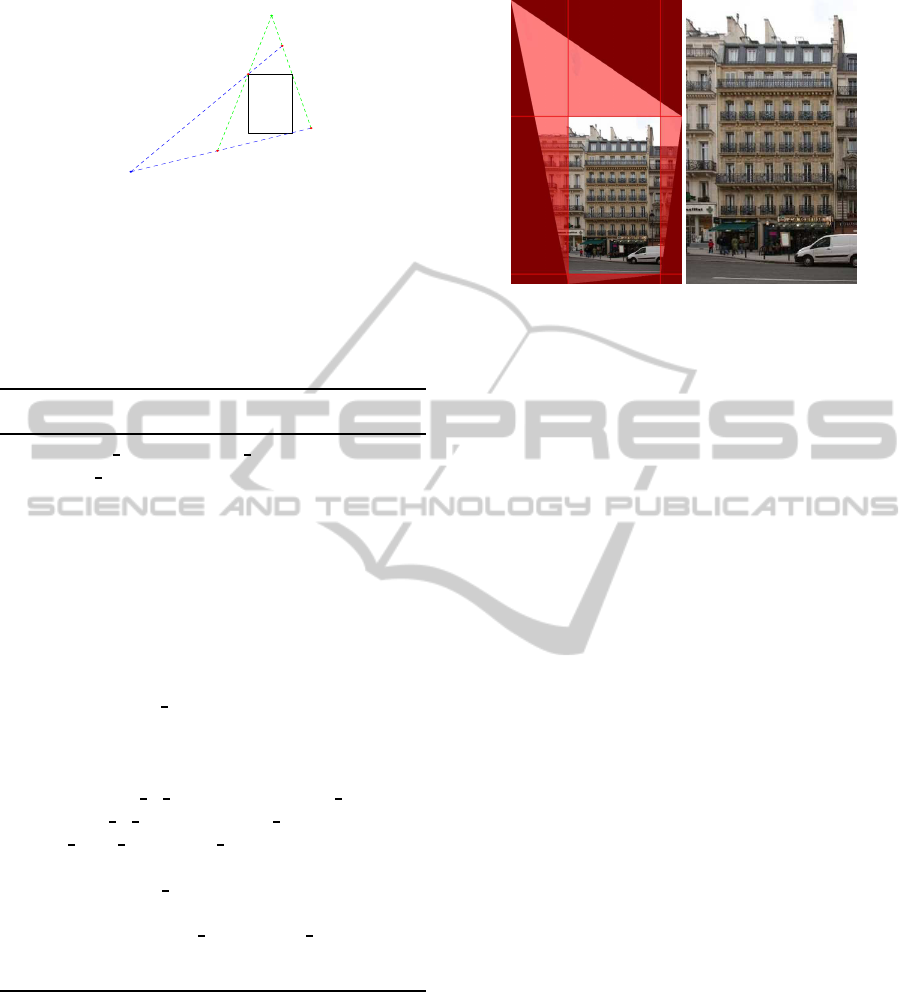
3.3 Region of Interest Extraction
The next step is to extract the region of interest from
the rectified image, which is the central region con-
taining only the facade. (See figure 5) The procedure
involves calculating new positions of four points of
original image corners (upper left, upper right, lower
left and lower right) in the rectified image. Connect-
ing those four points in the rectified image will define
a viewable quadrilateral region which is seen from the
Figure 5: Region of interest extraction.
camera with no black pixel. From those four points,
we can obtain a maximum rectangle inside the quadri-
lateral which is the region of interest.
4 FACADE EXTRACTION
The facade extraction process consists of several
steps. In this process, the sky above, the road under-
neath, and the neighbourhoodbuilding facades will be
removed.
4.1 Sky Removal
4.1.1 Luminance Model
We assume the image can be divided into two parts
based on the luminance distribution. One is bright as
the sky and the other is dark as the facade beneath.
Based on the large number law, the luminance dis-
tribution on the sky area and on the facade area will
follow Gaussian distribution. It could be considered
that every facade has its own unique facade wall dec-
oration scheme, which defines consistent material use
and color painting. Hence, the amount of light re-
flected from the facade wall should be around a mean
value and perturbed with a certain deviation because
the surface of the facade is not flat. Moreover, the sky
could be considered as white regions with deviation
from the soft cloud shades. Under extreme case, the
sky is totally white which will have a mean value of
maximum luminance and zero variance.
The problem of estimating the parameters of finite
Gaussian mixture models has been extensively stud-
ied. We use the Expectation-Maximization method
(Martinez, 2001) for estimating the means and vari-
ations, which is run iteratively. In each iteration, the
mixing coefficients, the means and variances are com-
puted. The iteration stops when it reaches the maxi-
VISAPP 2011 - International Conference on Computer Vision Theory and Applications
108
mum iteration or the error metrics reach the specifica-
tion.
4.1.2 Image Segmentation using MRF
After obtaining two groups of Gaussian parame-
ters, the next step is to segment the image into sky
and non-sky regions. This can be considered as
a binary labeling problem. We define the labeling
cost as using Gaussian distribution density functions
with obtained Gaussian parameters. When we de-
note the sky luminance Gaussian distribution den-
sity function as N(µ
sky
,σ
sky
), and the facade region
luminance Gaussian distribution density function as
N(µ
facade
,σ
facade
), for a pixel with pixel value v, the
cost of labeling it as sky is N(v− µ
sky
,σ
sky
) and the
cost of labeling it as facade is N(v− µ
facade
,σ
facade
),
the optimal labeling is achieved by minimizing the
overall cost over all pixels by using Belief Propaga-
tion (Szeliski et al., 2008) by considering of the spa-
tial consistency in four clique connections (up, down,
left and right).
4.1.3 Skyline Extraction
After getting the binary segmented image, the sky line
needs to be extracted. The first step is to apply mor-
phology operation on the binary image to fill in some
holes. Then the border curve between the sky and
facade is extracted. The final position is fixed by av-
eraging y coordinate of the border curve.
4.2 Road Removal
The road area is usually painted in dark gray, blue, or
red. And it is less textured and decorated with white
lanes. From figure 6, it can be seen that the line seg-
ments on the roads are more likely horizontal while
on the building facades, line segments are both hori-
zontal and vertical. Therefore, it is possible to use the
direction of line segments to detect the road area.
4.2.1 Line Segment Model
We consider that below the road line position, there
are less vertical line segments on the image. To define
horizontal line segment density function along Y axis,
the number of horizontal line segments below each
vertical position is being counted and being divided
by the total horizontal line segments quantity. The
vertical line segment density function is also defined
in this way. Then an object function for finding the
road line can be defined as the ratio of two density
functions in energy form as the shown below.
Figure 6: Horizontal and vertical line segments distribution
for road line hypothesis.
E(y) = E
h
(y)/E
v
(y) (2)
where E
h
(y) is defined as the ratio of the number of
horizontal line segments n
h
(y) below y to the total
number of horizontal line segments N
h
, and E
v
(y) is
defined the ratio of the number of vertical line seg-
ments n
v
(y) below y to the total number of vertical
line segments N
v
.
E
h
(y) = e
n
h
(y)/N
h
E
v
(y) = e
n
v
(y)/N
v
(3)
4.2.2 Line Segment Profiling and Road Line
Extraction
The energy function is evaluated vertically from the
image top to the bottom to construct an energy pro-
file. Then the obtained energy profile could be further
smoothed to remove the small noises. From the pro-
file (Figure 6, the most right image), the energy is
shown to be high on horizontal ledges and on road
line as expected.
The last local maximum on the energy profile
should correspond to the road line because the road
is always on the bottom of the image. The final posi-
tion for the road line is fixed by averaging Y position
from all the horizontal line segments below last local
maximum.
AUTOMATIC FACADE IMAGE RECTIFICATION AND EXTRACTION USING LINE SEGMENT FEATURES
109

4.3 Neighbourhood Removal
The last step is to extract the facades from the neigh-
bourhood on its shoulder. On the image, the defini-
tion of facade vertical border can be quite ambiguous.
Rain water pipe is a weak clue of the vertical separa-
tion under same cases. Here we take a strong assump-
tion on the building layout that horizontal consistency
breaks at building borders which works only in most
Parisian urban areas.
4.3.1 Horizontal Line Segment Distribution
Discontinuity as Symmetry Line and
Facade Border Clues
Windows on facades are repeated horizontally. Con-
sequently, the horizontal edges imposed by window
top borders are also repeated. In the gaps between
the windows horizontal edges, transitional symmetric
lines and facade vertical borders are located. On the
window transitional symmetric lines, the window ar-
rangements on both the left and the right are similar.
On the facade vertical borders, the windows arrange-
ment on the left and on the right are different (asym-
metric). (see Figure 7).
Figure 7: Horizontal line segments distribution.
We extract those gap positions as the hypothesis of
facade separation lines. In order to locate the gaps, the
horizontal line segment image is summed up along Y
axis such that the X profile is obtained. After proper
smoothing on this horizontal line segment profile, the
local minima which correspond to the gaps between
windows are extracted.
Afterwards, at each horizontal position, we mea-
sure the symmetry on its shoulders. We first sum up
the horizontal line segments in a certain region on
each horizontal position’s shoulder along X axis, to
the left and to the right separately to get two Y pro-
files. From two profiles on the left (a) and on the right
(b), we can measure the symmetry. If the position is
considered as an asymmetric line, it will be accepted
as a facade border line. The symmetry measure is de-
fined as follows.
Symmetry =
∑
δ(a
i
b
i
) ∗ |a
i
+ b
i
|
∑
a
i
+
∑
b
i
(4)
∑
δ(a
i
b
i
) ∗ |a
i
+ b
i
| sums the line segments sym-
metric to the separation line hypothesis. If the profiles
are mostly different, there is less chance the line seg-
ments are aligned vertically from left and from right
of the separation line, so less is contributed to the nu-
merator of this symmetry measure. An empirical hard
threshold of 0.5 is used that value no larger than 0.5
will be considered as asymmetric.
4.3.2 Border Line Determination and Facade
Extraction
The borders between facades are extracted based on
the following procedure. If two distinct asymmetric
lines are found on the image border, they are treated
as the facade borders. If one of them is missing or no
asymmetric line is found, vertical line segment profile
along the whole image is checked to pick up a position
where a strong vertical line exists that is longer than
one fourth of the image height. This vertical line is
usually located where the rain water pipe is. If no
strong lines are found, the image border is set to be
the facade border.
5 RESULTS AND CONCLUSIONS
We havesuccessfully applied our proposed method on
all of the Haussmannian facades on the Soufflot Street
in Paris.
We evaluate the rectification and extraction sep-
arately. The rectification is assessed by measuring
mean angle of horizontal line segments and mean ab-
solute difference between angle of vertical line seg-
ments and 90 degree in radians. And the extraction
is evaluated by measuring the ratio of the intersec-
tion area against the union area from automatically
extracted region and a ground truth region done man-
ually. Results on four buildings (No. 11, 12, 19 and
26) are shown in the below table and Figure 8. The
running time for rectification and segmentation is re-
lated to the number of line segments detected in im-
ages and also the image size. For a typical facade im-
age in 518×778, it takes less than 2 minutes for rec-
tification and extraction on a machine with 2.5GHz
Dual-core processer and 2G RAM.
The main contributions of this paper are twofolds.
One is we have proved that properly modeling of the
VISAPP 2011 - International Conference on Computer Vision Theory and Applications
110
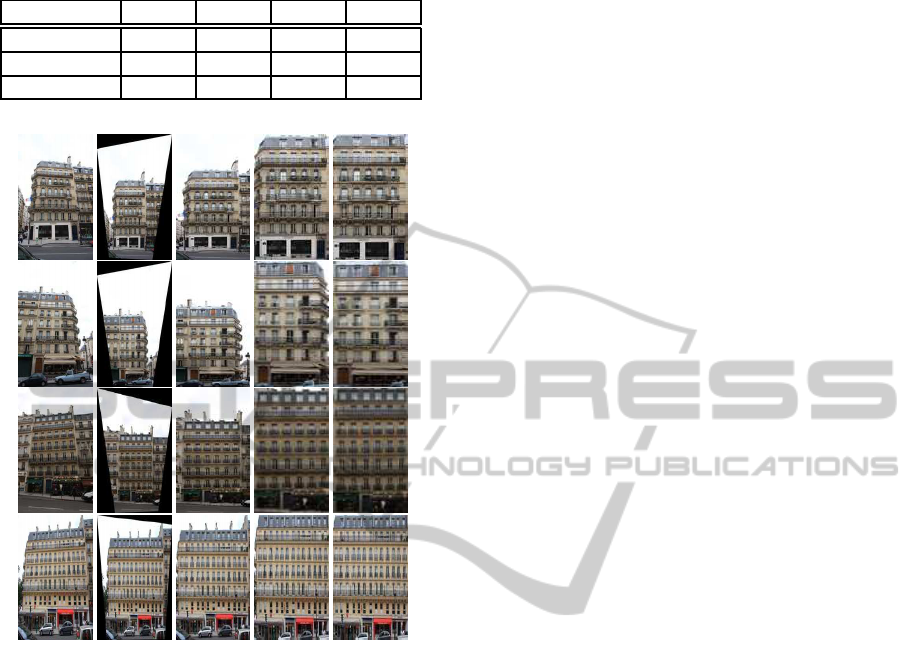
Table 1: Error metrics.
b11 b12 b19 b26
Angle
h
0.045 0.046 0.037 0.044
Angle
v
0.035 0.037 0.041 0.048
Overlapping 85.43% 83.04% 92.78% 95.00%
Figure 8: Results on Soufflot Street Facades. Left to right,
original, rectified, cropped, final and ground truth.
distribution of line segments will help the interpreta-
tion of the scene. The second contribution is that we
presented fast efficient methods of rectification and
segmentation process which require less human inter-
actions, and proved to be useful for many urban mod-
eling and urbanism applications as well.
One of the limitations of our current method, how-
ever, is that it is scale sensitive. Another limitation
is in the road detection which still depends on the as-
sumption that the road should be rather clean with less
occlusion from cars.
REFERENCES
Grompone von Gioi, R., Jakubowicz, J., Morel, J. M., and
Randall, G. (2010). LSD: A Fast Line Segment De-
tector with a False Detection Control. IEEE Trans-
actions on Pattern Analysis and Machine Intelligence,
32(4):722–732.
Hoiem, D., Efros, A. A., and Hebert, M. (2005). Geometric
context from a single image. In International Confer-
ence of Computer Vision (ICCV), volume 1, pages 654
– 661. IEEE.
Kalantaria, M., Jung, F., Paparoditis, N., and Guedon, J.
(2008). Robust and automatic vanishing points detec-
tion with their uncertainties from a single uncalibrated
image, by planes extraction on the unit sphere. In IS-
PRS08, page B3a: 203 ff.
Laungrungthip, N. (2008). Sky detection in images for solar
exposure prediction.
Laungrungthip, N., McKinnon, A., Churcher, C., and
Unsworth, K. (2008). Edge-based detection of sky
regions in images for solar exposure prediction. In
IVCNZ08, pages 1–6.
Liebowitz, D. and Zisserman, A. (1998). Metric rectifica-
tion for perspective images of planes. In Proceed-
ings of the IEEE Computer Society Conference on
Computer Vision and Pattern Recognition, CVPR ’98,
pages 482–, Washington, DC, USA. IEEE Computer
Society.
Martinez, W. (2001). Computational Statistics Handbook
with Matlab. CRC Press, Boca Raton.
Matas, J., Galambos, C., and Kittler, J. (1998). Progressive
probabilistic hough transform.
Quartulli, M. and Datcu, M. (2004). Stochastic Geometri-
cal Modeling for Built-Up Area Understanding From
a Single SAR Intensity Image With Meter Resolution.
IEEE Transactions on Geoscience and Remote Sens-
ing, 42:1996–2003.
Schmitt, F. and Priese, L. (2009). Sky detection in csc-
segmented color images. In VISAPP (2), pages 101–
106.
Szeliski, R., Zabih, R., Scharstein, D., Veksler, O., Kol-
mogorov, V., Agarwala, A., Tappen, M., and Rother,
C. (2008). A comparative study of energy min-
imization methods for markov random fields with
smoothness-based priors. IEEE Trans. Pattern Anal.
Mach. Intell., 30:1068–1080.
Zafarifar, B. and de With, P. (2006). Blue Sky Detection for
Picture Quality Enhancement. pages 522–532.
AUTOMATIC FACADE IMAGE RECTIFICATION AND EXTRACTION USING LINE SEGMENT FEATURES
111
