
CREATING AUDIENCE SPECIFIC GALACTIC SIMULATIONS
USING EYE-TRACKING TECHNOLOGY
Janelle Arita
Department of Computer Science, Depauw University, 313 S. Locust Street, Greencastle, Indiana, U.S.A.
Jenniffer Feliz
Department of Computer Science, Fordham University, 113 West 60th Street, New York City, New York, U.S.A.
Dennis Rodriguez, Hans-Peter Bischof, Manjeet Rege, Reynold Bailey
Department of Computer Science, Rochester Institute of Technology, 1 Lomb Memorial Drive, Rochester, New York, U.S.A.
Keywords:
Perception, Eye-tracking, Data visualization, Galactic images.
Abstract:
This study uses eye-tracking to investigate the differences in the way professional astrophysicists and novices
observe simulations of galactic events. The results of this study provide insight into which aspects of the data
are important and allow us to tailor the visualizations for a specific group. We hypothesized that the gaze
patterns of professionals and novices would vary considerably. A user study was performed on two groups:
trained astrophysicists and novices. Each group was presented with a randomized sequence of images and a
video while their gaze patterns were recorded with an eye-tracker. We discovered that although both groups
observed each image for the same duration, experts limited their fixations to a smaller area. Novices, on the
other hand, had fixations which were spread across the images. For the video, the astrophysicists were more
focused on simulations in which most of the data was visible and the camera angles had minimal axis change.
1 INTRODUCTION
Data visualization techniques allow us to better un-
derstand large multidimensional data and often re-
veal details that would generally be overlooked. The
Center for Computational Relativity and Gravitation
(CCRG) at Rochester Institute of Technology aims to
further our understanding of astrophysical phenom-
ena through the use of mathematical modeling, super-
computing and data visualization (Rochester Institute
of Technology, 2010). The faculty at CCRG have de-
veloped an extensible and robust visualization system
named Spiegel. Spiegel is highly versatile and capa-
ble of visualizing large amounts of multidimensional
data, which allows for the analysis of the data in both
time and space (Bischof, 2010). The Spiegel sytem
has been shown to be useful for a wide range of visu-
alization applications (Bischof et al., 2006) and sev-
eral images generated by Spiegel have been featured
in documentaries about black holes (A&E Television
Networks, 2010).
From a visualization perspective, it is crucial to un-
derstand whether the simulations created are scientif-
ically meaningful and relevant to the professionals in
the field. In this paper, we present an eye-tracking
study that investigates the differences in the way that
experts and novices look at galactic simulations. By
extracting fixations from the eye-tracking data, we
are able to determine the areas of interest in the data
for each group. Understanding what aspects of the
data the astrophysicists consider important allows for
the creation of customized simulations which will be
more relevant to professionals. The benefit of captur-
ing eye movement data, as opposed to simply asking
what viewers are paying attention to, is that people
are often not aware of their own behavioral strate-
gies (Eger et al., 2007). With eye-tracking data, vis-
ibility, meaningfulness, and placement can be objec-
tively evaluated and the findings can be used to im-
prove design (Goldberg and Kotval, 1999).
We hypothesized that experts would look at the
simulations very differently than novices. It is prob-
218
Arita J., Feliz J., Rodriguez D., Bischof H., Rege M. and Bailey R..
CREATING AUDIENCE SPECIFIC GALACTIC SIMULATIONS USING EYE-TRACKING TECHNOLOGY.
DOI: 10.5220/0003321402180223
In Proceedings of the International Conference on Imaging Theory and Applications and International Conference on Information Visualization Theory
and Applications (IVAPP-2011), pages 218-223
ISBN: 978-989-8425-46-1
Copyright
c
2011 SCITEPRESS (Science and Technology Publications, Lda.)
able that novices will focus more on visually appeal-
ing parts of the simulation or image, while experts
will focus on areas that they find more important be-
cause of their advanced knowledge. In order to inves-
tigate this, our participants were presented with im-
agery from the Hubble Space Telescope (Space Tele-
scope Science Institute, 2010) as well as images and
a video generated by the Spiegel system.
2 RELATED WORK
Eye-tracking systems first emerged in the early
1900s (Dodge and Cline, 1901). More recently, eye-
tracking has been used within a variety of contexts
including aviation, driving, market research, psychol-
ogy, and design (Goldberg and Kotval, 1999). Eye-
trackers have also been used for human-computer in-
teraction (Hutchinson et al., 1989), interactive graph-
ics applications (Luebke et al., 2002; Levoy and
Whitaker, 1990; O’Sullivan et al., 2003), and large
scale display systems (Baudisch et al., 2003).
Researchers have investigated eye movements of
novices and experts in different scenarios including
surgeons performing aiming tasks on a laparoscopic
surgery simulator (Law et al., 2004). A method has
also been presented for improving visualization sys-
tems by using eye-tracking to determine what regions
of the data viewers considered to be important (Lu
et al., 2010). Based on this information, reason-
able rendering parameters were computed and the in-
teractivity of the visualization system improved sig-
nificantly. Grindinger and Duchowski automatically
classified novice and expert pilots by analyzing their
gaze patterns (Grindinger et al., 2010). The aim of
our study is to build on the existing novice versus ex-
pert research, and to obtain the advantages that eye-
tracking can offer for improving data visualization.
3 EXPERIMENTAL DESIGN
3.1 Apparatus
A Mirametrix S1 eye-tracker operating at 60 Hz with
gaze position accuracy less than 1 degree was used.
The eye-tracker uses infrared illumination and an in-
frared camera to record video of the observer’s eyes.
The video is analyzed to locate the corneal reflection
and pupil center and this information is used to de-
termine the location on the screen where the observer
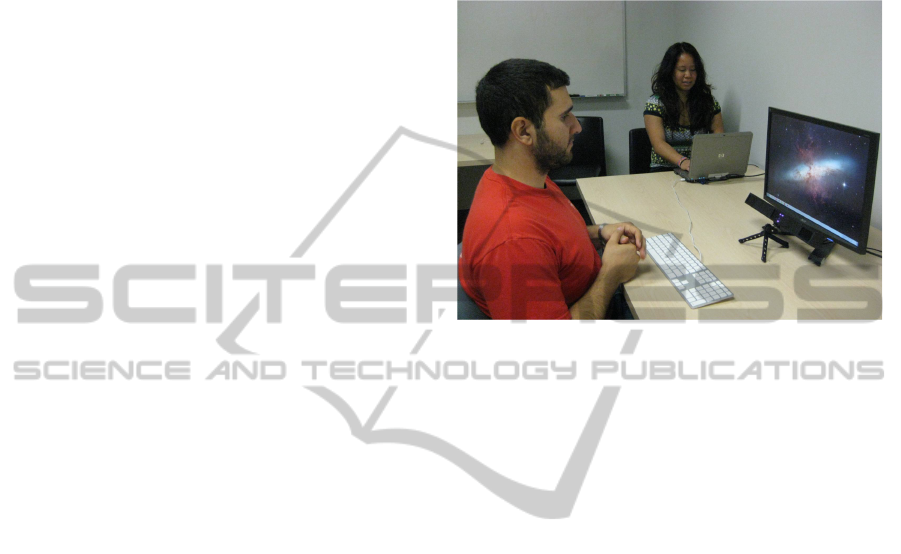
is looking (Poole and Ball, 2005). Stimuli were pre-
sented on a 20 inch LCD monitor with a resolution
of 1680x1050. Figure 1 shows a photograph of the
experiment setup. The stimuli consisted of sixteen
images (10 from Hubble Space Telescope, 6 from
Spiegel) as well as a video generated using Spiegel.
The images used are shown in Figure 2.
Figure 1: Experimental setup.
3.2 Participants
Twenty participants between the ages of 18 to 36 vol-
unteered for this study. All participants were screened
for impairments in visual acuity and color vision. Par-
ticipants were separated into two groups - novices and
experts, based on their knowledge of astrophysics.
Sixteen participants were grouped into the novice cat-
egory while 4 were grouped as experts.
• Expert Group. Participants were selected for the
expert group if they held at least a Masters degree
in astrophysics. The selection of participants in
the expert group was limited due to the criteria of
knowledge on astrophysics. There were 4 male
participants with an average age of 34. Partici-
pants in this group were asked to rate their knowl-
edge of astrophysics on a scale from 1 to 10 with
10 being the highest. The average rating was 7.25.
• Novice Group. Participants were selected for the
novice group if they had little or no knowledge
about astrophysics. Knowledge was determined
based on participants’ prior courses and hobbies.
There were 10 females, and 7 males with an av-
erage age of 21. The average rating of knowledge
on astrophysics for the novice group was 2.58.
3.3 Procedure
The user study took place in a controlled room with
moderate lighting. Each participant was seated ap-
proximately 20 inches in front of the screen and po-
sitioned such that both pupils were clearly identified
CREATING AUDIENCE SPECIFIC GALACTIC SIMULATIONS USING EYE-TRACKING TECHNOLOGY
219
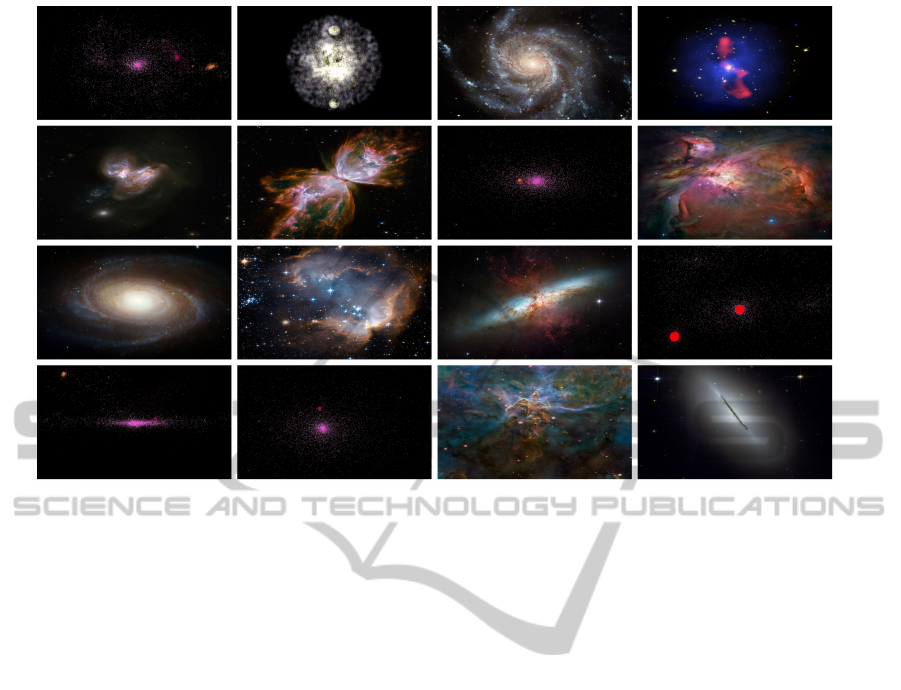
Figure 2: The 16 images that were shown as stimuli for the first phase of the study.
by the eye-tracker. Participants were asked to mini-
mize head movement during the experiment to ensure
accurate eye tracking.
The participants were asked to view a randomized
sequence of the sixteen images followed by the video.
They were instructed to rate the quality of each image
on a scale from 1 to 10 with 10 being the highest.
Following each image, a blank screen was displayed
for 3 seconds. While the blank screen was being dis-
played, the participants verbally expressed their rating
for the image they just viewed. The participants were
not given a definition of quality. Instead it was left
up to them to formulate their own notion of quality.
The purpose of the ratings was to help the participant
focus on the areas of the visuals which they consid-
ered most appealing. The complete set of instructions
read verbatim to each participant can be found in Ap-
pendix A. Eye-tracking data collected from each par-
ticipant was saved into an XML file. Each XML file
contained the following data: time elapsed, location
of fixation for both left and right eye, fixation dura-
tion, fixation ID, and file name of the image or video
being displayed. Testing for each participant, includ-
ing calibration, and vision and color tests, lasted ap-
proximately 10 minutes.
4 RESULTS AND DISCUSSION
4.1 Images
4.1.1 Percentage of Fixation Duration
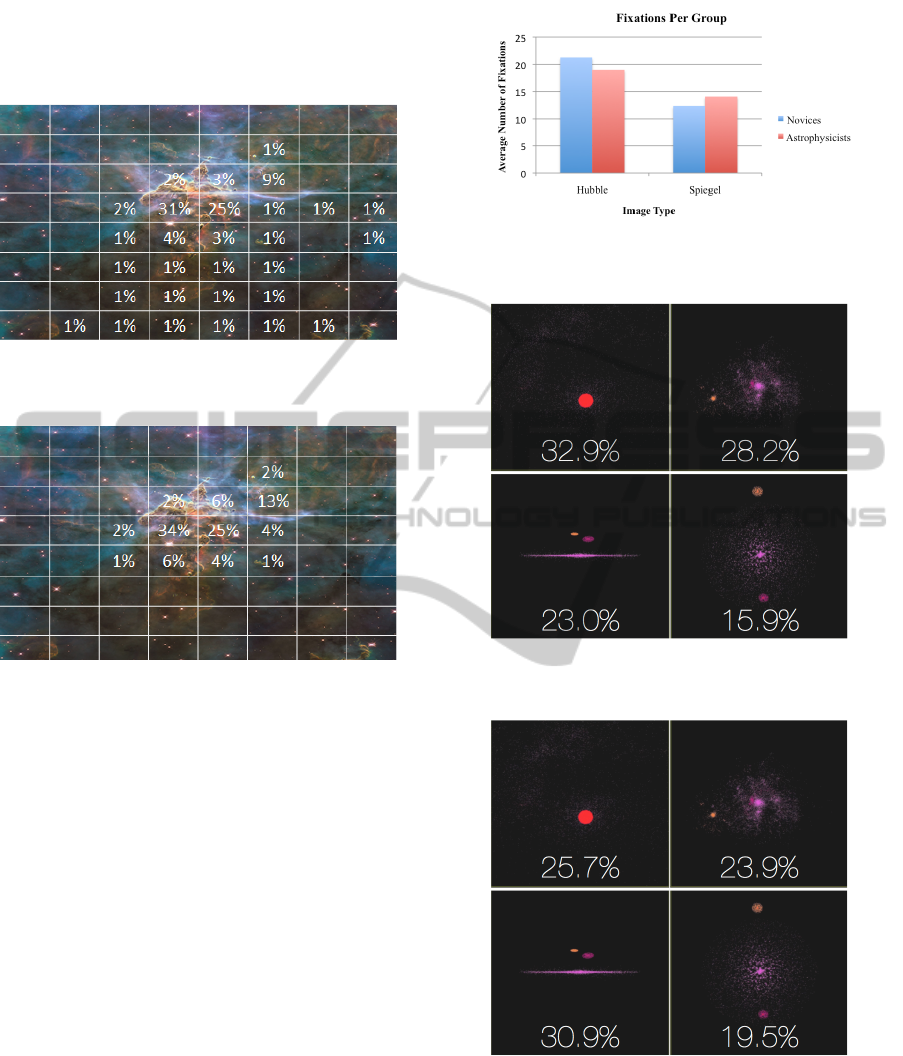
To determine if the gaze patterns for the novices and
experts were different, we divided each image into an
8 x 8 grid and compared the number of fixations in
corresponding grid cells for the experts and novices.
Figure 3 shows the average fixation distribution for
the group of novices for one of the images in the test
set. Figure 4 shows the average fixation distribution
for the group of experts for the same image. Notice
that the gaze pattern for the novices tends to be more
spread out while the gaze pattern for the experts is
more focused. A similar trend was observed for all
of the images in the experiment. Although the gaze
patterns for the experts tended to be more focused
while the gaze patterns for the novices tended to be
more spread out, there was still a strong correlation
between the two groups. The Pearson coefficient of
correlation between experts and novices for all six-
teen images was r = 0.8763. This suggests that both
groups still spent the majority of time attending to the
same salient features and likewise ignoring the same
non-salient features. This supports the findings from
previous studies which show that our focus is natu-
rally drawn to regions of bright saturated colors, high
IVAPP 2011 - International Conference on Information Visualization Theory and Applications
220
edge density, high local contrast, and informative re-
gions of an image (Mackworth and Morandi, 1967;
Mannan et al., 1996; Parkhurst and Niebur, 2003).
Figure 3: Average fixation time for novices for one image
from the test set.
Figure 4: Average fixation time for experts for one image
from the test set.
4.1.2 Number of Fixations
The average number of fixations per image was also
calculated for both groups (see Figure 5). More fixa-
tions per image may be an indicator or higher interest
or focus or the result of a rapid visual search (Gold-
berg and Kotval, 1999). The number of fixations
for the Hubble images tended to be higher than the
number of fixations for the Spiegel images. This is
likely due to the fact that the Hubble photographs had
richer content across the entire image compared to
the Spiegel images. We also observed that there was
a strong correlation between the number of fixations
and the average quality rating. In particular, a larger
number of fixations tended to result in a higher quality
rating. The Pearson coefficient of correlation between
image ratings and the number of fixations for experts
was r = 0.7965 and for novices it was r = 0.8750.
4.2 Video
One of the problems that is often faced when creat-
ing visualizations is determining the best path that the
Figure 5: Average number of fixations for novices and ex-
perts.
Figure 6: Percentage of fixation time spent in each quadrant
of the video for the novices.
Figure 7: Percentage of fixation time spent in each quadrant
of the video for the experts.
camera takes through the data. Although very little
work has been done on interpreting eye-tracking data
of dynamic stimuli we believe that it holds great po-
tential for aiding the design process. In the second
phase of our study, we displayed a video to the par-
ticipants. The video was divided into four quadrants,
CREATING AUDIENCE SPECIFIC GALACTIC SIMULATIONS USING EYE-TRACKING TECHNOLOGY
221
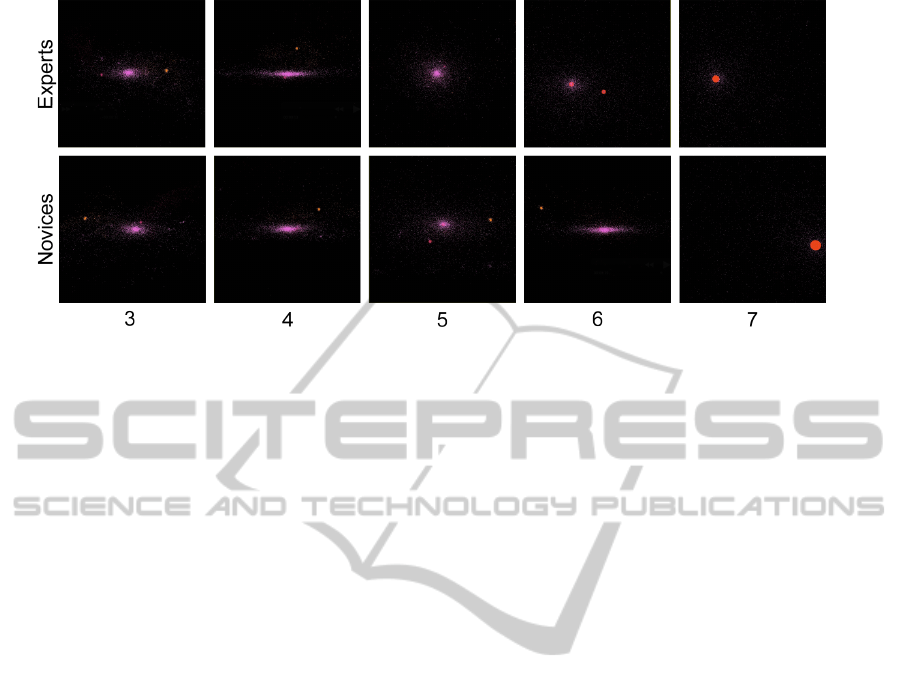
Figure 8: Screen shot of preferred flight path for segments 3 to 7.
each showing a different flight path through the same
data. The video in each quadrant was synchronized so
that each event in the simulation occurred at the same
time from different perspectives.
By displaying four flight paths at once, we deter-
mined which flight path was attended to most often by
the two groups of participants. We determined this by
calculating the fixation duration for each flight path
for each group. The flight path that contained the most
fixation duration was the flight path that was most ob-
served. Using this approach, we determined that the
experts spent more time looking at the flight path in
the lower left quadrant, while the novices preferred
the flight path in the top left. See Figures 6 and 7.
This observation by itself is not very useful unless
we take it one step further and analyze which of the
four quadrants was attended to at specific stages of
playback. To accomplish this, we divided the video
into 14 segments, each segment spanning 3 seconds in
length. By analyzing the video in smaller segments,
we distinguished which flight path a participant fix-
ated on at specific times. For example, Figure 8 shows
a screen shot of the preferred flight path for segments
3 to 7. We recreated an optimal audience specific
video for each group by merging the preferred flight
path segments into a single video.
5 CONCLUSIONS AND FUTURE
WORK
We have presented an experiment which used eye-
tracking to compare the gaze patterns of novices and
expert astrophysicists while looking at various im-
ages and simulations of galactic events. We noted
that although experts and novices both focus on sim-
ilar salient regions of an image and ignore similar
non-salient regions that the novices’ gaze tended to
be more spread out while the experts’ gaze tended
to be restricted to fewer regions of the image. For
the video, it was observed that the professional group
was more focused on simulations in which most of the
data was visible and the camera angles had minimal
axis change. These results provide valuable insight
that will be used for designing more relevant, audi-
ence specific visualizations.
Future work includes improvement of the simu-
lation video by creating smoother camera transitions
between segments. Instead of manually creating a
simulation by merging segments, we can recreate the
entire video by simulating the preferred camera flight
path through the Spiegel simulation software. Ideally
we would like to completely automate this process to
allow the user to view several flight paths and have the
system dynamically create the final simulation video
based on the viewer’s gaze preferences. In order to
accomplish this, it will be necessary to interface the
eye-tracker with the simulation software.
REFERENCES
A&E Television Networks (2010). Cosmic holes: The
History Channel. http://www.history.com/shows/the-
universe/episodes/season-2.
Baudisch, P., DeCarlo, D., Duchowski, A., and Geisler, W.
(2003). Focusing on the essential: considering atten-
tion in display design. Commun. ACM, 46(3):60–66.
Bischof, H.-P. (2010). The Spiegel Project.
http://spiegel.cs.rit.edu/∼hpb/grapecluster/Spiegel/
index.html.
Bischof, H.-P., Dale, E., and Peterson, T. (2006). Spiegel - a
visualization framework for large and small scale sys-
tems. In In MSV 06: Proceedings of the 2006 Interna-
tional Conference of Modeling Simulation and Visual-
ization Methods.
IVAPP 2011 - International Conference on Information Visualization Theory and Applications
222

Dodge, R. and Cline, T. S. (1901). The angle velocity of
eye movements. Psychological Review, 8:145–157.
Eger, N., Ball, L. J., Stevens, R., and Dodd, J. (2007).
Cueing retrospective verbal reports in usability testing
through eye-movement replay. In BCS-HCI ’07: Pro-
ceedings of the 21st British HCI Group Annual Con-
ference on People and Computers, pages 129–137,
Swinton, UK, UK. British Computer Society.
Goldberg, J. H. and Kotval, X. P. (1999). Computer inter-
face evaluation using eye movements: methods and
constructs. International Journal of Industrial Er-
gonomics, 24(6):631 – 645.
Grindinger, T., Duchowski, A. T., and Sawyer, M. (2010).
Group-wise similarity and classification of aggregate
scanpaths. In ETRA ’10: Proceedings of the 2010
Symposium on Eye-Tracking Research & Appli-
cations, pages 101–104, New York, NY, USA. ACM.
Hutchinson, T. E., White, K. P., Martin, W. N., Reichert,
K. C., and Frey, L. A. (1989). Human-computer in-
teraction using eye-gaze input. Systems, Man and Cy-
bernetics, IEEE Transactions on, 19(6):1527–1534.
Law, B., Atkins, M. S., Kirkpatrick, A. E., and Lomax,
A. J. (2004). Eye gaze patterns differentiate novice
and experts in a virtual laparoscopic surgery training
environment. In ETRA ’04: Proceedings of the 2004
symposium on Eye tracking research & applications,
pages 41–48, New York, NY, USA. ACM.
Levoy, M. and Whitaker, R. (1990). Gaze-directed volume
rendering. SIGGRAPH Comput. Graph., 24(2):217–
223.
Lu, A., Maciejewski, R., and Ebert, D. S. (2010). Volume
composition and evaluation using eye-tracking data.
ACM Trans. Appl. Percept., 7(1):1–20.
Luebke, D., Watson, B., Cohen, J. D., Reddy, M., and
Varshney, A. (2002). Level of Detail for 3D Graph-
ics. Elsevier Science Inc., New York, NY, USA.
Mackworth, N. H. and Morandi, A. J. (1967). The gaze
selects informative details within pictures. Perception
and Psychophysics, 2:547–552.
Mannan, S. K., Ruddock, K. H., and Wooding, D. S. (1996).
The relationship between the locations of spatial fea-
tures and those of fixations made during visual exam-
ination of briefly presented images. Spatial Vision,
10:165–188.
O’Sullivan, C., Dingliana, J., and Howlett, S. (2003). Eye-
movements and interactive graphics. The Mind’s
Eyes: Cognitive and Applied Aspects of Eye Move-
ment Research, pages 555–571. J. Hyona, R. Radach,
and H. Deubel (Eds.).
Parkhurst, D. and Niebur, E. (2003). Scene content selected
by active vision. Spatial Vision, 16:125–154.
Poole, A. and Ball, L. J. (2005). Eye tracking in human-
computer interaction and usability research: Current
status and future. In Prospects, Chapter in C. Ghaoui
(Ed.): Encyclopedia of Human-Computer Interaction.
Pennsylvania: Idea Group, Inc.
Rochester Institute of Technology (2010). Cen-
ter for Computatonal Relativity and Gravitation.
http://ccrg.rit.edu/.
Space Telescope Science Institute (2010). Hubblesite.
http://hubblesite.org.
APPENDIX
Instructions to Participants. In addition to the fol-
lowing instructions, which were read to the partic-
ipants at the start of the study, participants were
also given documentation showing that the study was
reviewed and approved by the Institutional Review
Board (IRB) at the institution where this study was
conducted.
The purpose of this study is to gain a better
understanding of how humans look at images
of galactic events.
You will be shown a sequence of images
and a video. Your task will be to evaluate the
quality of each image and video by assigning
a rating from 1 to 10 with 1 being the low-
est quality and 10 being the highest. Please
state your rating when the blank screen be-
tween images is displayed. The images that
you will be viewing consist of several images
from the Hubble Space Telescope as well as
computer generated images. You will also see
a computer generated video.
During the course of the experiment, a
noninvasive camera will be used to record
your eye movements. Please try to minimize
your head movements as this may adversely
affect the quality of the results. A short cal-
ibration process is necessary to ensure that
your eyes are being accurately tracked. This
will occur at the start of the experiment. Cal-
ibration simply involves looking at the targets
on the screen until they disappear. The entire
experiment should take no longer than 10 min-
utes to complete.
The results of this study may be pub-
lished in scientific research journals or pre-
sented at professional conferences. However,
your name and identity will not be revealed
and your record will remain anonymous. Your
name will not be used in any data collection,
so it will be impossible to tell your answers
from other peoples answers.
The potential benefits of this study to so-
ciety include improvements in data visualiza-
tion techniques and the advancement of scien-
tific knowledge of human visual perception.
Participation is entirely voluntary. Addition-
ally, you may choose to withdraw from this
study at any time. If you decide not to par-
ticipate or to withdraw from this study, there
will not be a penalty to you. Do you have any
questions before we begin?
CREATING AUDIENCE SPECIFIC GALACTIC SIMULATIONS USING EYE-TRACKING TECHNOLOGY
223
