
KNOVA: INTRODUCING A REFERENCE MODEL FOR
KNOWLEDGE-BASED VISUAL ANALYTICS
Stefan Fl
¨
oring
OFFIS Institute for Computer Science, Oldenburg, Germany
H.-J
¨
urgen Appelrath
Department for Database Systems, University of Oldenburg, Oldenburg, Germany
Keywords:
Analytical reasoning, Data management and knowledge representation, Interface and interaction techniques
for visualization, Knowledge-assisted visualization.
Abstract:
When creating interactive applications for data exploration three major challenges can be identified: The
integration of heterogeneous data sources at runtime, the integration of suitable visualization methods and the
availability of interaction methods which enable domain experts to (implicitly) apply their expert knowledge in
the knowledge driven exploration process. To address these challenges we introduce the KnoVA (Knowledge-
Based Visual Analytics) reference model, which allows for generating a description of visualization methods,
interaction methods and data sources. We then outline how this model can be useful to create knowledge based
visual analytics systems in a model driven software development process.
1 INTRODUCTION
In public health, especially in the field of population-
based epidemiology, data analysis has early been
identified as important. As an example, the Epidemi-
ological Cancer Registry Lower Saxony (Germany)
(EKN) by now holds nearly two million data sets
about cancerous diseases. These data sets are hier-
archically structured (patients, indications, tumor in-
dications) and modeled highly dimensional. Periodi-
cally the data collected at the cancer registry is inte-
grated into a data-warehouse system and out of this
data-warehouse pre-defined reports are being gener-
ated (Meister et al., 2003).
Working closely with domain experts at the EKN,
we have distinguished an increasing demand for ex-
plorative analysis and for a more dynamic and inter-
active ”ad-hoc” approach to the analysis than today’s
tools offer, in order to gain insight in diseases and
possible influence factors. The idea is to visualize
the collected data and then mingle data from other
sources into the visualizations. For example the av-
erage amount of certain tumor indications per region
could be visualized on a thematic map, to possibly
find regions with atypical high or low rates. Then
data from other sources could be integrated interac-
tively in the analysis process to find correlations of
possible influence factors. (Fl
¨
oring and Hesselmann,
2010).
2 MOTIVATION
Based upon this idea and upon feedback we received
from the users at the EKN, we identified three impor-
tant key factors that influence the effectiveness of vi-
sual analytics applications in the epidemiological do-
main. Firstly the suitable information to approach a
certain analysis question has to be available. In the
example mentioned earlier, next to the epidemiolog-
ical data it is vital to have the ability to integrate ad-
ditional data sources, such as data about possible in-
fluence factors. Secondly the analysis tools must pro-
vide suitable graphical representations to visualize the
data. In typical analysis tasks the analysts will use
various visualizations at once, each of which is best
suitable for a specific kind of data. For the geograph-
ically spread tumor indications thematic maps might
be the best choice, while for timely oriented data ani-
mated scatter plots might be advantageous. The third
influence factor is expert knowledge. The choice of
the right combination of data and suitable visualiza-
230
Flöring S. and Appelrath H..
KNOVA: INTRODUCING A REFERENCE MODEL FOR KNOWLEDGE-BASED VISUAL ANALYTICS.
DOI: 10.5220/0003325402300235
In Proceedings of the International Conference on Imaging Theory and Applications and International Conference on Information Visualization Theory
and Applications (IVAPP-2011), pages 230-235
ISBN: 978-989-8425-46-1
Copyright
c
2011 SCITEPRESS (Science and Technology Publications, Lda.)

tions as well as the manipulation of data during the ex-
plorative process are usually done by domain experts
(in our example epidemiologists) based upon their do-
main knowledge. According to these three key factors
we identified three major challenges to be addressed
in order to design interactive explorative data analysis
tools:
Data Integration. The challenge in combining mul-
tiple data sources is to create a suitable mapping
that allows for identification of similar entities
across these data sources. An example is the in-
tegration of geo-spatial epidemiological data with
geo-spatial census data, aiming at normalization
between areas with a very high and areas with a
low population density. In this scenario a trans-
formation of possibly different geographic repre-
sentations (e.g. postcodes or Gauss-Krueger coor-
dinates) can be necessary and thus a transforma-
tion between the different representations has to
be accomplished.
Visualization Integration. Likewise it is often not
sufficient to only provide a single visualization
method for a certain analysis task. Multiple vi-
sualization methods have to be integrated into the
system so data can be linked across views and
viewed from different perspectives and on differ-
ent detail levels on co-located views. The chal-
lenge here is to create a mapping between the
data format of the visualization and the data for-
mat of the actual data. This is more challenging
in dynamical systems with multiple data sources,
which not necessarily share the same data model.
Application of Expert Knowledge. Any decisions
in the analysis process, e.g. which data sources to
integrate, which visualizations to use and which
operations on the data to perform, depend on do-
main expert knowledge. In the epidemiological
example only a medically and statistically trained
epidemiologist can make the right decision of
whether population figures have to be normalized
or which additional data-sources can sense-fully
be integrated to create valuable new insight. It is
therefore necessary to provide reasonable means
of interaction, suitable for domain experts to use.
The challenge here is to find appropriate abstrac-
tions to prevent the must of having knowledge of
the underlying data manipulation operations (such
as SQL or OLAP) and which allow for a transla-
tion and disposition of the operations throughout
integrated data sources and across linked and co-
located views.
To deal with these three challenges, we propose the
use of a reference model for visual analytics applica-
tions and the analysis process as the basis of a model
driven software development process.
3 RELATED WORK
There have been several pervious efforts to create
models for visualization and analytics applications. In
(Tang et al., 2004) the usage of the relational model is
proposed. One shortcoming of the relational model is,
that it is data centric and the model itself does not sup-
port the creation of suitable visual mappings. Haber
and McNabb introduce a data-flow model to deal with
this problem (Haber and McNabb, 1990). The sys-
tem DataMeadow (Elmqvist et al., 2008) uses a sim-
ilar data-flow model to aid the user during the explo-
ration process by visually presenting the transforma-
tion pipeline. In a data-flow model the visual map-
ping is defined as a pipeline where each node in the
pipeline is a defining a data transformation. In oppo-
sition to this data-state models define sates and tran-
sitions and each transition can be seen as a data trans-
formation. Lark (Tobias et al., 2009) is based on the
data-state model. This system is aimed at coordinated
interaction for InfoVis systems on distributed work-
stations. In (Chi, 2002) is shown that data-state mod-
els and data-flow models are equally powerful and can
be transformed into the respective counterpart.
Classifications of visualization methods has been
approached from different viewpoints: data centric
(Chuah et al., 1995), task/goal centric (Wehrend and
Lewis, 1990) and (Valiati et al., 2006) and based upon
stages (Pfitzner et al., 2003). In addition to that there
were efforts to combine different viewpoints (Wenzel
et al., 2003). Keim has introduced a classification of
visual analytics systems aiming for a description of
visualization methods properties (Keim, 2001).
4 THE KnoVA APPROACH
It is our aim to create a method that, according to
the three challenges identified above, allows for a de-
scription of data sources and visualizations for ad-hoc
integration and which allows for a description of ap-
plied expert knowledge. The goal of the KnoVA ap-
proach is to facilitate the extraction of expert knowl-
edge, which is applied by the user into the visual
analytics process and eventually apply this extracted
knowledge to other analysis tasks. To achieve this we
create a description, based upon existing classifica-
tion approaches, which can be used as the basis for
a domain specific language (DSL) in a model driven
KNOVA: INTRODUCING A REFERENCE MODEL FOR KNOWLEDGE-BASED VISUAL ANALYTICS
231

software development (MDSD) process. This is mo-
tivated by the thought, that a MDSD process helps
to design and implement a broad variety of powerful
visual analytics applications in various domains. The
KnoVA approach consists out of four distinctive parts:
1. A descriptive model for analysis applications, the
KnoVA reference model.
2. A visualization state process model, based upon
an adapted data-flow model (Tobias et al., 2009),
where the KnoVA reference model is used to de-
scribe the states.
3. A rule language, based upon the KnoVA reference
model, for the expression of rules to derive knowl-
edge.
4. A matching algorithm used to identify applicable
knowledge in certain states of an analysis applica-
tion.
This paper focuses on the development of the KnoVA
reference model. In the following we firstly describe
the considerations that lead to the development. Sub-
sequently we outline how the reference model can
be used to create knowledge driven visual analytics
applications in a model driven software development
process. Finally we discuss new possibilities, which
are opened up by a knowledge based visual analytics
process.
4.1 The KnoVA Reference Model
According to (Keim et al., 2009) visual analytics is an
iterative process with three distinctive steps: data se-
lection and preprocessing, visualization, model build-
ing. The iteration evidently leads to insight and there-
fore to the generation of knowledge, that then can be
applied to the previous steps in a feedback loop until
the process of analytical reasoning is finished. Hence
knowledge generated by the users’ insight is applied
back to the process. Accordingly visual analytics is
a knowledge driven process, in which expert knowl-
edge is applied implicitly by the users interaction with
the visualization. The user interaction results in a
change of the system state. Thus a description of the
system state in combination with the interaction or
precisely the state changing operations triggered by
the interaction can be used to implicitly describe the
applied knowledge. Accordingly it is the intention of
the KnoVA reference model to allow for a description
of system states and interactions.
To approach this we examined five exemplary visual
analytics systems in order to derive a set of classi-
fying properties: HD-Eye (Hinneburg et al., 2003),
SellTrend (Liu et al., 2009), DataMeadow (Elmqvist
et al., 2008), MineSet (Brunk et al., 1997) and Ad-
vizor (Eick, 2009). This bottom-up approach, in
which existing visual analytics systems are examined
to build a reference model according to their prop-
erties, was chosen to derive a larger set of common
properties and then presumably create a potentially
generic model. Contrasting to this, a top-down ap-
proach to create the reference model would have been
to collect the requirements for a new analysis applica-
tion and then use these to create the model. This goes
along with the risk to create a very specific model,
which will only fit for a limited set of possible new
visual analytics applications.
From the five exemplary visual analytics systems
HD-Eye was chosen because it targets cluster analy-
sis, which are very important in the health care do-
main. SellTrend was chosen because it features a
large variety of visualizations in multi-coordinated
views and supports multi-variant data. The same rea-
sons lead to the investigation of Advizor, as the inte-
gration of a broad variety of visualizations is one of
the key challenges we identified. DataMeadow was
chosen because it supports operation-based linkage
between views. MineSet was used because of its in-
tegrated knowledge model. The features of the sys-
tems that we examined are influenced by the key chal-
lenges: their integrated visualizations, their support
for data integration and the means of interaction they
provide. In addition to these five systems we exam-
ined a selection of visualization methods such as par-
allel coordinate views, different kinds of charts, scat-
ter plots etc. to further improve the universal validity
of the reference model.
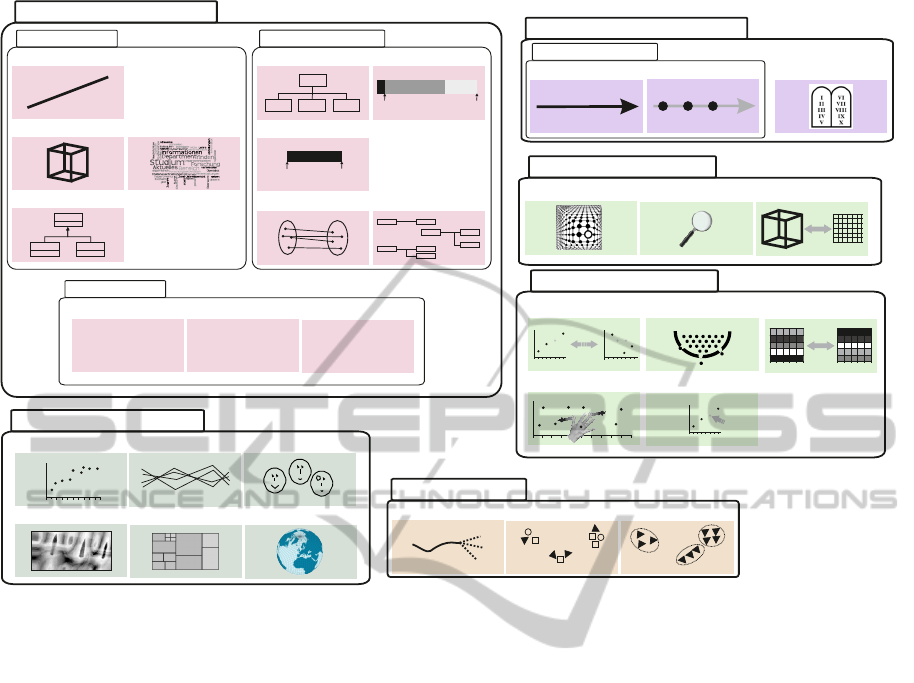
So far we identified 32 distinctive descriptive
properties. We ordered the properties according to
their similarities and identified six classes with a num-
ber of subclasses, which are sufficient to subsume all
of the identified properties. The result of this pro-
cess can be seen in figure 1 where the six classes and
subclasses are visualized following the style of UML
package diagrams. Within the classes and subclasses
the properties are displayed in an iconographic no-
tation, which is inspired by the notation introduced
in (Aigner et al., 2007). We identified the following
classes:
Data to be Visualized. This class is used to catego-
rize the data supported by the visual analytics sys-
tem. We identified three distinct subclasses here
in which data can be categorized: data type, data
structure and data scale.
Analysis Goal. Most of the visual analysis applica-
tions we investigated are optimized for a specific
analysis goal, like most visualization methods.
Even though many visual methods can be used in
IVAPP 2011 - International Conference on Information Visualization Theory and Applications
232
continuous
discrete
Dynamic Representation
Data to be visualized
multi dimensional
one dimensional
Text & Hypertext
Software & Algorithms
Auto
Cabrio
Sportwagen
complex
t
start
t
end
arithmetical
90
20
60
Data Type
Data Scale
quantitative
0.78
1.30
3.90
6.78
9.98
ordinal
low
medium
high
very high
nominal
Amerika
Europa
Asien
Afrika
Australien
Antartika
Standard 2-D / 3-D
Geometry based
Icon and Glyph
Pixel based
Nested
Vizualization technique
Association
Clustering
Classification
Analysis goal
functional dependent
multi dependent
1:1
1:n
1:*
...
Filtering
Distortion
Zoom/Pan
Linking und Brushing
Visual Projection
Visual Transformation
Selection
Projection
Zoom/Exploration
hierarchical
Xerox
Cut
Puc
Bun
Data Structure
Animated / Dynamic
static
Interaction Technique
geo-spatial
Figure 1: Iconographic description of classes and properties of the KnoVA reference model of visual analytics systems.
tasks with varying goals, it is still useful to iden-
tify all analysis goals to which methods are ap-
plicable. Therefore we consider it valuable to use
analysis goal as category for classification. Clus-
tering for example is a very common analysis goal
in the visual analytics systems we investigated,
scatter plots are a common visualization method
to reach this goal.
Visual Transformation. This class subsumes trans-
formations on the visualization which modify the
visual representation but do not change the state
of the underlying data. Fish-eye lenses, which vi-
sually enlarge or diminish parts of the visualiza-
tion and local zooms, which enlarge the current
visual representation without changing the under-
lying data section, fall into this category. Typi-
cally user interaction is necessary to apply these
techniques. However, all interaction methods in
this class are stateless and therefore do not change
the mapping between the visualization and the un-
derlying data.
Interaction Technique. In this class we group inter-
action techniques, which result in (possibly per-
sistant) changes to the underlying data. These
techniques vary from visual transformations, as
they change not only the visual representation but
also the current system state. For example in a
visualization method for hierarchical data a zoom
operation can trigger a data operation that leads
to a switch in the mapping between the visualiza-
tion and the underlying data. By doing that a more
specialized or generalized hierarchical level of the
data is displayed.
Dynamic Representation. Visualization methods
can be distinguished into those which, unless
there is user interaction, offer a static represen-
tation of the data and those where the data is
animated. Animations are either continuous, with
smooth transitions between frames or discrete
like slide shows.
Visualization Technique. In this class finally we
sum up the visualization techniques. Every visu-
alization method has a specific visual representa-
tion of the data. This representation can be pixel
based (e.g. each data point is mapped to a color
value and then visualized as a pixel or a group of
pixel), geometry based with a mathematical func-
tion defining the visual representation and so on.
Based upon this work, we created the KnoVA refer-
ence model of visual analytics systems, a language
KNOVA: INTRODUCING A REFERENCE MODEL FOR KNOWLEDGE-BASED VISUAL ANALYTICS
233
to describe the properties of visual analytics applica-
tions.
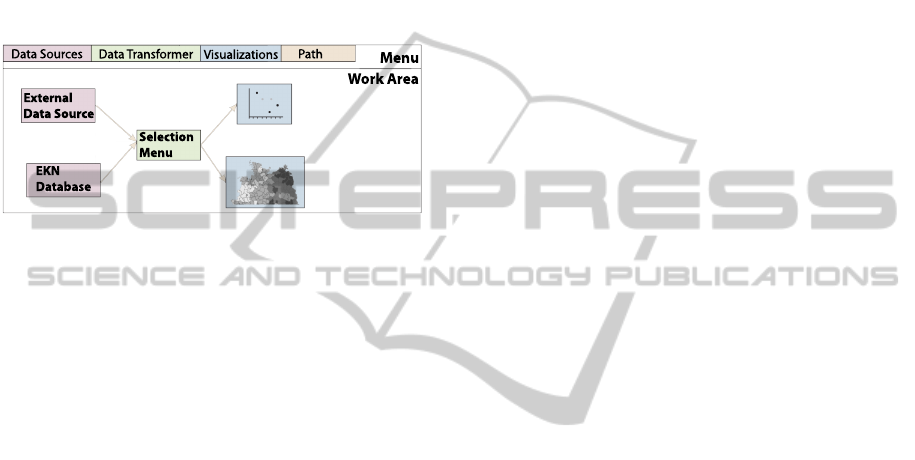
4.2 Model Driven Realization
To demonstrate the possibilities that emerge out of the
KnoVA reference model, we created the Visual Ana-
lytics Transform System (VAT-System). It aims at the
analysis of epidemiological data combining various
data sources and visualizations. A screenshot of this
system can be seen in figure 2.
EKN
Database
External
Data Source
Selection
Menu
Menu
Work Area
Data Sources
Data Transformer
Visualizations
Path
Figure 2: Screenshot of the VAT-System.
In the screenshot the two main parts of the applica-
tion are shown, the menu and the work area. The
menu gives access to so called system elements (data
sources, data transformers and visualizations), which
can interactively be connected to each other in the
work area. System elements are connected by path
drawn in between. Data transformers are used to
make further selections, e.g. a simple data trans-
former would be a selection menu that lets the user
specify a partition of the data to be analyzed.
To create the VAT-system we translated the
KnoVA reference model into a DSL using the VMTS
modeling framework (Levendovszky et al., 2005).
Based upon the DSL new system elements (visualiza-
tion methods or data sources) can be integrated into
the system by the definition of appropriate mappings
of their properties to the properties of the reference
model. At runtime the linking of the selected system
elements is done transparently for the user by an au-
tomatic evaluation of the mappings of the model in-
stances of different system elements against the refer-
ence model. Thus, when a path connects two system
elements, a matching component translates the map-
pings of the different system elements to their repre-
sentation in the reference model DSL and then com-
pares those system elements based upon the reference
model. As an example, when two data sources are
connected to the same data transformer (as shown in
figure 2 for the selection menu), the mapping iden-
tifies similar properties of the system elements on
their DSL based representation. Given that both data
sources contain geo-spatial information and this is be-
ing identified on the level of the reference model DSL,
the pre-defined mappings can be evaluated to identify
similar instances (in this case geographic coordinates)
on the instance level, to create a link between the data
sources.
5 SUMMARY
AND CONTRIBUTION
The KnoVA reference model is based upon the work
of Keim (Keim, 2001) where a classification sys-
tem for visualization applications was proposed con-
taining three orthogonal axis: Data to be visual-
ized, visualization technique and interaction tech-
nique. Our contribution here is a substantial enhance-
ment of this classification by the introduction of ad-
ditional classes (visual transformation, analysis goal
and dynamic representation), the introduction of sub-
classes (data type, data structure, data scale and an-
imated/dynamic) and by the identification of addi-
tional classifying properties (arithmetical, complex,
functional dependent, multi dependent, continuous,
discrete, static, panning zoom, explorative zoom, se-
lection, projection, geo-spatial, association, classifi-
cation and clustering) to create the KnoVA reference
model.
Opposing to Keims classification the classes and
classifying properties of the KnoVA reference model
are not orthogonal; they are rather used in a descrip-
tive way. The new concept of subclasses was intro-
duced mainly because this hierarchical structure sim-
plifies the language definition in the VMTS modeling
environment, which is done by using a subset of UML
class diagrams.
As shown exemplarily on the VAT-system the
model driven approach supports the development of
powerful visual analytics applications where the in-
tegration of new system elements is carried out and
performed as definition of a mapping between the
new system element to integrate and the DSL pre-
senting the reference model. This addresses two of
the key challenges we identified above as it simplifies
data integration and visualization integration. With
the iconographic language for the description of the
KnoVA reference model, we substantially extended
the graphical notation introduced in (Aigner et al.,
2007). We believe using an iconographic language
adds value for communication in the scientific world
and as a side effect might be used in future to aid users
when comparing different visualization methods by
giving them direct visual feedback about the proper-
ties a certain visualization method has.
IVAPP 2011 - International Conference on Information Visualization Theory and Applications
234

6 FUTURE RESEARCH
The definition of the KnoVA reference model and
the DSL based implementation is the first step in the
KnoVA approach. Currently we are working on a for-
mal description of the DSL based system states, to
create a visualization state process model. The ba-
sic idea is, that knowledge is applied implicitly by
the users interaction, which leads to a change in the
system states. In addition to this, a rule language for
knowledge extraction has to be defined. This work
being done, the complete KnoVA approach for knowl-
edge based visual analytics applications can be used
to create visual analytics applications that allow for
an extraction of implicit expert knowledge.
An open research questions is whether the knowl-
edge extraction can take place automatically or
whether user interaction is necessary. Another open
question is how the knowledge can be applied to other
tasks. One possibility to use the knowledge in a dif-
ferent context can be the automatic generation of pos-
sible next step suggestions or the generation of sug-
gestions for other suitable visualizations. This will
address the third challenge identified above.
REFERENCES
Aigner, W., Bertone, A., Miksch, S., Tominski, C., and
Schumann, H. (2007). Towards a conceptual frame-
work for visual analytics of time and time-oriented
data. In WSC ’07: Proceedings of the 39th conference
on Winter simulation, pages 721–729, Piscataway, NJ,
USA. IEEE Press.
Brunk, C., Kelly, J., and Kohavi, R. (1997). Mineset: An in-
tegrated system for data mining. In KDD, pages 135–
138.
Chi, E. H. (2002). Expressiveness of the data flow and data
state models in visualization systems. In AVI ’02: Pro-
ceedings of the Working Conference on Advanced Vi-
sual Interfaces, pages 375–378, New York, NY, USA.
ACM.
Chuah, M. C., Roth, S. F., Mattis, J., and Kolojejchick, J.
(1995). Sdm: Selective dynamic manipulation of vi-
sualizations. In ACM Symposium on User Interface
Software and Technology, pages 61–70.
Eick, S. G. (2009). Data visualization software — advizor
solutions. ”‘Website”’.
Elmqvist, N., Stasko, J., and Tsigas, P. (2008).
Datameadow: a visual canvas for analysis of large-
scale multivariate data. Information Visualization,
7(1):18–33.
Fl
¨
oring, S. and Hesselmann, T. (2010). Tap: Towards vi-
sual analytics on interactive surfaces. In Collabora-
tive Visualization on Interactive Surfaces - CoVIS ’09,
number 2010-2, pages 9–12, Munich, Germany. LMU
Media Informatics. Technical Report.
Haber, R. and McNabb, D. A. (1990). Visualization id-
ioms: A conceptual model for scientific visualization
systems. In Visualization in Scientific Computing.
Hinneburg, A., Keim, D. A., and Wawryniuk, M. (2003).
Hd-eye - visual clustering of high dimensional data: a
demonstration. IEEE Computer Graphics and Appli-
cations, 19(5):735–755.
Keim, D. A. (2001). Visual exploration of large data sets.
Commun. ACM, 44(8):38–44.
Keim, D. A., Mansmann, F., Stoffel, A., and Ziegler, H.
(2009). Visual analytics. In Encyclopedia of Database
Systems. Springer.
Levendovszky, T., Lengyel, L., Mezei, G., and Charaf, H.
(2005). A systematic approach to metamodeling envi-
ronments and model transformation systems in vmts.
In Electronic Notes in Theoretical Computer Science,
pages 65–75.
Liu, Z., Stasko, J., and Sullivan, T. (2009). Selltrend:
Inter-attribute visual analysis of temporal transaction
data. IEEE Transactions on Visualization and Com-
puter Graphics, 15(6):1025–1032.
Meister, J., Rohde, M., Appelrath, H.-J., and Kamp, V.
(2003). Data-warehousing im gesundheitswesen. it
- Information Technology, 45(4):179–185.
Pfitzner, D., Hobbs, V., and Powers, D. M. W. (2003). A
unified taxonomic framework for information visual-
ization. In Pattison, T. and Thomas, B. H., editors, In-
Vis.au, volume 24 of CRPIT, pages 57–66. Australian
Computer Society.
Tang, D., Stolte, C., and Bosch, R. (2004). Design choices
when architecting visualizations. Information Visual-
ization, 3(2):65–79.
Tobias, M., Isenberg, P., and Carpendale, S. (2009). Lark:
Coordinating co-located collaboration with informa-
tion visualization. IEEE Transactions on Visualization
and Computer Graphics, 15(6):1065–1072.
Valiati, E. R. A., Pimenta, M. S., and Freitas, C. M. D. S.
(2006). A taxonomy of tasks for guiding the evalu-
ation of multidimensional visualizations. In BELIV
’06: Proceedings of the 2006 AVI workshop on BE-
yond time and errors, pages 1–6, New York, NY,
USA. ACM.
Wehrend, S. and Lewis, C. (1990). A problem-oriented
classification of visualization techniques. In VIS ’90:
Proceedings of the 1st conference on Visualization
’90, pages 139–143, Los Alamitos, CA, USA. IEEE
Computer Society Press.
Wenzel, S., Bernhard, J., and Jessen, U. (2003). Visual-
ization for modeling and simulation: a taxonomy of
visualization techniques for simulation in production
and logistics. In Chick, S. E., Sanchez, P. J., Ferrin,
D. M., and Morrice, D. J., editors, Winter Simulation
Conference, pages 729–736. ACM.
KNOVA: INTRODUCING A REFERENCE MODEL FOR KNOWLEDGE-BASED VISUAL ANALYTICS
235
