
MATRIX AND TENSOR FACTORIZATION FOR PREDICTING
STUDENT PERFORMANCE
Nguyen Thai-Nghe, Lucas Drumond, Tom
´
a
ˇ
s Horv
´
ath,
Alexandros Nanopoulos and Lars Schmidt-Thieme
Machine Learning Lab, University of Hildesheim, 31141 Hildesheim, Germany
Keywords:
Recommender systems, Matrix factorization, Tensor factorization, Student performance.
Abstract:
Recommender systems are widely used in many areas, especially in e-commerce. Recently, they are also ap-
plied in technology enhanced learning such as recommending resources (e.g. papers, books,...) to the learners
(students). In this study, we propose using state-of-the-art recommender system techniques for predicting stu-
dent performance. We introduce and formulate the problem of predicting student performance in the context of
recommender systems. We present the matrix factorization method, known as most effective recommendation
approaches, to implicitly take into account the latent factors, e.g. “slip” and “guess”, in predicting student per-
formance. Moreover, the knowledge of the learners has been improved over the time, thus, we propose tensor
factorization methods to take the temporal effect into account. Experimental results show that the proposed
approaches can improve the prediction results.
1 INTRODUCTION
Recommender systems are widely used in many ar-
eas, especially in e-commerce (Rendle et al., 2010;
Koren et al., 2009). Recently, researchers have ap-
plied recommendation techniques in e-learning, es-
pecially technology enhanced learning (Manouselis
et al., 2010). Most of the works focused on construct-
ing recommender systems for recommending learning
objects (materials/resources) or learning activities to
the learners (Ghauth and Abdullah, 2010; Manouselis
et al., 2010) in both formal and informal learning en-
vironment (Drachsler et al., 2009).
On the other side, educational data mining has
also been taken into account recently to assist univer-
sities, teachers, and students. For example, to help the
students improve their performance, we would like to
know how the students learn (e.g. generally or nar-
rowly), how quickly or slowly they adapt to new prob-
lems or if it is possible to infer the knowledge require-
ments to solve the problems directly from student per-
formance data (Feng et al., 2009). In (Cen et al.,
2006) it has been shown that an improved model for
predicting student performance could save millions of
hours of students’ time (and effort) in learning alge-
bra. In that time, students could move to other spe-
cific fields of their study or doing other things they
enjoy. Moreover, many universities are extremely fo-
cused on assessment, thus, the pressure on “teaching
and learning for examinations” leads to a significant
amount of time spending for preparing and taking
standardized tests. Any advances which allow us to
reduce the role of standardized tests hold the promise
of increasing deep learning (Feng et al., 2009). From
an educational data mining point of view, a good
model which accurately predicts student performance
could replace some current standardized tests.
To address the student performance prediction
problem, many works have been published. Most of
them relying on traditional methods such as logistic
regression (Cen et al., 2006), linear regression (Feng
et al., 2009), decision tree (Thai-Nghe et al., 2007),
neural networks (Romero et al., 2008), support vector
machines (Thai-Nghe et al., 2009), and so on.
Recently, (Thai-Nghe et al., 2010) have proposed
using recommendation techniques, especially matrix
factorization, for predicting student performance. The
authors have shown that using recommendation tech-
niques could improve prediction results compared to
regression methods but they have not taken the tempo-
ral effect into account. Obviously, in the educational
point of view, we always expect that the students can
improve their knowledge time by time, so the tempo-
ral information is critical for such prediction tasks.
On the other hand, in student performance predic-
tion, there are two “crucial aspects” need to be taken
69
Thai-Nghe N., Drumond L., Horváth T., Nanopoulos A. and Schmidt-Thieme L..
MATRIX AND TENSOR FACTORIZATION FOR PREDICTING STUDENT PERFORMANCE.
DOI: 10.5220/0003328700690078
In Proceedings of the 3rd International Conference on Computer Supported Education (CSEDU-2011), pages 69-78
ISBN: 978-989-8425-49-2
Copyright
c
2011 SCITEPRESS (Science and Technology Publications, Lda.)

into account, which are
1. the probabilities that the students do not know
how to solve the problem (or do not know some
required skills related to the problem) but guess-
ing correctly (we call “guess” for short); and the
probabilities that the students know how to solve
the problem (or know all of the required skills
related to the problem) but they make a mistake
(we call “slip” for short); these problems are user-
dependent, and,
2. their knowledge has been improved over the time,
e.g. the second time a student is doing his ex-
ercises, his performance on average gets better,
therefore, the sequence effect is important infor-
mation.
Matrix factorization techniques, one of the most suc-
cessful methods for rating prediction, are quite appro-
priate for the first problem since they implicitly en-
code the “slip” and “guess” factors in their latent fac-
tors and we do not need to explicitly take care of as
in case of other methods like Hidden Markov Mod-
els (Pardos and Heffernan, 2010). Moreover, if we
would like to incorporate the sequential (time) aspect
or any other context such as skills in the second “cru-
cial aspect”, then tensor factorization techniques are
suitable for solving this problem.
This work proposes the factorization approaches
for predicting student performance. Concretely, the
contributions of this work are:
• formulating the problem of predicting student per-
formance in the context of recommender systems;
• proposing matrix factorization as well as biased
matrix factorization techniques which implicitly
encode the “slip” and “guess” factors in predicting
student performance
• proposing tensor factorization techniques to take
the temporal effect into account, e.g. the knowl-
edge of the learners improves over time.
• comparing the proposed approaches with other
baselines as well as traditional techniques such as
logistic regression.
From the experimental results on two large data
sets collected from the intelligent tutoring system, we
show that the proposed approaches perform nicely
among the other methods.
2 RELATED WORK
As surveyed in (Manouselis et al., 2010), many rec-
ommender systems have been deployed in technol-
ogy enhanced learning. Concretely, (Garc
´
ıa et al.,
2009) uses association rule mining to discover inter-
esting information through student performance data
in the form of IF-THEN rules, then generating the
recommendations based on those rules; (Bobadilla
et al., 2009) proposed an equation for collaborative
filtering which incorporated the test score from the
learners into the item prediction function; (Ge et al.,
2006) combined the content-based filtering and col-
laborative filtering to personalize the recommenda-
tions for a courseware selection module; (Soonthorn-
phisaj et al., 2006) applied collaborative filtering to
predict the most suitable documents for the learn-
ers; while (Khribi et al., 2008) employed web mining
techniques with content-based and collaborative fil-
tering to compute the relevant links for recommend-
ing to the learners.
For predicting student performance, (Romero
et al., 2008) compared different data mining meth-
ods and techniques to classify students based on their
Moodle usage data and the final marks obtained in
their respective courses; (Bekele and Menzel, 2005)
used Bayesian networks to predict student results;
(Cen et al., 2006) proposed a method for improv-
ing a cognitive model, which is a set of rules/skills
encoded in intelligent tutors to model how students
solve problems, using logistic regression; (Thai-Nghe
et al., 2007) analyzed and compared some classifica-
tion methods (e.g. decision trees and Bayesian net-
works) for predicting academic performance; while
(Thai-Nghe et al., 2009) proposed to improve the stu-
dent performance prediction by dealing with the class
imbalance problem. (i.e., the ratio between passing
and failing students is usually skewed). Recently,
(Thai-Nghe et al., 2010; Toscher and Jahrer, 2010)
proposed using collaborative filtering, especially ma-
trix factorization for predicting student performance
but they have not take the temporal effect into ac-
count.
Different from the literature, instead of using tra-
ditional classification or regression methods, we pro-
pose using matrix factorization technique to implic-
itly manage the “slip” and “guess” factors in predict-
ing student performance, and using tensor factoriza-
tion to incorporate the temporal effect into the mod-
els.
3 PREDICTING STUDENT
PERFORMANCE: PROBLEM
FORMULATION
In the problem of predicting student performance, we
would like to predict the student’s ability in solving
CSEDU 2011 - 3rd International Conference on Computer Supported Education
70
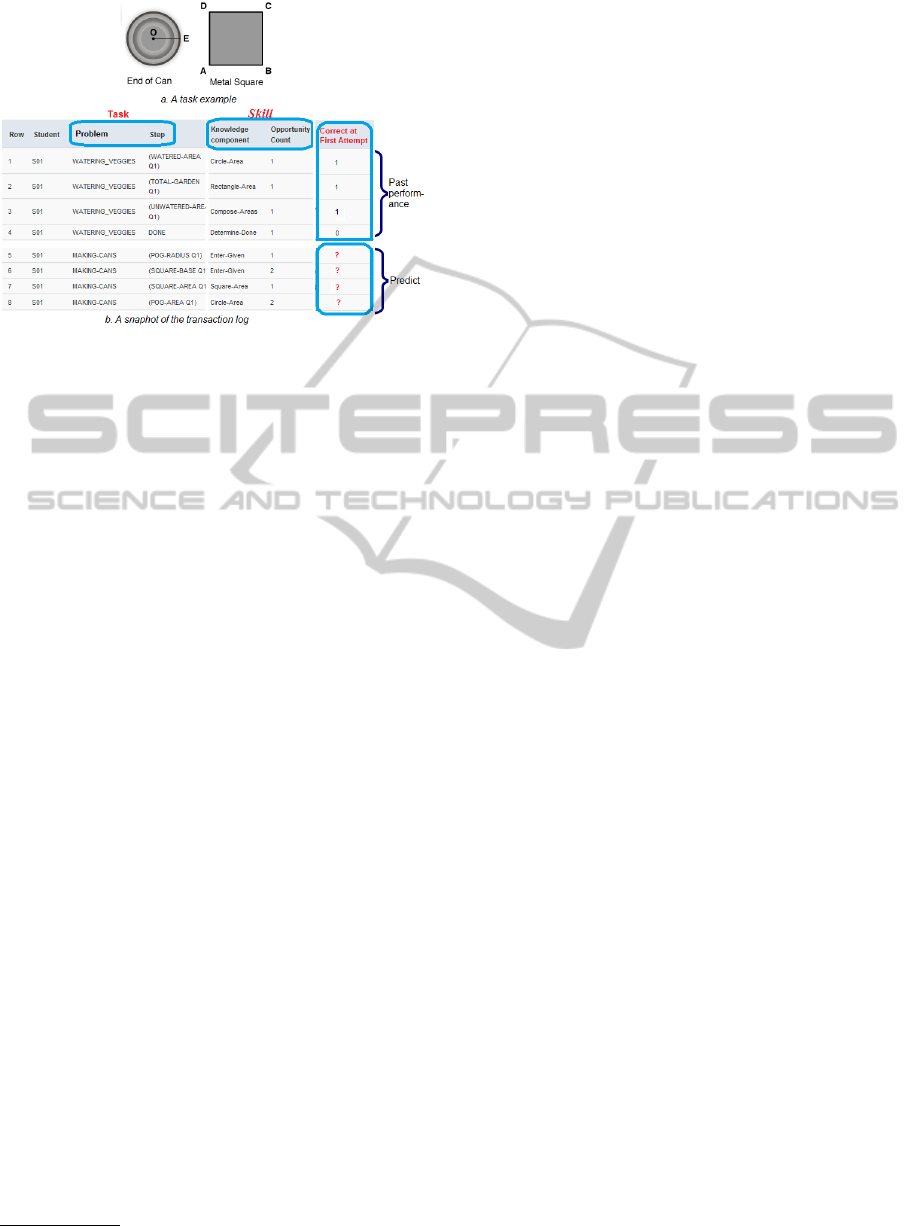
Figure 1: Predicting student performance: A scenario.
the tasks when interacting with the tutoring system.
Figure 1a presents an example of the task
1
. Given
the circle and the square as in this figure, the task for
students could be “What is the remaining area of the
square after removing the circular area?”
To solve this task (question), students could do
some smaller subtasks which we call solving-step.
Each step may be required one or more skills (or we
can call “knowledge components”), for example:
• Step 1: Calculate the circle area (the required
skills for this step are the value of π, square,
multiplication, and finally putting them together
area
1
= π ∗ (OE)
2
)
• Step 2: Calculate the square area (skill: area
2
=
(AB)
2
)
• Step 3: Calculate the remaining (skill: area
2
−
area
1
)
Each solving-step is recorded as a transaction. Figure
1b presents a snapshot of the transactions. Based
on the past performance, we would like to predict
students’ next performance (e.g. correct/incorrect) in
solving the tasks. The following section will formally
formulate this problem.
Problem Formulation
Computer-aided tutoring systems (CATS) allow stu-
dents to solve some exercises with a graphical fron-
tend that can automate some tedious tasks, provide
some hints and provide feedback to the student. Such
systems can profit from anticipating student perfor-
mance in many ways, e.g., in selecting the right mix
of exercises, choosing an appropriate level of diffi-
culty and deciding about possible interventions such
1
Source: https://pslcdatashop.web.cmu.edu/KDDCup
as hints. The problem of student performance predic-
tion in CATS means to predict the likely performance
of a student for some exercises (or part thereof such
as for some particular steps) which we call the tasks.
The task could be to solve a particular step in a prob-
lem, to solve a whole problem or to solve problems in
a section or unit, etc.
CATS allow to collect a rich amount of informa-
tion about how a student interacts with the tutoring
system and about his past successes and failures. Usu-
ally, such information is collected in a clickstream log
with an entry for every action the student takes. The
clickstream log contains information about the
time, student, context, action
For performance prediction, such click streams can
be aggregated to the task for which the performance
should be predicted and eventually be enriched with
additional information. For example, if the aim is to
predict the performance for each single step in a prob-
lem, then all actions in the clickstream log belonging
to the same student and problem step will be aggre-
gated to a single transaction and enriched, for exam-
ple with some performance metrics.
Part of the context describes the task the student
should solve. In CATS tasks usually are described in
two different ways: First, tasks are located in a topic
hierarchy, for example
unit ⊇ section ⊇ problem ⊇ step
Second, tasks are described by additional metadata
such as the skills that are required to solve the prob-
lem:
skill
1
, skill
2
, . . . , skill
n
All this information, the topic hierarchy, skills and
other task metadata can be described as attributes of
the tasks. In the same way, also attributes about the
student may be available.
More formally, let S be a set of student IDs, T be a
set of task IDs, and P ⊆ R be a range of possible per-
formance scores. Let M
S
be a set of student metadata
descriptions and
m
S
: S → M
S
be the metadata for each student. Let M
T
be a set of
task metadata descriptions and
m
T
: T → M
T
be the metadata for each task. Finally, let D
train
⊆
(S × T × P)
∗
be a sequence of observed student per-
formances and D
test
⊆ (S × T × P)
∗
be a sequence of
unobserved student performances. Furthermore, let
π
p
: S × T × P → P, (s, t, p) 7→ p
MATRIX AND TENSOR FACTORIZATION FOR PREDICTING STUDENT PERFORMANCE
71

and
π
s,t
: S × T × P → S × T, (s, t, p) 7→ (s, t)
be the projections to the performance measure and to
the student/task pair.
Then the problem of student performance predic-
tion is, given D
train
, π
s,t
D
test
, m
S
, and m
T
to find
ˆp
1
, ˆp
2
, . . . , ˆp
|D
test
|
such that
err(p, ˆp) :=
|D
test
|
∑
i=1
(p
i
− ˆp
i
)
2
is minimal with p := π
p
D
test
(or some other error
measures). In principle, this is a regression or clas-
sification problem (depending on the error measure).
Given s ∈ S and t ∈ T , our problem is to predict p.
Obviously, in a recommender system context, s, t and
p would be user, item and rating, respectively. The
recommendation task at hand is thus rating prediction.
4 TECHNIQUES FOR
RECOMMENDER SYSTEMS
The aim of recommender system is making vast cata-
logs of products consumable by learning user prefer-
ences and applying them to items formerly unknown
to the user, thus being able to recommend what has a
high likelihood of being interesting to the target user.
The two most common tasks in recommender systems
are Top-N item recommendation where the recom-
mender suggests a ranked list of (at most) N items
i ∈ I to a user u ∈ U and rating prediction where the
aim is predicting the preference score (rating) r ∈ R
for a given user-item combination.
In this work, we make use of matrix factorization
(Rendle and Schmidt-Thieme, 2008; Koren et al.,
2009), which is known to be one of the most suc-
cessful methods for rating prediction, outperforming
other state-of-the-art methods (Bell and Koren,
2007) and tensor factorization (Kolda and Bader,
2009; Dunlavy et al., 2010) to take into account
the sequential effect. We will briefly describe these
techniques in the following subsections.
Notation. A matrix is denoted by a capital italic letter,
e.g. X; A tensor is denoted by a capital bold letter, e.g.
Z; w
k
denotes a k
th
vector; w
uk
is the u
th
element of a
k
th
vector; and ◦ denotes an outer product.
4.1 Matrix Factorization
Matrix factorization is the task of approximating a
matrix X by the product of two smaller matrices W
and H, i.e. X ≈ W H
T
(Koren et al., 2009). In the
context of recommender systems the matrix X is the
partially observed ratings matrix, W ∈ R
U×K
is a ma-
trix where each row u is a vector containing the K
latent factors describing the user u and H ∈ R
I×K
is
a matrix where each row i is a vector containing the
K factors describing the item i. Let w
uk
and h
ik
be
the elements of W and H, respectively, then the rating
given by a user u to an item i is predicted by:
ˆr
ui
=
K
∑
k=1
w
uk
h
ik
= (W H
T
)
u,i
(1)
where W and H are the model parameters and can be
learned by optimizing the objective function (2) given
a criterion such as root mean squared error (RMSE):
min
W,H
(r
ui
− ˆr
ui
)
2
+ λ(||W ||
2
+ ||H||
2
) (2)
where λ is a regularization term which is used to pre-
vent overfitting. In this work, the model parameters
were optimized for RMSE using stochastic gradient
descent (Bottou, 2004):
RMSE =
s
∑
ui∈D
test
(r
ui
− ˆr
ui
)
2
|D
test
|
(3)
An illustration of matrix decomposition is presented
in Figure 2.
Figure 2: An illustration of matrix factorization.
4.2 Tensor Factorization
This is a general form of matrix factorization. Given
a three-mode tensor Z of size U × I × T , where the
first and the second mode describe the user and item
as in previous section; the third mode describes the
context, e.g. time, with size T. Then Z can be written
as a sum of rank-1 tensors:
Z ≈
K
∑
k=1
w
k
◦ h
k
◦ q
k
(4)
where ◦ is the outer product and each vector w
k
∈ R
U
,
h
k
∈ R
I
, and q
k
∈ R
T
describes the latent factors of
user, item, and time, respectively (please refer to the
articles (Kolda and Bader, 2009; Dunlavy et al., 2010)
for more details). An illustration of tensor decompo-
sition is presented in Figure 3. The model parameters
were also optimized for RMSE using stochastic gra-
dient descent.
CSEDU 2011 - 3rd International Conference on Computer Supported Education
72
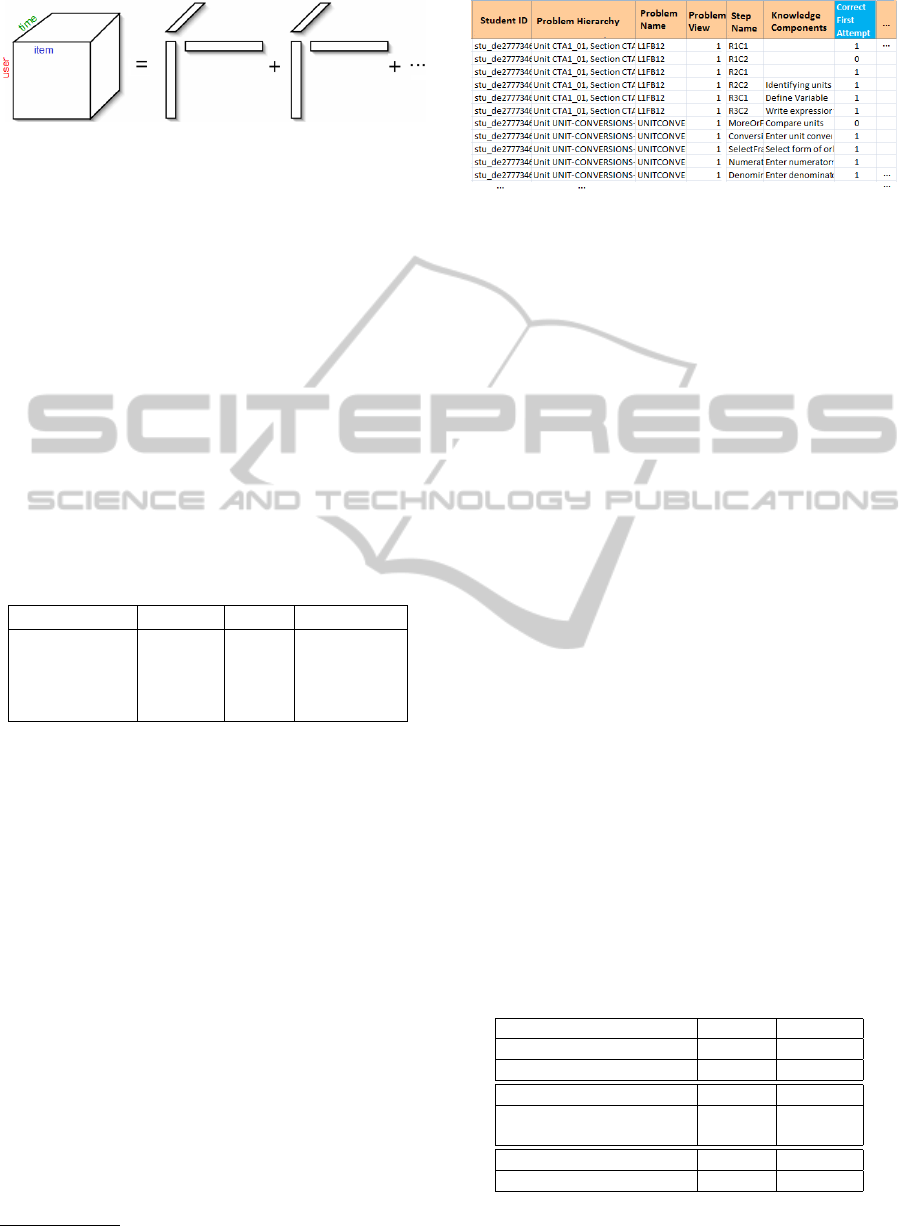
Figure 3: An illutration of tensor factorization.
5 DATA SETS AND METHODS
Two real-world data sets are collected from the
Knowledge Discovery and Data Mining Challenge
2010
2
. These data sets, originally labeled “Algebra
2008-2009” and “Bridge to Algebra 2008-2009” will
be denoted ”Algebra” and ”Bridge” for the remainder
of our paper. Each data set is split into a train and a
test partition as described in Table 1. The data rep-
resents the log files of interactions between students
and computer-aided-tutoring systems. While students
solve math related problems in the tutoring system,
their activities, success and progress indicators are
logged as individual rows in the data sets. A snap-
shot of the data sets is described in Figure 4.
Table 1: Data sets.
Data sets Size #Attr. #Records
Algebra train 3.1 Gb 23 8,918,054
Algebra test 124 Mb 23 508,912
Bridge train 5.5 Gb 21 20,012,498
Bridge test 135 Mb 21 756,386
The central element of interaction between the
students and the tutoring system is the problem. Ev-
ery problem belongs into a hierarchy of unit and sec-
tion. Furthermore, a problem consists of many indi-
vidual steps such as calculating a circle’s area, solving
a given equation, entering the result and alike. The
field problem view tracks how many times the stu-
dent already saw this problem. Additionally, a dif-
ferent number of knowledge components (KC) and
associated opportunity counts is provided. Knowl-
edge components represent specific skills used for
solving the problem (where available) and opportu-
nity counts encode the number of times the respective
knowledge component has been encountered before.
Both, knowledge components and opportunity counts
are represented in a denormalized way, featuring all
knowledge components and their counts in one col-
umn.
Target of the prediction task is the correct first at-
tempt (CFA) information which encodes whether the
student successfully completed the given step on the
2
http://pslcdatashop.web.cmu.edu/KDDCup/
Figure 4: A snapshot of the data sets.
first attempt (CFA = 1 indicates correct, and CFA =
0 indicates incorrect). The prediction would then en-
code the certainty that the student will succeed on the
first try.
5.1 Mapping Educational Data to
Recommender Systems
There is an obvious mapping of users and ratings in
the student performance prediction problem:
student 7→ user
performance (correct first attempt) 7→ rating
The student becomes the user, and the correct
first attempt (CFA) indicator would become the rat-
ing, bounded between 0 and 1. With this setting there
are no users in the test set that are not present in the
training set which simplifies predictions.
For mapping the item, several options seemed to
be available to us. Here we use two selections as items
1) Solving-step (a combination of problem hierarchy,
problem name, step name, and problem view); and 2)
Skills (knowledge components). Please refer to the
article (Thai-Nghe et al., 2010) for more information
about how to map these data to user/item in recom-
mender systems. Information about the number of
users, items, and ratings used in this study are pre-
sented in Table 2.
Table 2: Mapping student performance data to user/item in
recommender systems. Solving-step is a combination of
problem hierarchy (PH), problem name (PN), step name
(SN), and problem view (PV). Skill is also called knowl-
edge component (KC).
Algebra Bridge
User #User #User
Student 3,310 6,043
Item #Item #Item
Solving-Step (PH, PN, SN, PV) 1,416,473 887,740
Skill (KC) 8,197 7,550
Rating #Rating #Rating
Correct first attempt 8,918,054 20,012,498
MATRIX AND TENSOR FACTORIZATION FOR PREDICTING STUDENT PERFORMANCE
73

5.2 Mapping Educational Data to
Regression Problem
As most of the columns available both in train and test
were categorical, we needed to pre-process the data
before we could regress on it. Of course, one could
use “normalize to binary” strategy but in that case the
datasets are quite large and very sparse (for example,
the solving-step after binarizing will have 8,918,054
(20,012,498) rows and 1,416,473 (887,740) columns
for Algebra (Bridge) data set). Thus, we mainly de-
rived user/item averages to aggregate the variables as
input for our regression models, as described in (Thai-
Nghe et al., 2010). In the specific data sets from table
2, the variables we computed the respective averages
on are: student ID, solving-step ID, and skill ID.
5.3 Matrix Factorization – Implicitly
Encoding the “Slip” and “Guess”
Factors
Recall that there are 2 latent factors that should be
taken into account when predicting student perfor-
mance: 1) “Guess”: the probability that the students
do not know how to solve the problem (or do not know
any skill related to the problem) but still attempt to
perform the task correctly by guessing, and 2) “Slip”:
the probability that the students know how to solve the
problems (or know all of the required skills related to
the problem) but they make a mistake.
Matrix factorization techniques, one of the most
successful methods for item prediction, are appropri-
ate for this issue because these “slip” and ”guess” fac-
tors could be implicitly encoded in the latent factors
of factorization models.
Besides the matrix factorization model as in equa-
tion (1), we also employ the biased matrix factor-
ization model to deal with the problem of “user ef-
fect” and “item effect”. On the educational setting the
user and item bias are, respectively, the student and
solving-step biases. They model how good a student
is (i.e. how likely is the student to perform a task cor-
rectly) and how difficult the solving-step is (i.e. how
likely is the step in general to be performed correctly).
The prediction function for user u and item i is
determined by
ˆr
ui
= µ + b
u
+ b
i
+
K
∑
k=1
w
uk
h
ik
(5)
where µ, b
u
, and b
i
are global average, user bias and
item bias, respectively.
5.4 Tensor Factorization for Exploring
the Temporal Effect
In section 5.3, we use matrix factorization models to
take into account the latent factors “slip” and “guess”
but not the temporal effect. Obviously, in education
point of view: “The more the learners study the bet-
ter the performance they get”. Moreover, the knowl-
edge of the learners will be cumulated over the time,
thus the temporal effect is an important factor to pre-
dict the student performance. We adopt the idea from
(Dunlavy et al., 2010) which applies tensor factoriza-
tion for link prediction. Instead of using only two-
mode tensor (a matrix) as in the previous section, we
now add one more mode to the models - the time
mode. We also take into account the “user bias” and
“item bias”. The prediction function now becomes:
ˆr
uiT
= µ + b
u
+ b
i
+
K
∑
k=1
w
uk
h
ik
Φ
T k
!
(6)
Φ
T k
=
∑
T
t=(T −T
max
+1)
q
tk
T
max
(7)
where q
k
is a latent factor vector representing the
time, and T
max
is the number of solving-steps in the
history that we want to go back. This is a simple strat-
egy which averages T
max
performance steps in the past
to predict the current step. We will call this approach
TFA (Tensor Factorization - Averaging).
Another important factor is that “memory of hu-
man is limited”, so the students could forget what they
have studied in the past, e.g., they could perform bet-
ter on the lessons they learn recently than the one they
learn from last year or even longer. Moreover, we rec-
ognize that the second time the students do their exer-
cises and have more chances to learn the skills, their
performance on average gets better (we will explain
more about this in Figure 6 of section 6.3). Thus, we
could use a decay function which reduces the weight
θ when we go back to the history. We call this ap-
proach TFW (Tensor Factorization - Weighting)
Φ
T k
=
∑
T
t=(T −T
max
+1)
q
tk
e
t·θ
T
max
(8)
An open issue for this is that we can use forecast-
ing techniques instead of weighting or averaging. We
leave this solution for future work.
6 EVALUATION
6.1 Protocol
Before describing the experimental results, we
CSEDU 2011 - 3rd International Conference on Computer Supported Education
74
present the protocol used for evaluation. First of
all the data sets were mapped from the educational
context to both recommender systems and regression
contexts as described in sections 5.1 and 5.2. As a
baseline method, we use the global average, i.e. pre-
dicting the average of the target variable from the
training set. One of the challenging problem of rec-
ommender systems is to deal with the new-item prob-
lem. Matrix/tensor factorization cannot produce out-
put for “new items”, thus, we provide global average
scores for items that are not in the training data.
The proposed approaches were compared with
other methods such as user average, biased user-item
(Koren, 2010), as well as with traditional methods
such as logistic regression.
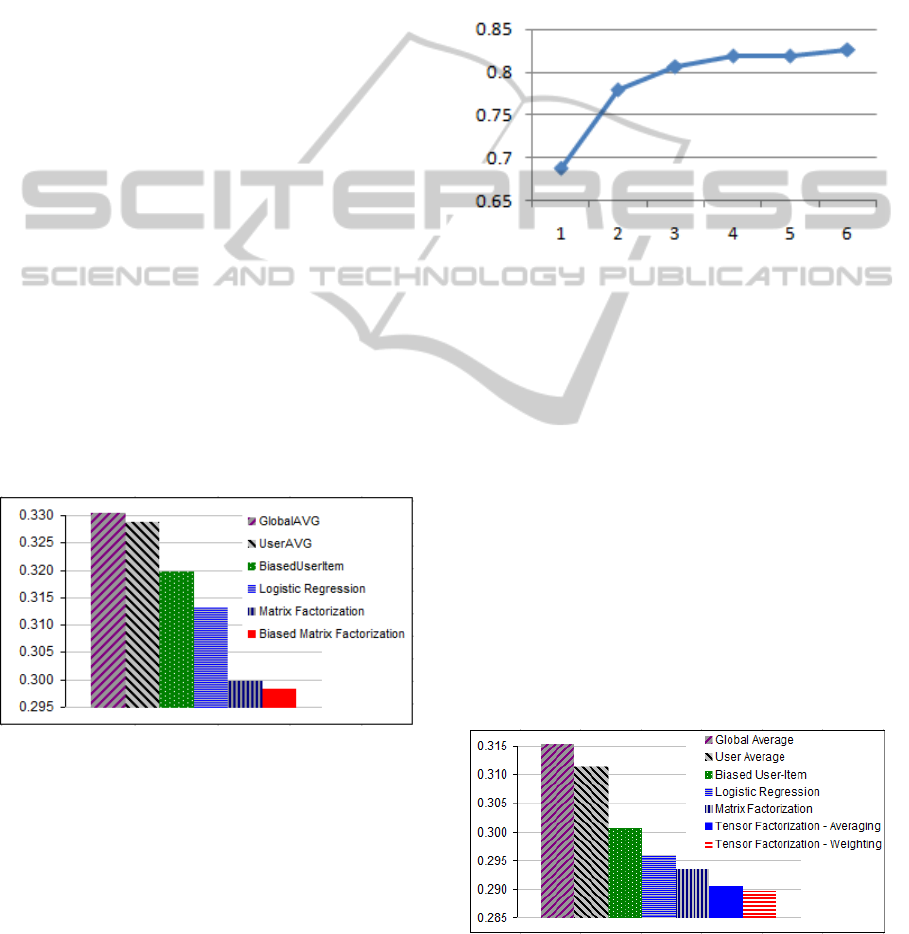
6.2 Results of Matrix Factorization
Figures 5 presents the comparison of root mean
squared error (RMSE) for Algebra data set. Clearly,
when using both matrix factorization and biased ma-
trix factorization on the student (as user) and the re-
quired skills (as item) to solve the step, the result
is significantly improved compare to other methods
such as biased user-item or logistic regression. More-
over, the proposed methods can deal with the “slip”
and “guess” by implicitly encoding them as latent
factors. (We also tried with linear regression, but
the results of linear regression and logistic regression
are very similar, we just report on logistic regression
here).
Figure 5: RMSE results of (biased) matrix factorization
which factorize on student and the required skills in solv-
ing the step compared to other methods on Algebra data
set. The lower the better.
6.3 Results of Tensor Factorization for
Exploring Temporal Effects
Previous section shows how we encode the “slip” and
“guess” factors to the model. In this section, we
present the result of taking into account the temporal
information. Figure 6 describes the effect of the time
on knowledge of the learners for Bridge data set (the
trend of Algebra data set looks nearly the same). In
this figure, the x-axis is the number of times that the
students have chances to learn the skills (the “oppor-
tunity count” column in the data set), the y-axis is the
ratio of the number of students solving the problem
correctly. Clearly, we can see that their performance
has been improved when they have more opportuni-
ties to learn the skills. This trend also reflects the ed-
ucational factor that “the more the students learn, the
better their performance they get”.
Figure 6: The effect of the time on knowledge of the learn-
ers (Bridge data set). The x-axis presents the number of
times the student learns the knowledge components. The
y-axis is the probability of solving the problem correctly.
Figure 7 presents the RMSE of tensor factoriza-
tion methods which factorize on the student (as user),
solving-step (as item), and the sequence of solving-
step (as time) for the Bridge data set. The results of
the proposed methods are also improved compared to
the others. Compared with matrix factorization which
does not take the temporal effect into account, the ten-
sor factorization methods have also been improved.
This result somehow reflects the natural fact that we
mentioned before: “the knowledge of the student is
improved over the time and human memory is lim-
ited”. However, the result of tensor factorization by
weighting with a decay function (TFW) has a small
improvement compared to the method of averaging
on the time mode (TFA).
Figure 7: RMSE results of taken into account the tempo-
ral effect using tensor factorization (Bridge data set) which
factorize on student, solving-step, and time. The lower the
better.
MATRIX AND TENSOR FACTORIZATION FOR PREDICTING STUDENT PERFORMANCE
75

Table 3: Hyperparameters are used for the experiments.
Method Data set Hyperparameters
Matrix factorization Algebra learning-rate=0.01, #iter=60, K=64, λ=0.01
Biased matrix factorization Algebra learning-rate=0.001, #iter=80, K=128, λ=0.0015
Matrix factorization Bridge learning-rate=0.01, #iter=80, K=64, λ=0.015
Tensor factorization - Averaging Bridge learning-rate=0.01, #iter=30, K=32, λ=0.015, T
max
=8
Tensor factorization - Weighting Bridge learning-rate=0.01, #iter=30, K=32, λ=0.015, T
max
=8, θ= 0.4
For referencing, we also report the best hyperpa-
rameters that we found via cross-validation in Table
3.
7 DISCUSSION
To this end, one would raise the following question:
“how the delivered recommendations look like?”.
Actually, we have not explicitly answered for this
question because of two reasons:
• First, we would like to discover how recom-
mender systems (e.g. factorization techniques)
can be applied for educational performance data,
especially for predicting student performance but
not for recommending learning objects.
• Second, we would like to focus on the first step
in recommender systems to see how high quality
of the rating score that the proposed methods can
produce is. (Basically, every recommender sys-
tem has “two steps”: The first step is to generate
the score, e.g rating; and the second step is to wrap
around with an interface, e.g. a web page)
However, we can deliver recommendations for many
problems. For example, in the scenario of section 3,
when the students learn the formula of calculating the
area of the circle and square, we could recommend
them the similar skills such as rectangle or parallelo-
gram, or alike. Another example is recommendation
of similar grammar structures, vocabularies, or even a
similar problem/section when student learning or do-
ing exercises in an English course, etc.
Moreover, another question could be raised is that
“How good our approaches are compared to the oth-
ers on the same KDD Challenge data?”. We can have
an overview on the RMSE score of the best student
teams in Table 4. Note, that our purpose is not pro-
ducing a system for the KDD Challenge but on getting
the real datasets from this event and applying recom-
mender systems, especially factorization techniques
for predicting student performance. Although the
other methods reached lower RMSE, they are more
complex and require much effort on data preprocess-
ing (e.g. feature engineering,..) as well as generating
hundred of models and ensembling approaches. Fac-
torization methods are simple to implement and need
not so much human effort and computer memory to
deal with large datasets (e.g, we just need 2 and 3
features for matrix and tensor factorization, respec-
tively). More complex models using matrix factoriza-
tion can also produce the better results as shown in
(Toscher and Jahrer, 2010). This means that factor-
ization approaches are promising for the problem of
predicting student performance.
Table 4: RMSE Averaging on Algebra and Bridge - KDD
Challenge 2010 - Student teams.
Rank Team Name RMSE Score
1 National Taiwan University 0.27295
2 Zach A. Pardos 0.27659
3 SCUT Data Mining 0.28048
- Our approach (no submit) 0.29519
4 Y10 0.29801
The third issue should also be discussed is that
“what does the presented RMSE reduction mean in
practical? e.g., how can it help the education man-
agers, students, etc?”. As in the Netflix Prize
3
it has
been shown that a 10% of improvement on RMSE
could bring million of dollars for recommender sys-
tems of a company. In this work, we are on educa-
tional environment, and of course, the benefit is not
explicitly as in e-commerce but the trend is very sim-
ilar. Moreover, in (Cen et al., 2006) it has been shown
that an improved model (e.g. lower RMSE) for pre-
dicting student performance could save millions of
hours of students’ time and effort since they can learn
other courses or do some useful activities. The better
a model captures the student’s skills, the lower will
be it’s error in predicting the student’s performance,
thus, an improvement on RMSE would show that our
models are better capable of capturing how much the
student has learned; and finally, a good model which
accurately predicts student performance could replace
some current standardized tests.
3
http://www.netflixprize.com
CSEDU 2011 - 3rd International Conference on Computer Supported Education
76

8 CONCLUSIONS
We propose using state-of-the-art recommender sys-
tem techniques for predicting student performance.
We introduce and formulate this problem and show
how to map it into recommender systems. We pro-
pose using matrix factorization to implicitly take into
account two latent factors “slip” and “guess” in pre-
dicting student performance. Moreover, the knowl-
edge of the learners improve time by time, thus, we
propose tensor factorization methods to take the tem-
poral effect into account. Experimental results show
that the proposed approaches are promising.
In future work, instead of using averaging or
weighting approached on the third mode of tensor,
we could use forecasting approach to take into ac-
count the sequential effect. Moreover, each solving-
step relates to one or many skills, thus, we could ap-
ply multi-relational matrix factorization to factorize
this problem.
ACKNOWLEDGEMENTS
The first author was funded by the “TRIG - Teach-
ing and Research Innovation Grant” project of Cantho
university, Vietnam. The second author was funded
by the CNPq, an institute of the Brazilian govern-
ment for scientific and technological development.
Tom
´
a
ˇ
s Horv
´
ath is also supported by the grant VEGA
1/0131/09. We would like to thank Artus Krohn-
Grimberghe for preparing the data sets.
REFERENCES
Bekele, R. and Menzel, W. (2005). A bayesian approach
to predict performance of a student (bapps): A case
with ethiopian students. In Artificial Intelligence and
Applications, pages 189–194. Vienna, Austria.
Bell, R. M. and Koren, Y. (2007). Scalable collaborative fil-
tering with jointly derived neighborhood interpolation
weights. In Proceedings of the 7th IEEE International
Conference on Data Mining (ICDM’07), pages 43–52,
Washington, USA. IEEE CS.
Bobadilla, J., Serradilla, F., and Hernando, A. (2009). Col-
laborative filtering adapted to recommender systems
of e-learning. Knowledge-Based Systems, 22(4):261–
265.
Bottou, L. (2004). Stochastic learning. In Bousquet, O.
and von Luxburg, U., editors, Advanced Lectures on
Machine Learning, Lecture Notes in Artificial Intelli-
gence, LNAI 3176, pages 146–168. Springer Verlag,
Berlin.
Cen, H., Koedinger, K., and Junker, B. (2006). Learning
factors analysis a general method for cognitive model
evaluation and improvement. In Intelligent Tutor-
ing Systems, volume 4053, pages 164–175. Springer
Berlin Heidelberg.
Drachsler, H., Hummel, H. G. K., and Koper, R. (2009).
Identifying the goal, user model and conditions of rec-
ommender systems for formal and informal learning.
Journal of Digital Information, 10(2).
Dunlavy, D. M., Kolda, T. G., and Acar, E. (2010). Tem-
poral link prediction using matrix and tensor factor-
izations. ACM Transactions on Knowledge Discovery
from Data. In Press.
Feng, M., Heffernan, N., and Koedinger, K. (2009). Ad-
dressing the assessment challenge with an online sys-
tem that tutors as it assesses. User Modeling and User-
Adapted Interaction, 19(3):243–266.
Garc
´
ıa, E., Romero, C., Ventura, S., and Castro, C. D.
(2009). An architecture for making recommendations
to courseware authors using association rule mining
and collaborative filtering. User Modeling and User-
Adapted Interaction, 19(1-2).
Ge, L., Kong, W., and Luo, J. (2006). Courseware rec-
ommendation in e-learning system. In International
Conference on Web-based Learning (ICWL’06), pages
10–24.
Ghauth, K. and Abdullah, N. (2010). Learning mate-
rials recommendation using good learners’ ratings
and content-based filtering. Educational Technology
Research and Development, Springer-Boston, pages
1042–1629.
Khribi, M. K., Jemni, M., and Nasraoui, O. (2008). Auto-
matic recommendations for e-learning personalization
based on web usage mining techniques and informa-
tion retrieval. In Proceedings of the 8th IEEE Inter-
national Conference on Advanced Learning Technolo-
gies, pages 241–245. IEEE Computer Society.
Kolda, T. G. and Bader, B. W. (2009). Tensor decomposi-
tions and applications. SIAM Review, 51(3):455–500.
Koren, Y. (2010). Factor in the neighbors: Scalable and
accurate collaborative filtering. ACM Trans. Knowl.
Discov. Data, 4(1):1–24.
Koren, Y., Bell, R., and Volinsky, C. (2009). Matrix factor-
ization techniques for recommender systems. IEEE
Computer Society Press, 42(8):30–37.
Manouselis, N., Drachsler, H., Vuorikari, R., Hummel, H.,
and Koper, R. (2010). Recommender systems in tech-
nology enhanced learning. In Kantor, P.B., Ricci, F.,
Rokach, L., Shapira, B. (eds.) 1st Recommender Sys-
tems Handbook, pages 1–29. Springer-Berlin.
Pardos, Z. A. and Heffernan, N. T. (2010). Using hmms and
bagged decision trees to leverage rich features of user
and skill from an intelligent tutoring system dataset.
KDD Cup 2010: Improving Cognitive Models with
Educational Data Mining.
Rendle, S., Freudenthaler, C., and Schmidt-Thieme, L.
(2010). Factorizing personalized markov chains for
next-basket recommendation. In Proceedings of the
MATRIX AND TENSOR FACTORIZATION FOR PREDICTING STUDENT PERFORMANCE
77

19th International Conference on World Wide Web
(WWW’10), pages 811–820, New York, USA. ACM.
Rendle, S. and Schmidt-Thieme, L. (2008). Online-
updating regularized kernel matrix factorization mod-
els for large-scale recommender systems. In Proceed-
ings of the ACM conference on Recommender Systems
(RecSys’08), pages 251–258, New York, USA. ACM.
Romero, C., Ventura, S., Espejo, P. G., and Hervs, C.
(2008). Data mining algorithms to classify students.
In 1st International Conference on Educational Data
Mining (EDM’08), pages 8–17. Montral, Canada.
Soonthornphisaj, N., Rojsattarat, E., and Yim-ngam, S.
(2006). Smart e-learning using recommender system.
In International Conference on Intelligent Computing,
pages 518–523.
Thai-Nghe, N., Busche, A., and Schmidt-Thieme, L.
(2009). Improving academic performance prediction
by dealing with class imbalance. In Proceeding of 9th
IEEE International Conference on Intelligent Systems
Design and Applications (ISDA’09), pages 878–883.
Pisa, Italy, IEEE Computer Society.
Thai-Nghe, N., Drumond, L., Krohn-Grimberghe, A., and
Schmidt-Thieme, L. (2010). Recommender system
for predicting student performance. In Proceedings of
the 1st Workshop on Recommender Systems for Tech-
nology Enhanced Learning (RecSysTEL 2010), vol-
ume 1, pages 2811 – 2819. Elsevier’s Procedia CS.
Thai-Nghe, N., Janecek, P., and Haddawy, P. (2007). A
comparative analysis of techniques for predicting aca-
demic performance. In Proceeding of 37th IEEE Fron-
tiers in Education Conference (FIE’07), pages T2G7–
T2G12. Milwaukee, USA, IEEE Xplore.
Toscher, A. and Jahrer, M. (2010). Collaborative filtering
applied to educational data mining. KDD Cup 2010:
Improving Cognitive Models with Educational Data
Mining.
CSEDU 2011 - 3rd International Conference on Computer Supported Education
78
