
ACCURACY IMPROVING ALGORITHM FOR WIRELESS 3D
LOCATING SYSTEMS
Maria Luisa Ruiz de Arbulo Gubía
*
, Toni Koskinen
+
, Marc Engels
*
Timo Lehikoinen
+
and Frederic Petré
*
+
VTT Technical Research Centre of Finland, Otaniemi, Helsinki, Finland
*
Flanders’ Mechatronics Technology Centre (FMTC), Leuven, Belgium
Keywords: UWB, Wireless locating, Attitude, Ubisense.
Abstract: In this paper we propose an approach to improve the object location accuracy and enable better attitude
estimation for wireless locating systems. This method combines the position data of multiple tags placed on
an object. The algorithm is independent of the technology used to measure the tags position or the methods
of pre-processing the data. The algorithm has been tested experimentally with an Ubisense system based on
ultra wide band (UWB) communication. It has been demonstrated that the accuracy can be improved by a
factor of three down to a couple of centimetres. This improved accuracy allows estimating not only the
location but also the attitude of an object.
1 INTRODUCTION
During the last years, applications involving wireless
locating and real time positioning are being adopted
by industry. Some examples are GPS technology
used in agricultural applications to locate the
machinery on the fields or the use of UWB Ubisense
modules in the automotive manufacturing industry.
When working in outdoor environments traditional
location systems are used, for instance GPS.
However, those systems are not available, reliable or
accurate enough when working with indoor
positioning. For this reason new solutions using
other technologies have been developed.
Due to its large bandwidth and robustness
against interferences, ultra-wideband technology
(UWB) is an ideal candidate to provide positioning
information in indoor environments (Dardari, 2009)
(Gezici, 2005). The UWB location system of
Ubisense consists of tags, location devices attached
to an object that allow it to be located by
broadcasting radio signals, and hubs, sensor devices
which generate location data corresponding to
tagged objects by measuring the time and angle of
arrival of these radio signals. Based on these
measurements, the position of the tags is next
estimated. With this technique it is possible to get an
accuracy of a couple of tens of centimetres, which
can be enough for multiple locating applications.
Nevertheless, for some applications this accuracy
may not be enough. Particular examples are the
applications in which it is necessary to determine the
attitude of an object. By placing three tags on an
object, it is possible to estimate the orientation of the
object in space. In this case, an error of some tens of
centimetres for each tag means an unacceptable
attitude error.
Some previous works, have tried to minimize the
location error by improving the hardware and the
applied locating technique itself (Zhang, 2008).
Others have focused on time filtering methods
(Muthukrishnan, 2009), which incurs a certain delay
before giving an accurate response. In this paper we
present a new real-time method that minimizes the
location error by using multiple tags. Because this is
independent of the technology used to measure the
object location, it can be applied to any positioning
measurement.
The paper is organised as follows. In Section 2,
we first introduce the experimental set-up used to
validate our approach. In Section 3, we analyze the
initial data gathered with our set-up. In Section 4, we
propose a novel algorithm to improve positioning
accuracy for attitude estimation: first a geometrical
approach and second an approach based on
optimization. This method has been experimentally
tested and validated and some initial results are
shown in Section 5. Finally, Section 6 summarizes
186
Ruiz de Arbulo Gubía M., Koskinen T., Engels M., Lehikoinen T. and Petré F..
ACCURACY IMPROVING ALGORITHM FOR WIRELESS 3D LOCATING SYSTEMS.
DOI: 10.5220/0003330201860190
In Proceedings of the 1st International Conference on Pervasive and Embedded Computing and Communication Systems (PECCS-2011), pages
186-190
ISBN: 978-989-8425-48-5
Copyright
c
2011 SCITEPRESS (Science and Technology Publications, Lda.)
our major conclusions.
2 EXPERIMENTAL SET-UP
Before proposing our approach, data from previous
works have been analysed and verified. To this end
and also to validate our approaches, an UWB-based
system from Ubisense has been used. This system
consists of four hubs placed at different positions,
the four corners of the experimentation room, one of
whom acts as a master for the other hubs and tags.
The four hubs are synchronised, so it is possible to
calculate the arrival time differences of the tag’s
signal to each of them (Ubisense, 2008). The master
is continuously sending a beacon, and when the tags
receive it, they send a broadcast packet. When the
hubs receive the broadcast packet, they are able to
measure both its Angle-of-Arrival (AoA) and Time-
Difference-of-Arrival (TDoA). Once they have
estimated this information, they send it to the
master, which will calculate the time-difference-of-
arrival between the hubs and will combine it with
the angle-of-arrival information to estimate the
position of the tag.
Although the Ubisense system can use different
kind of filters to improve the positioning of the
object, during this work all them have been
deactivated, so that what we get is the raw position
data. This means that the system has no memory, the
position is not traced and only data measured during
the current time slot are used.
The system includes an automatic calibration
option, which requires entering the three Cartesian
coordinates plus the pitch and yaw angles of every
hub. To avoid the complexity of getting all those
coordinates the calibration method described in
(Koskinen, 2010) has been used. It consists of
calibrating the system by measuring the position of
different tags whose position is known.
The update rate is 10 Hz, which means that the
tag position is measured every 100 ms,
corresponding with 4 time slots. In case the positions
of multiple tags are measured simultaneously, all
them are updated every 4 time slots; that is,
increasing the number of tags does not mean
reducing the update rate.
3 PREVIOUS WORK
Previous work done with the same experimental set-
up, demonstrated that the accuracy (variance)
obtained with the Ubisense modules in combination
with the calibration technique presented in
(Koskinen, 2010) is 15 cm. This has been measured
with a set up of four hubs and a single tag at a time.
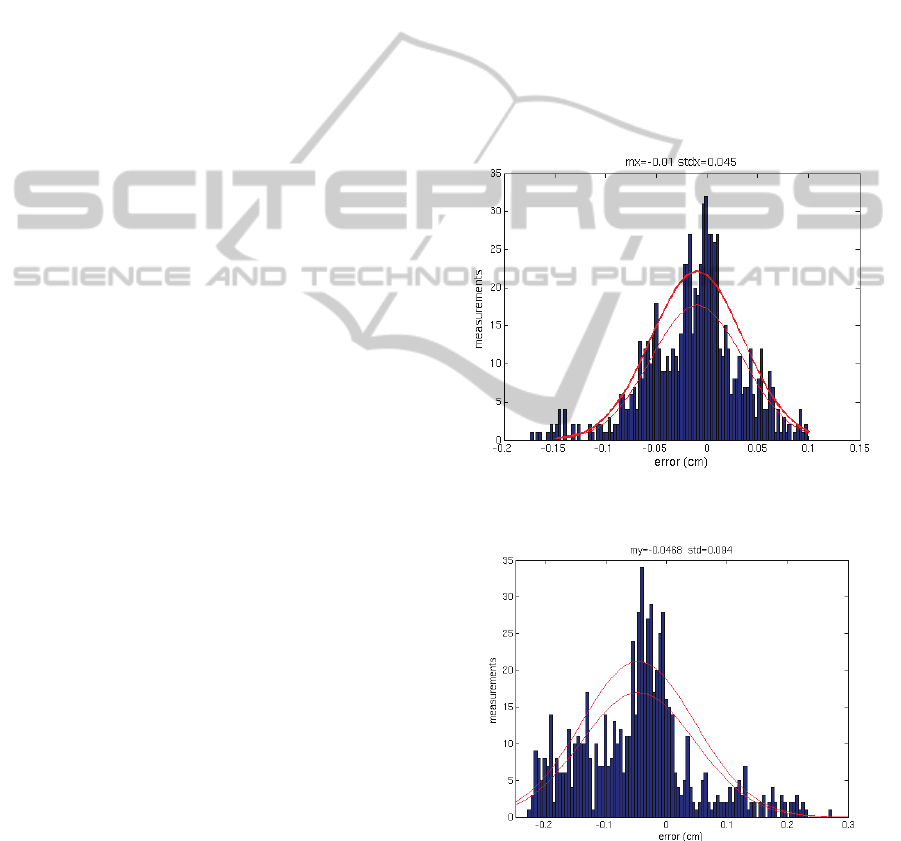
We have used these measurements to analyse the
estimated position error for every dimension (x, y
and z). The Gaussianity of the position error has
been checked by kurtosis. For the three dimensions
x, y and z the kurtosis are 4.01, 3.45 and 3.35,
respectively. As the kurtosis for a Gaussian
distribution is equal to 3, we could consider that the
error of one tag measurement with respect to the real
position follows approximately a Gaussian
distribution (Figure 1, 2, 3). Therefore, the error
resulting from combining multiple measurements
will also follow a quasi Gaussian distribution.
Figure 1: Histogram of the position error of the x
coordinates for 3000 measurements.
Figure 2: Histogram of the position error of the y
coordinates for 3000 measurements.
As a result, with our approach we will try to
improve the accuracy combining position data from
multiple tags, measured all them during the same
time frame.
ACCURACY IMPROVING ALGORITHM FOR WIRELESS 3D LOCATING SYSTEMS
187
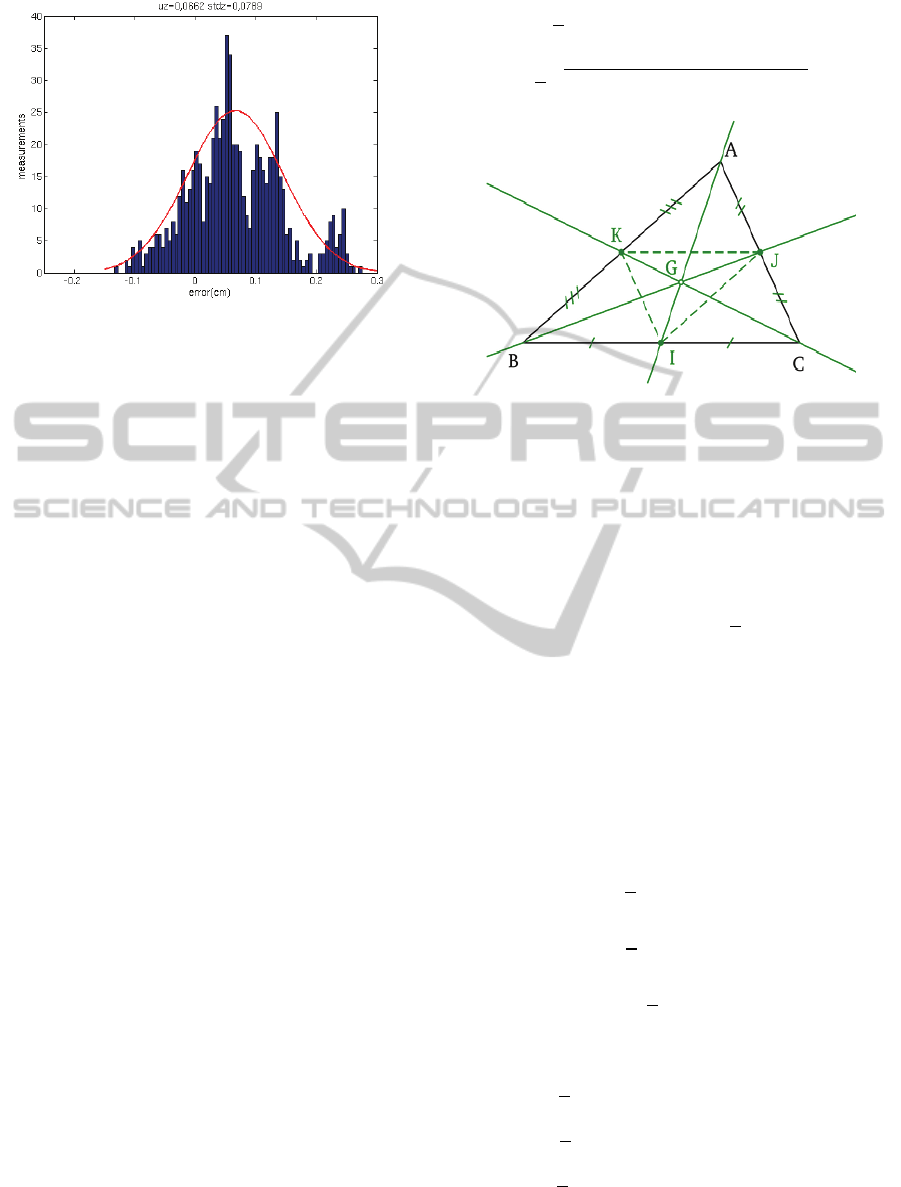
Figure 3: Histogram of the position error of the z
coordinates for 3000 measurements.
4 PROPOSED ACCURACY
IMPROVING ALGORITHM
To estimate the attitude of an object, 6 dimensions
are needed: the position, with its three coordinates in
the Cartesian coordinate system (x, y and z) and the
rotation around the three axes, pitch, yaw and roll.
To estimate all of them, it is necessary to measure
the position of, at least, three tags, which should be
placed on the object at a certain distance from each
other. To avoid erroneously getting the same
position for two tags, this distance should be equal
or larger than twice the accuracy obtained when
measuring the position of a single tag. Since this
accuracy is known to be 15 cm, the minimum
distance between two tags should be 30cm. More
precisely, we will assume that the three tags are
placed forming a triangle whose size and shape are
perfectly known.
Consider A, B and C the three tags (Figure 4).
From now on A
meas
, B
meas
and C
meas
will designate
the raw measured position of each tag and A
est
, B
est
and C
est
the estimated position of each tag.
As shown before, the measurement errors on
A
meas
, B
meas
and C
meas
follow a Gaussian distribution
with a given average and standard deviation σ
Ameas
,
σ
Bmeas
and σ
Cmeas
for each tag. It is assumed that for
each of them the errors on the three coordinates are
independent from the errors on the other tags. Next,
it is possible to estimate the position of the centroid
G of the triangle as the central point between the
three measured positions [Equation 1, 2].
Consequently, the position error on G
est
will also
follow a Gaussian distribution with standard
deviation σ
G
.
=
1
3
(
+
+
)
(1)
=
1
3
+
+
(2)
Figure 4: Triangle formed by the three tags, which are the
vertices A, B and C, with its centroid G and its three
medians.
As the three tags are placed on the object, also
the point G can be located as a real point on the
same object. This means that the position of G
indicates the position of the object itself. We can
see, then, that the position accuracy of the object is
already improved; in the theoretical case in which
σ
Ameas
= σ
Bmeas
= σ
Cmeas
it will be
√
3 times better than
the measured accuracy.
To get the attitude, however, this one point is not
enough. Instead, A, B and C should be estimated
while keeping this accuracy improvement. If we
split all four points in the three dimensions, A
est
=
[A
x
A
y
A
z
], B
est
=[B
x
B
y
B
z
], C
est
=[C
x
C
y
C
z
] and
G
est
=[G
x
G
y
G
z
], then it is possible to express the
estimated tag positions as a function of G
est
and
other geometrical parameters [Equation 3, 4, 5]
=
+
2
3
=
+
2
3
=
+
2
3
(3)
=
+
2
3
cos ( + )
=
+
2
3
sin ( + )
(4)
=
+
2
3
PECCS 2011 - International Conference on Pervasive and Embedded Computing and Communication Systems
188
=
+
2
3
cos ( + )
=
+
2
3
sin ( + )
=
+
2
3
(5)
The length of the medians passing by A, B and C
respectively are denoted as d
A
, d
B
and d
C
. As the size
and shape of the triangle is known also these
parameters are known. Also the angles α and θ are
known; these are the angles formed by two medians
and which vertex is the point G (Figure 5). The
remaining parameters, γ, β
a
, β
b
and β
c
, must be
estimated from the measurements. γ is defined as the
average of three angles that can be seen on the
projection of the triangle on the XY plane (Equation
6). A new Cartesian coordinate system is set with its
origin at the point G, then γ
a
is the angle formed by
the line GI and the axis x, is the angle for by GJ and
the axis x and by the line GK and the same axis.
Then γ is the average of the three angles.
=
1
3
(
+
(
−
)
+ (
− ))
(6)
The angles β
a
, β
b
and β
c
are the inclination angles of
each tag A, B and C measured from the z coordinate
(zenith direction) in the same coordinate system
used to estimate γ.
=
=
√
(7)
=
=
√
where =
≈
≈
The accuracy of all these angles depends on each
angle itself, the bigger the angle, the better.
Figure 5: Projection on the plane XY of the triangle
formed by the three tag A, B and C and angles formed by
its medians.
Using this geometrical approach improves the
locating accuracy of the object itself already three
times (for that only the position of G is necessary).
The accuracy of A
est
, B
est
and C
est
has also improved
considerably, although it will depend on the
orientation of the object.
5 MEASUREMENT RESULTS
To test the two methods we placed three tags
forming a triangle of known size and shape at
different locations and positions inside the coverage
area of the hubs.
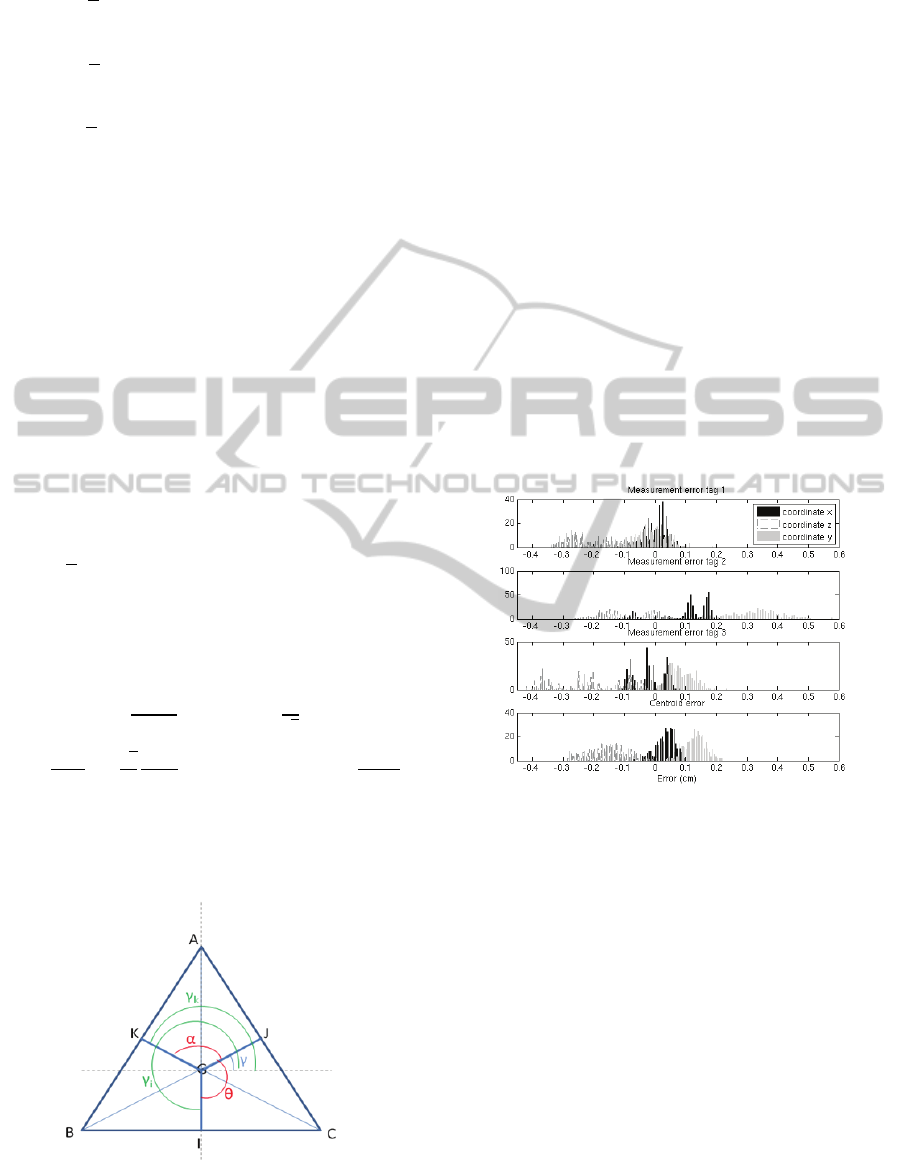
The position of each tag has been estimated by
using the geometrical approach. The following
graphs show the histogram of the measurements
errors for each of the three tags (Figure 6) and the
estimations errors and the error of the estimated
centroid (Figure 7) in relation to its theoretical
position.
Figure 6: Position measurements’ error for the three
coordinates.
Theoretically, we could assume that the standard
deviation of the error is the same for the three tags,
and then the expected standard deviation of the
centroid should be three times lower. However, in
practice the deviation of measurement error can be
different for each tag, so that the deviation of the
centroid error can be dominated by a tag whose
accuracy is much worse than the others. If we check,
for example, the dimension represented in solid
grey, we see the measurement for tag 1 to be better
than the estimation for the centroid; the reason is
that the results for tag 2 are quite poor and this
affects all the estimations. If we check now the
standard deviation of the estimated positions (Figure
7) we see that in the three cases it has improved at
least in one dimension.
ACCURACY IMPROVING ALGORITHM FOR WIRELESS 3D LOCATING SYSTEMS
189
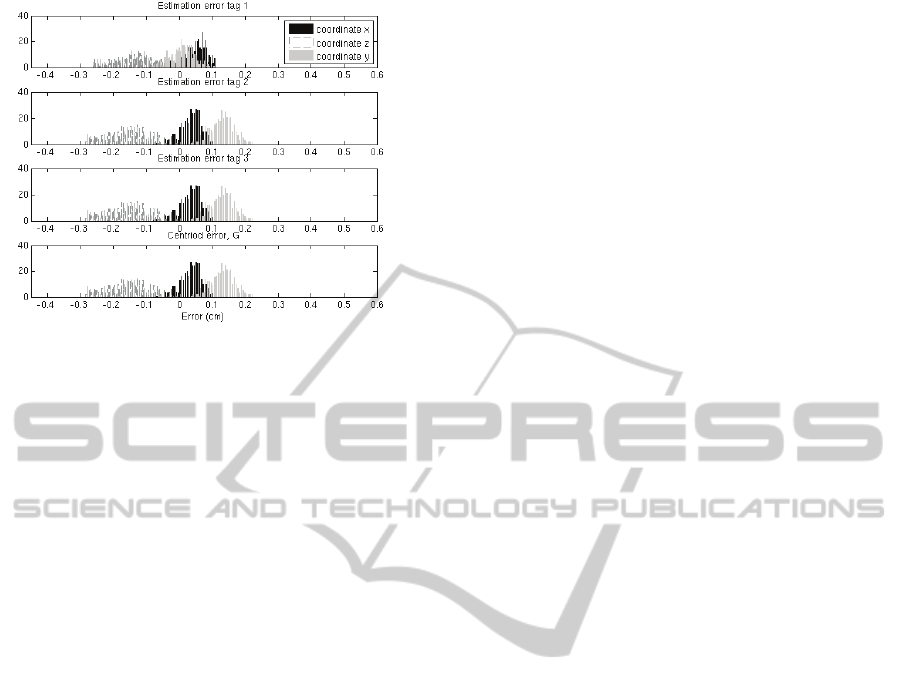
Figure 7: Position estimations’ error for the three
coordinates.
Notice that the error of each dimension is very
similar for every tag. This is due to the fact the same
values, the measured tags positions, are used to
estimate each of them.
Checking the numerical values it is possible to
see the deviation of the resulting estimated positions
to be just what we expected:
Tag 1:
Measurement error:
Mean (m): 0.0041 -0.1718 -0.0198
Std (m): 0.0359 0.1069 0.0590
Estimation error:
Mean (m): 0.0512 -0.1344 0.0096
Std (m): 0.0332 0.0654 0.0359
Tag 2:
Measurement error:
Mean (m): 0.1151 -0.0833 0.3270
Std (m): 0.0779 0.1001 0.0863
Estimation error:
Mean (m): 0.0348 -0.1562 0.1296
Std (m): 0.0332 0.0654 0.0359
Tag 3:
Measurement error:
Mean (m): -0.0148 -0.2136 0.081
Std (m): 0.0348 -0.1562 0.1296
Estimation error:
Mean (m): 0.0348 -0.1562 0.1296
Std (m): 0.0332 0.0654 0.0359
Theoretical standard deviation of the estimations
(metres): 0.0332 0.0654 0.0359
From these data we can see that the standard
deviation improves after applying the geometrical
approach. The object position can be known just by
estimating the centroid of the triangle formed by the
three tags; this means that the accuracy of the
positioning is improved. However, when checking
tag by tag, it can always happen that the
measurements’ accuracy on one of the tags is
considerably worse than the measurement on the
other two. In that case, as the three tags are used to
estimate the others, the accuracy of some of the tags
can be a bit worse than for the measurement. In any
case, the average of the three tag’s accuracy will be
better for the estimations than for the measurements.
6 CONCLUSIONS
In this paper, we have presented a novel approach to
improve the object location accuracy and to make a
better estimation of its attitude. Placing three tags on
the object we are able of obtaining its real time
position in the space with an accuracy that is three
times better.
The algorithm has been designed to be
independent of the location technology used and the
processing methods previously applied to the data.
The experimentation has been carried out using raw
data, so it is still possible to apply different kind of
filters to improve the accuracy even more or to trace
the trajectory of the object.
REFERENCES
Koskinen, T., Heikkila, T., and Lehikoinen, T., September
2010 “Flexible Calibration of Base Stations for Real-
Time Location Systems Based on Angle-of-Arrival
Measurements” Ubisense User Group Conference.
Dardari, D., Conti, A., Ferner, U., Giorgetti, A, Win, M.,
February 2009, “RangingWith Ultrawide Bandwidth
Signals in Multipath Environments”, Poceedings of
the IEEE, Vol. 97, No 2, pp. 404-426.
Gezici, S., Tian, Z., Giannakis, G., Kobayashi, H.,
Molisch, A., Poor, H., Sahinoglu, Z., July 2005
“Localization via Ultra-Wideband Radios” IEEE
Signal Processing Magazine, pp. 70-84.
Zhang, Y, Brown, A, Malik, W., Edwards, D., August
2008, “High Resolution 3-D Angle of Arrival
Determination for Indoor UWB Multipath
Propagation” IEEE Transactions on Wireless
Communications, Vol . 7, No. 8, pp. 3047-3055.
Muthukrishnan, K., Hazas, M., 2009, “Position
Estimation from UWB Pseudorange and Angle-of-
Arrival: A Comparison of Non-linear Regression and
Kalman Filtering” Fourth International Symposium
on Location and Context Awareness (LoCA 2009),
Co-located with Pervasive09, 7-8 May 2009, Tokyo,
Japan.
Ubisense LocationEngineConfig User Manual, November
2008.
PECCS 2011 - International Conference on Pervasive and Embedded Computing and Communication Systems
190
