
AN ONLINE EVALUATION OF EXPLICIT FEEDBACK
MECHANISMS FOR RECOMMENDER SYSTEMS
Simon Dooms, Toon De Pessemier
WiCa group, Dept. of Information Technology, IBBT-Ghent University
Gaston Crommenlaan 8 box 201, B-9050 Ghent, Belgium
Luc Martens
WiCa group, Dept. of Information Technology, IBBT-Ghent University
Gaston Crommenlaan 8 box 201, B-9050 Ghent, Belgium
Keywords:
Online evaluation, Explicit feedback, Recommender systems.
Abstract:
The success of a recommender system is not only determined by smart algorithm design, but also by the
quality of user data and user appreciation. User data are collected by the feedback system that acts as the
communication link between the recommender and the user. The proper collection of feedback is thus a
key component of the recommender system. If designed incorrectly, worthless or too little feedback may be
collected, leading to low-quality recommendations. There is however little knowledge on the influence that
design of feedback mechanisms has on the willingness for users to give feedback.
In this paper we study user behavior towards four different explicit feedback mechanisms that are most com-
monly used in online systems, 5-star rating (static and dynamic) and thumbs up/down (static and dynamic).
We integrated these systems into a popular (10,000 visitors a day) cultural events website and monitored the
interaction of users. In 6 months over 8000 ratings were collected and analyzed. Current results show that
the distinct feedback systems resulted in different user interaction patterns. Finding the right technique to
encourage user interaction may be one of the next big challenges recommender systems have to face.
1 INTRODUCTION
To be able to recommend the most interesting content
to users, user feedback is required. Users expressing
their preferences allow a recommender system to col-
lect data and build profiles needed for the generation
of recommendations. The user interface that is used
for this task is often referred to as the feedback sys-
tem. Bad design of a user interface can easily lead to
the fail on market (Vintila et al., 2010) and therefore
the feedback system has to be carefully considered.
The importance of choosing the right feedback
system is best illustrated by the results youtube.com
released in September 2009 regarding its 5-star rating
system
1
. These results showed that users tend to give
either really high (5 stars) or extremely low ratings (1
star) leaving the intermediate values practically un-
used. Consequently the use of a thumbs up/down sys-
1
http://youtube-global.blogspot.com/2009/09/five-stars-
dominate-ratings.html
tem seemed more appropriate and was rolled out to
the website.
Because the quality of the recommendation pro-
cess can be correlated to the effectiveness of the user
feedback, selecting the optimal feedback mechanism
is a vital task. A good feedback mechanism should
encourage users to interact while producing relevant
data for the system to work with.
Feedback can be collected in various ways. Three
distinct categories can be defined (Yu and Zhou,
2004) : Explicit input, explicit feedback and implicit
feedback. The strategy of explicit input is to present
the user with a list of questions (e.g. at registration).
The answers can be used to build a preliminary profile
of the user, bypassing the cold start problem (Burke,
2002). Explicit feedback mostly translates to asking
users to rate an item they have just consumed (down-
loaded, viewed, purchased, etc.). Both explicit input
as explicit feedback require the user to actively par-
ticipate in the feedback process. Implicit feedback on
391
Dooms S., De Pessemier T. and Martens L..
AN ONLINE EVALUATION OF EXPLICIT FEEDBACK MECHANISMS FOR RECOMMENDER SYSTEMS.
DOI: 10.5220/0003330403910394
In Proceedings of the 7th International Conference on Web Information Systems and Technologies (WEBIST-2011), pages 391-394
ISBN: 978-989-8425-51-5
Copyright
c
2011 SCITEPRESS (Science and Technology Publications, Lda.)
the other hand collects its information in the back-
ground by means of logging data or monitoring user
behavior.
A combination of implicit and explicit feedback
would be best (Srinivas et al., 2001; Jawaheer et al.,
2010) but there is no straightforward way of applying
it to events such as in our test case. This is because
we can’t monitor if users actually attended an event.
We focused on explicit feedback as it is widely
used (Amatriain et al., 2009) and can be applied to any
recommender system regardless of its content type.
Two typical explicit feedback mechanisms are the 5-
star rating system and thumbs up/down system. We
monitored and analyzed the behavior of users towards
these systems in a real online environment. We pro-
vided each system with a dynamic and a static imple-
mentation, so in the end four separate feedback mech-
anisms were compared.
2 THE EXPERIMENT
The goal of the experiment was to monitor the behav-
ior of users towards explicit feedback mechanisms as
used by online recommender systems. Related work
has already stated that recommender interfaces can
influence users’ opinions and therefore their ratings
(Cosley et al., 2003). There is however little knowl-
edge on the influence that design of feedback mech-
anisms has on the willingness for users to give feed-
back. We wanted to capture the popularity of each
system and track the interaction of users.
2.1 Online Evaluation
To do so, we integrated some custom feedback mech-
anisms into a popular (10,000 visitors per day) cul-
tural events website. This website contains details of
every cultural event that takes place in Flanders (Bel-
gium). With a large user base of over 13,000 reg-
istered users and a collection of more than 20,000
events, this website proved an appropriate platform
for the deployment of the feedback experiment.
Each event on the website has a dedicated web
page, listing detailed information on the whereabouts
and nature of the event. We expanded these event de-
tail pages with a custom built module that allowed
users to rate the events. Attention was given to graph-
ical design to ensure optimal integration in the general
look and feel of the website.
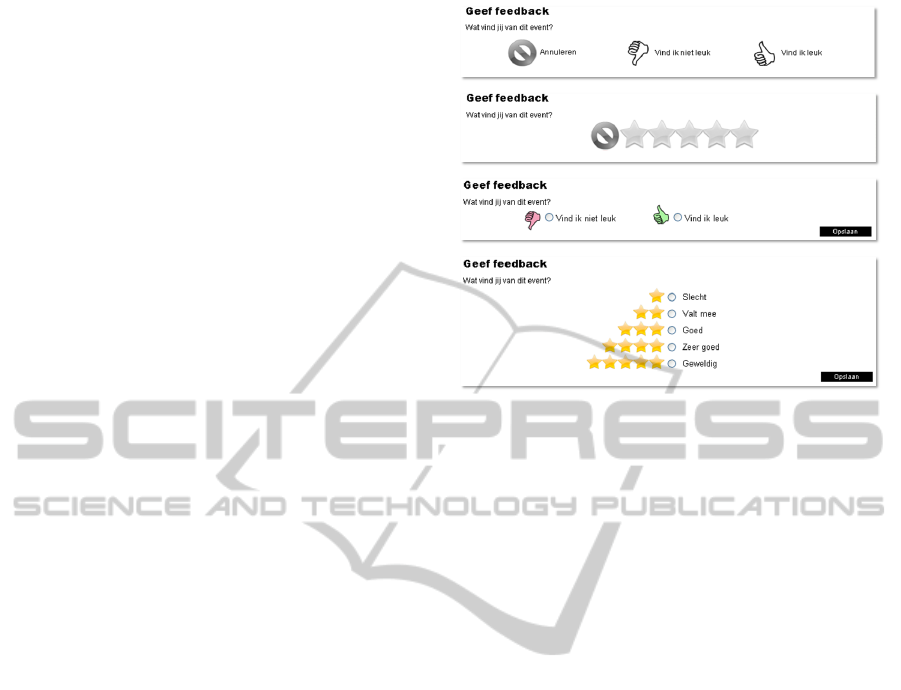
2.2 Four Explicit Feedback Mechanisms
We implemented four separate feedback systems: A
Figure 1: The four explicit feedback systems implemented
for this online evaluation experiment.
5-star rating system a thumbs up/down rating system
and each of them both static and dynamic (Figure 1).
The static rating systems were HTML form based.
The user had to select a radio button associated with
the desired rating and click a submit button to con-
firm. Doing so submitted the rating and caused a full
page refresh.
The dynamic systems used Javascript to capture
onclick events and displayed a small color changing
animation when hovered over the desired rating value.
Clicking a value submitted the rating in the back-
ground without any portion of the page refreshing.
2.3 Random Feedback Mechanism
To be able to compare the feedback mechanisms we
developed a module that incorporated all four mech-
anisms. For an accurate comparison, every single
mechanism needed to be displayed in the exact same
circumstances. We wanted to avoid any temporal ef-
fects and community influences that could render the
data unreliable.
The standard way of dealing with these issues
would be to employ an A/B test where visitors are
transparently divided in four groups each with their
own feedback system. We wanted however to track
individual user preferences towards all the systems
and so every user had to be able to use every system.
In our experiment every pageview showed a random
feedback system. That way every system receives an
equal number of views, they all share the same set-
tings of the experiment and users are not limited to
the same feedback system.
WEBIST 2011 - 7th International Conference on Web Information Systems and Technologies
392

3 EXPERIMENTAL RESULTS
For a period of 183 days between March 2010 and
September 2010 we logged all relevant data and an-
alyzed the ratings received by the module. In total
8101 explicit ratings were collected on 5446 unique
events.
3.1 Distribution of Rating Values
Figure 2 shows what the distribution of the rating val-
ues looks like for the 5-star rating mechanism. We
notice a similar trend as the youtube.com results. The
distribution shifts towards the more positive values for
both the dynamic and the static versions.
Figure 2: The distribution of the rating values for the 5-star
rating system.
We monitored the same outcome for the thumbs
rating system where 88% (=
3349
3795
) of the ratings were
thumbs-up values.
3.2 Most Popular Feedback Mechanism
Table 1 depicts which explicit feedback mechanism
collected the most feedback. We observe that the
static 5-star rating mechanism is the most popular
one, followed by the dynamic thumbs mechanism.
Table 1: The amount of ratings that each feedback system
collected during the evaluation period of 183 days.
5-Star Thumbs Thumbs 5-Star
(dynamic) (static) (dynamic) (static)
1330 1694 2101 2976
16% 21% 26% 37%
The dynamic 5-star rating mechanism showed to
be the least attractive one with less than half the rat-
ings of its static version. The average ratings each
system collected per day are for the dynamic 5-star,
static thumbs, dynamic thumbs and static 5-star sys-
tems respectively 7, 9, 11 and 16. The differences be-
tween each of these systems are significant according
to a one-tailed t-test, p < 0.01.
3.3 Static vs Dynamic
Figure 3 visualizes the difference of the number of
ratings collected from the static and dynamic feed-
back systems.
Figure 3: The amount of ratings that were given with either
a dynamic or a static feedback system for the 5-star (left)
and the thumbs up/down system (right).
We again observe that the static 5-star system pro-
cesses the most ratings, whereas the static and dy-
namic versions of the thumbs rating system show a
much smaller difference.
3.4 Amount of Ratings
We collected 8101 ratings in total. The number of
(event detail) pageviews that we logged during the
evaluation period comes down to a total of 1416510.
We define the feedback rate to be
f eedback rate =
# ratings
# pageviews
=
8101
1416510
= 0.6%
The feedback rate can be an indicator of how ac-
tively a feedback system is used. While the general
feedback rate of the experiment was 0.6% (i.e. 6
ratings for every thousand pageviews), the individual
feedback rates for the 4 systems as shown from left to
right in Table 1 are 0.37, 0.48, 0.59 and 0.84.
Since we allowed both anonymous users and reg-
istered users to give feedback, we were able to com-
pare their rating behavior. In Table 2 a comparison is
made between the feedback rates of anonymous users
and logged-in users.
While we see that in absolute numbers most of
the pageviews are originating from anonymous users
(98.5%), we like to point out that in the end 5% of
the ratings were still given by logged-in users. The
resulting feedback rates are 1.75% for logged-in users
and 0.55% for anonymous users.
To conclude we looked into a sparsity aspect of
the given ratings. Between March 2010 and Septem-
ber 2010 there were on average approximately 30,000
AN ONLINE EVALUATION OF EXPLICIT FEEDBACK MECHANISMS FOR RECOMMENDER SYSTEMS
393

Table 2: A comparison of the pageviews, ratings and feed-
back rate of anonymous users and users who were logged-
in.
Anonymous Logged-in
Pageviews 1395289 (98.5%) 21221 (1.5%)
Ratings 7730 (95%) 371 (5%)
Feedback rate 0.55% 1.75%
events available on the website. Only 18% (=5446) of
them were rated at least once. Of the 5446 different
events that were rated, 23% (=1238) was rated more
than once, the remaining 77% (=4208) in the tail was
rated exactly once.
4 CONCLUSIONS
In this paper we described an online experiment
on explicit feedback mechanisms as used in recom-
mender systems. On a popular cultural events website
we randomly allowed browsing users to use one of
four most common feedback systems for a period of
183 days. Results showed that the static 5-star rating
mechanism collected the most feedback, closely fol-
lowed by the dynamic thumbs up/down system. This
is somewhat unexpected because it was the oldest sys-
tem and supposed to be the least attractive one. We
assume this has in fact favored this system as it was
easier recognizable as a feedback system.
The 5-star systems failed however to produce
more accurate feedback than the thumbs systems. De-
spite the fact that the items in our platform are events
rather than movie content, we have seen that users
interacted with the 5-star rating system in a similar
manner as they did on the youtube.com site which is
to rate either very high or very low values. Motiva-
tions for this behavior are unclear. It is however likely
that users tend to give more positive feedback (e.g.
higher rating values) because they only look at items
that seemed appealing in the first place. Counterintu-
itive was that users do not seem to prefer the dynamic
systems over the static ones.
The feedback rate of users who were logged-in
was more than 3 times higher than for anonymous
users. Logged-in users seemed to be more actively
involved and were more keen to provide explicit feed-
back. Still we think recommender systems should
carefully consider what to do with anonymous users,
as we saw that they generated 98.5% of all traffic in
our experiment.
We believe the collection of feedback data to be
a very important part of the recommendation pro-
cess that is often overlooked. The best recommender
may fail if it lacks sufficient input data. We have
shown that the design of the feedback system influ-
ences the rate at which users provide feedback and
should therefore be taken into consideration by online
recommender systems.
In future research we will continue to collect data
and extend the experiment with incentives for users
to start (and continue) rating, and thus creating better
data quality for recommender systems. We also plan
to de-anonymize users by means of cookie tracking
and integrate implicit feedback into this research.
ACKNOWLEDGEMENTS
We would like to thank CultuurNet Vlaanderen
2
for
the effort and support they were willing to provide for
deploying the experiment described in this paper.
REFERENCES
Amatriain, X., Pujol, J. M., Tintarev, N., and Oliver, N.
(2009). Rate it again: increasing recommendation ac-
curacy by user re-rating. In RecSys ’09: Proceedings
of the third ACM conference on Recommender sys-
tems, pages 173–180, New York, NY, USA. ACM.
Burke, R. (2002). Hybrid recommender systems: Survey
and experiments. User Modeling and User-Adapted
Interaction, 12:331–370. 10.1023/A:1021240730564.
Cosley, D., Lam, S., Albert, I., Konstan, J., and Riedl, J.
(2003). Is seeing believing?: how recommender sys-
tem interfaces affect users’ opinions. In Proceedings
of the SIGCHI conference on Human factors in com-
puting systems, pages 585–592. ACM.
Jawaheer, G., Szomszor, M., and Kostkova, P. (2010). Com-
parison of implicit and explicit feedback from an on-
line music recommendation service. In HetRec ’10:
Proceedings of the 1st International Workshop on In-
formation Heterogeneity and Fusion in Recommender
Systems, pages 47–51, New York, NY, USA. ACM.
Srinivas, K. K., Gutta, S., Schaffer, D., Martino, J., and
Zimmerman, J. (2001). A multi-agent tv recom-
mender. In proceedings of the UM 2001 workshop
”‘Personalization in Future TV”’.
Vintila, B., Palaghita, D., and Dascalu, M. (2010). A new
algorithm for self-adapting web interfaces. In 6th In-
ternational Conference on Web Information Systems
and Technologies, pages 57–62.
Yu, Z. and Zhou, X. (2004). Tv3p: an adaptive assistant for
personalized tv. Consumer Electronics, IEEE Trans-
actions on, 50(1):393–399.
2
http://www.cultuurnet.be
WEBIST 2011 - 7th International Conference on Web Information Systems and Technologies
394
