
DETECTION OF POINTS OF INTEREST
FOR
GEODESIC CONTOURS
Application on Road Images for Crack Detection
Sylvie Chambon
Institut Franc¸ais des Sciences et Technologies des Transports, de l’Am´enagement et des R´eseaux (IFSTTAR)
Champs-sur-Marne, France
Keywords:
Detection, Segmentation, Thin structures, Road cracks, Point of interest, Geodesic contour, Auto-correlation.
Abstract:
A new algorithm of automatic extraction of thin structures in textured images is introduced, and, more specifi-
cally, is applied to detection of road cracks. The method is based on two steps: the first one consists in detecting
points of interest inside the thin structure whereas the second step connects the points with a geodesic contour
process. The main contribution of this work is the study of automatic detection of points of interest inside thin
structures in a high-textured background. The results are compared with a Markovian segmentation.
1 INTRODUCTION
This work concerns the detection of road cracks.
The threshold-based methods are simple but the re-
sults contain a lot of false detections (Koutsopoulos
and Downey, 1993). The methods based on mor-
phology allow to reduce false detections but strongly
depend on the parameter settings (Tanaka and Ue-
matsu, 1998). The learning-based methods alleviate
the problems of the two first categories (Oliveira and
Correia, 2008) but they need a learning phase which
is not well appropriate to the application. The filter-
ing methods are the most recent ones (Oliveira and
Correia, 2009). In (Chambon et al., 2010), we have
introduced a segmentation based on a wavelet de-
composition and a Markovian modelling. To have a
dense detection with less false detections, we intro-
duce a Geodesic Contour-based method with initial
automatic detection of Points Of Interest (GCPOID)
inside the thin structure. We present, first the data
set, second, the method GCPOID, and, the results and
conclusions.
2 DATA SET
Evaluation is done on 14 synthetic images and 42 real
ones. The synthetic images were built using, for 8,
a random dot texture and, for 6, real images without
cracks (2 with a static camera and 4 with a camera
embedded on a vehicle and controlled lights). The
(a) (b)
(c)
Figure 1: Tested images – one synthetic image (a), one real
i
mage with a simulated default (b) and one real image (c).
cracks were randomly added, with a random shape
and gray-levels (Figure 1). For real images, estimate
a reference segmentation is more complicated but the
images are more realistic than the synthetic ones. 4
experts have manually segmented the images and the
results are merged (Chambon et al., 2010). On the 42
real images, 17 were acquired using a static camera
and 25 using a dynamic system.
3 DESCRIPTION OF GCPOID
Existing methods have obtained quite good results,
particularly, with multiscale analysis (Chambonet al.,
2010). However, the results still present a lot of false
detections and incomplete detection of the cracks, see
Figure 2. Another way to deal with this problem is to
consider a sparse but reliable detection and, then, to
propagate this detection to obtain a dense detection.
In consequence, we propose a Geodesic Contour-
based method initialized by Points Of Interest Detec-
tion (GCPOID), an algorithm in 2-steps: (1) Detec-
tion of POIs (inside the cracks), (2) Propagation of
210
Chambon S..
DETECTION OF POINTS OF INTEREST FOR GEODESIC CONTOURS - Application on Road Images for Crack Detection.
DOI: 10.5220/0003333002100213
In Proceedings of the International Conference on Computer Vision Theory and Applications (VISAPP-2011), pages 210-213
ISBN: 978-989-8425-47-8
Copyright
c
2011 SCITEPRESS (Science and Technology Publications, Lda.)

the initial detection and the goal of this paper is to
propose a detector of POIs efficient for extracting thin
structures in textured environment.
IMAGE F379 IMAGE F382
Figure 2: Results obtained with Markovian Modelling
(MM) (Chambon et al., 2010) (in red) – This method is
based on a first step with adaptive filtering and a refinement
step with a Markov model-based segmentation.
Detection of POIs for Road Cracks – We suppose
that points inside the cracks are the POIs in the im-
age because the crack is a significant element of the
image, and, moreover, it is a high perturbation in the
road texture. Some existing detectors are based on
grey level, first derivatives of the image (Harris and
Stephens, 1988) or second derivatives (Lowe, 2004).
In this work, the most adapted detectors seem to be:
Harris operator and grey-level auto-correlation(noted
AC) (Moravec, 1977). As an important point of this
study, we detail and comment the auto-correlation de-
tector whose principle is:
The grey level of a point of interest must be low cor-
related to the grey levels of its neighbors:
R(p
i, j
) = fusion
(k,l)∈V(i, j)
M(f
ij
, f
kl
), (1)
R depends on f
ij
and f
kl
, the two vectors that con-
tain, respectively, the grey levels of the studied pixel
p
i, j
, and a neighbor pixel p
k,l
and their respective
neighborhoods, M corresponds to a similarity crite-
rion (correlation measure), ”fusion” is an operator
to merge the correlation scores in the neighborhood
V(i, j) of the studied pixel. In consequence, we have
to determined: (V), the size of the neighborhood,
V(i, j), (S), the correlation measure and the size of
the correlation window (f
i
) and (parameter F), the
fusion operator.
Parameter V – For POIs located inside fine cracks
on road images, it seems natural and appropriate to
take a 3× 3 square area centered on the studied pixel
for the size of V(i, j). A different size can be used in
an other kind of application.
Parameter S – We have studied the influence
of different correlation measures based on our
work (Chambon and Crouzil, 2003). For reason of
space, the experimentation is not described but it re-
veals the most appropriate measure, the Normalized
Cross Correlation (NCC), a scalar product between
the vectors f
ij
and f
kl
:
NCC(f
ij
, f
kl
) =
f
ij
· f
kl
kf
ij
kkf
kl
k
. (2)
The Zero mean NCC (ZNCC) has been used but this
centered version of NCC does not afford discrimina-
tive values for R(p
i, j
).
Parameter F – Three different kinds of fusion have
been proposed:
(1) MAX – When the POIs correspond to the high-
est dissimilarity in the neighbors, equation (1) be-
comes:
R(p
i, j
) = max
(k,l)∈V(i, j)
M(f
ij
, f
kl
). (3)
(2) MAX-MIN – We suppose that a crack POI has
the highest local dissimilarity but also the highest
local contrast and equation (1) becomes:
R(p
i, j
) = max
(k,l)∈V(i, j)
M(f
ij
, f
kl
)
− min
(k
′
,l
′
)∈V(i, j)
M(f
ij
, f
k
′
,l
′
).
(4)
(3) ORIENTATION – We suppose that the contrast
should be oriented and equation (4) becomes:
R(p
i, j
) =argmax
o
( max
(k
o
,l
o
)
M(f
i, j
, f
k
o
,l
o
)
− min
(k
o
,l
o
)
M(f
i, j
, f
k
o
,l
o
)),
(5)
where the orientation o corresponds to one possi-
ble orientation over [0;
π
4
;
π
2
;
3π
4
] and o = π + o.
For each detector, the N
p
first responses (global selec-
tion) are chosen for extracting the N
p
selected POIs.
The influence of N
p
is studied in § 4.
Geodesic Contour Propagation – The goal is to
find a curve that fits an object or a region by itera-
tively minimizing a cost or energy function, E, of the
curve C, defined by (Kass et al., 1988):
E(C ) =
Z
L
0
w
1
kC
′
(v)k
2
+ w
2
kC
′′
(v)k
2
+ P (C (v)
dv,
(6)
where c(v) represents a curve drawn on a 2D im-
age, [0, L] its domain of definition, and L the length
of the curve. The two first terms represent the inter-
nal forces (regularity of the curve) based on first and
second derivatives with w
1
, w
2
the weights of each of
these two parts. The third term is the external force,
P . These choices can be made:
(S
1
) P based on grey levels: P (C (v)) = I(v);
(S
2
) P based on the gradients: P (C(v) = g(k∇I(v)k)
where g is a decreasing function.
DETECTION OF POINTS OF INTEREST FOR GEODESIC CONTOURS - Application on Road Images for Crack
Detection
211
When the evolution curve is based on a planar curve
evolution, this is a particular case, the geometric con-
tours (Delagnes and Barba, 1995) that are the most
efficient in the presence of topology changes. To com-
bine the advantages of both methods (active and geo-
metric contours) geodesic contours (Cohen and Kim-
mel, 1997) have been introduced. In fact, it is a par-
ticular case of active contours where equation (6) be-
comes:
E(C ) =
Z
ω
kC
′
(v)k
2
+ P (C (v)
dv, (7)
In examining the shape of the element to detect, it
seems very natural to use the geodesic contours algo-
rithm and shape (S
1
) has been chosen for P . Indeed,
the energy function associated to the curve depends
on the grey levels (for the external force) instead of
the gradients (that are not significant in this kind of
images that are highly textured). A Fast Marching al-
gorithm is used for the optimisation. Moreover, we
suppose that the cracks are not opened. To rely the
N
p
POIs , denoted by p
i
, i ∈ {1;. . . ;N
p
}, we link the
points two by two, by pairs of nearest points:
1. G ← {p
i
}
2. p ← argmin
p∈G
kp
(0,0)
− pk
where p
(0,0)
is the origin of the image
3. While G 6=
/
0 do
(a) G ← G − {p}
(b) p
2
← argmin
p
2
∈G
kp− p
2
k
(c) estimate C between p and p
2
(d) p ← p
2
4 EXPERIMENTAL RESULTS
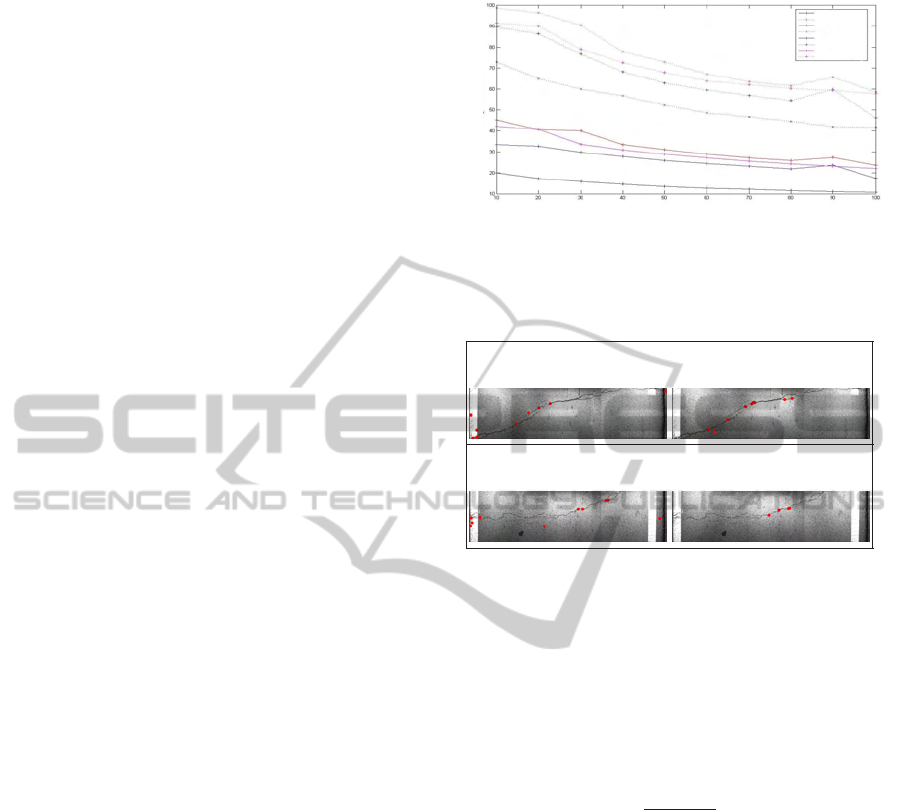
Detection of Points of Interest – The results, cf.
Figure 3, show that for each method, the best results
are obtained when n = 10, and the larger the number
of POIs, the larger the errors. The maximal percent-
age of detections is always found with a window of
size 3 × 3. Moreover, auto-correlation always gives
better results than Harris, and, the best operator fu-
sion is the maximum. The orientation fusion leads
to results similar to those of the maximum. For 38
images (over the 55 tested), we obtained from 80%
to 100% of points that are well detected inside the
cracks. There is no image (over the 55), with a 3× 3
window size, where Harris is the best.
Crack Detection – These two methods are com-
pared: the proposed method GCPOID and the pre-
vious method based on Markovian Modelling and de-
noted by MM (Chambon et al., 2010). These criteria
Number of points of interest that are selected
Harris
Percentage of correct detections
NCC
MaxMin
Orientation
Figure 3: Percentage of POIs detected inside cracks – The
m
ean (solid line) and the maximum (dotted line) percent-
ages are computed with all the results obtained with the 55
images.
IMAGE F379
Harris Auto-correlation
IMAGE F382
Harris Auto-correlation
Figure 4: Detection of POIs (in red) in road images – The
left results are obtained with the detector of Harris whereas
the right, with the auto-correlation (AC) operator. For AC,
there is no errors, i.e. no POIs detected outside the cracks.
are used in order to compare the results: (1) the per-
centage of correct matches (TP), (2) the percentage
of false negatives (FN) which corresponds to pixels
that are not detected as cracks whereas they are inside
a crack, (3) the similarity coefficient or Dice similar-
ity, DICE, defined by:
2TP
FN+TP+P
, where P represents
the number of pixels that have been detected as crack
pixels. This criterion illustrates the proportion of cor-
rect detections compared to the whole detection and
it is important for our application because we want
to have an accurate and complete detection of the de-
faults. The higher the Dice (with maximum 1), the
better the result.
In the results of GCPOID, for all the images with
a percentage of correct detections of POIs of 100%
(27), there is very few false detections. Unfortunately,
the detection of the crack is incomplete. For the im-
ages with more than 80% of correct detections inside
the cracks, the results are also interesting, i.e better
than our initial method MM, cf. figure 5.
In Figure 6, a global analysis over all the tested
images is given. It highlights these two facts:
(1) GCPOID outperforms MM for the percentage of
correct matches (TP) ;
VISAPP 2011 - International Conference on Computer Vision Theory and Applications
212
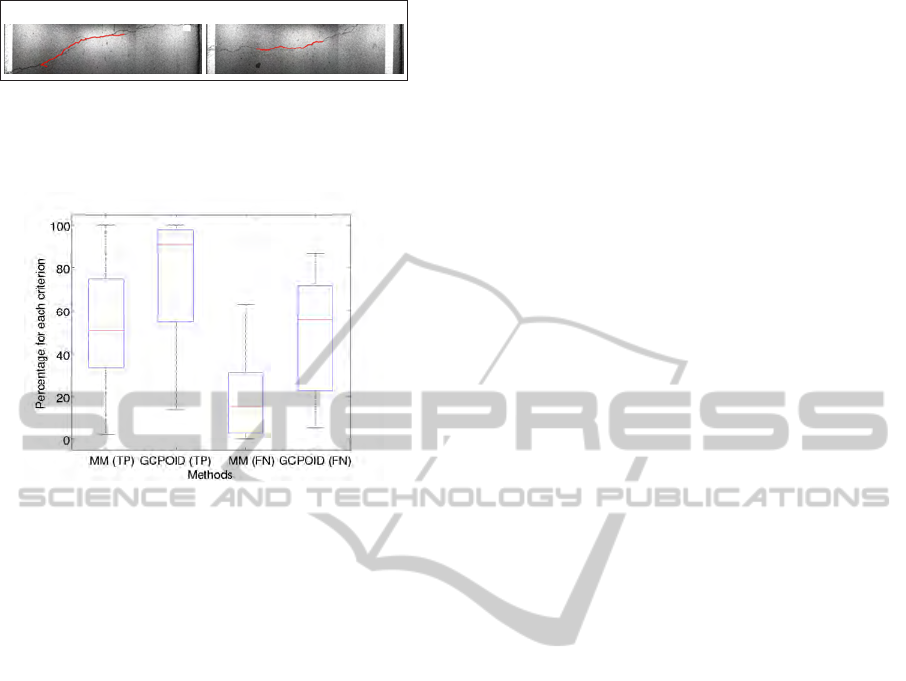
IMAGE F379
IMAGE F382
Figure 5: Detection of road cracks with GCPOID – The
POIs, obtained with AC (NCC), are linked in red with
geodesic contours. Detection is incomplete but with very
few false detections when there is no wrong POI.
Figure 6: Results obtained with GCPOID and MM – These
results are represented by boxes with one box for each cri-
teria (TP, true positives, and FN, false negatives) and each
method. The boxes have lines at the lower quartile, the
minimum, the median, the maximum and the upper quar-
tile. These results show that the median of the percentages
of correct detections is highly improved with GCPOID, be-
cause it becomes 90.54% against 50.68% for MM whereas
the percentage of false negatives for GCPOID is higher (the
median is 55.63%) than for MM (the median is 15.68%).
(2) On the contrary, MM obtains lower percentages
of false negatives (FN) than with GCPOID.
This is why the mean Dice similarity is better with
MM, 0.54, than with GCPOID, 0.46. However, the
result with GCPOID is reliable: the mean of the cor-
rect detections reached 74.43% (MM obtained only
50.89%). In consequence, we can consider that we
have reached our first goal: to obtain very few false
negatives. The second aim (complete detection) can
be obtained if we try to propagate the results of the
detection at the extremities of the crack detection, see
image F382 in Figure 5.
5 CONCLUSIONS
We introduced a new method of road crack detec-
tion based on two steps: automatic detection of
POIs followed by the estimation of geodesic con-
tours. The study reveals the most appropriate detec-
tor of POIs (by introducing the principle and the pa-
rameter settings): auto-correlation detector with nor-
malised cross correlation and fusion with the maxi-
mum. Moreover,we demonstrate the interest of using
geodesic contours for the final detection by compar-
ing to a Markovian segmentation.
Our future work will focus on how adding more
POIs (to have a complete/dense detection), with
the combination of prefiltered images with auto-
correlation detection, and how removing wrong POIs,
by adding some constraints (based on the variation
of grey levels in the neighborhood or on the shape
of the curves determined by each pair of POIs). For
the geodesic contours, we will propose a more real-
istic algorithm for connecting the POIs (possibility to
connect one point with numerous others, to remove a
point if the energy is low with all the paths passing
through this point).
REFERENCES
Chambon, S. and Crouzil, A. (2003). Dense matching using
correlation: new measures that are robust near occlu-
sions. In BMVC, volume 1, pages 143–152.
Chambon, S., Gourraud, C., Moliard, J., and Nicolle, P.
(2010). Road crack extraction with adapted filtering
and markov model-based segmentation – introduction
and validation. In VISAPP.
Cohen, L. and Kimmel, R. (1997). Global minimum for ac-
tive contour models: A minimal path approach. IJCV,
24(1):57–78.
Delagnes, P. and Barba, D. (1995). A markov random field
for rectilinearstructure extraction inpavement distress
image analysis. In ICIP, volume 1, pages 446–449.
Harris, C. and Stephens, M. (1988). A combined corner and
edge detector. In Alvey Vision Conf., pages 147–151.
Kass, M., Witkin, A., and Terzopoulos, D. (1988). Snakes:
Active contour models. IJCV, 1(4):321–331.
Koutsopoulos, H. and Downey, A. (1993). Primitive-based
classification of pavement cracking images. Journal
of Transportation Engineering, 119(3):402–418.
Lowe, D. (2004). Distinctive image features from scale-
invariant keypoints. IJCV, 60(2):91–110.
Moravec, H. (1977). Toward automatic visual obstacle
avoidance. In IJCAI, volume 2, page 584.
Oliveira, H. and Correia, P. (2008). Supervised strategies
for cracks detection in images of road pavement flexi-
ble surfaces. In EUSIPCO.
Oliveira, H. and Correia, P. (2009). Automatic road
crack segmentation using entropy and image dynamic
thresholding. In EUSIPCO.
Tanaka, N. and Uematsu, K. (1998). A crack detection
method in road surface images using morphology. In
Machine Vision Applications, pages 154–157.
DETECTION OF POINTS OF INTEREST FOR GEODESIC CONTOURS - Application on Road Images for Crack
Detection
213
