
WEB-BASED EXPLORATION OF TEMPORAL DATA
IN BIOMEDICINE
Martin J. O’Connor, Mike Bingen, Amanda Richards, Samson W. Tu and Amar Das
Stanford Center for Biomedical Informatics Research, Stanford University, Stanford, CA 94305, U.S.A.
Keywords: Temporal reasoning, Temporal visualization, OWL, SWRL, SQWRL.
Abstract: A growing number of biomedical researchers must analyze complex patterns in time-course or longitudinal
data. Researchers commonly use Excel, SAS or custom programs to query for relevant patterns in their data.
However, these approaches typically entail low-level method development. Analyses are tailored to a
specific data set and research question, and they cannot be easily modified or shared. As a result, there is a
need for tools to facilitate the specification of temporal analyses at a high level. Such tools would hasten the
development process and produce reusable methods. We have developed a web-based application called
SWEETInfo to meet this need. Investigators can use it to collaboratively manipulate, explore, and visualize
temporal data. Our tool combines semantic web technologies such as OWL and SWRL with a variety of
standard web technologies. SWEETInfo can generate complex temporal analyses interactively. It also
supports publication of descriptions of analyses, and allows them to be easily shared with others and
adapted by them. We evaluated this tool by replicating a longitudinal study of drug effectiveness for HIV
anti-retroviral therapy.
1 INTRODUCTION
The temporal dimension of data is often central in
biomedical research questions. Answering these
questions typically requires generating complex
temporal criteria. For example, a question might
combine temporal durations at multiple granularities
(“Did a patient have elevated blood pressure for
more than three days in the past month?”), queries
with aggregates (“What was the average post-
breakfast blood sugar level of a patient over the last
ten days?”), and the use of periodic patterns (“Did a
patient have more than one three-week interval of
drug treatment followed by a suppressed viral load
lasting at least a week?”). Encoding these questions
is difficult using current tools. Although commonly-
used tools such as SAS and R support complex
analysis strategies, they offer very poor support for
expressing temporal criteria. They generally support
only simple instant-based timestamps and a small set
of basic temporal functions. A key shortcoming is
that they lack a temporal model. Hence, there is no
principled means of associating a piece of
information with its temporal dimension. The end
result is that temporal criteria have to be expressed
at a very low level and customized to the details of
the source data layout and structure. Even minor
layout changes to data can require recoding and
reanalysis. Expressing non-trivial criteria, and, in
particular, developing the multi-layered analyses
that are common in biomedicine, requires
customized analysis routines.
Current analysis tools also do not exploit the
advantages offered by the increasing use of
ontologies in biomedicine. Many ontologies provide
standardized definitions of concepts in particular
biomedical domains (e.g., SNOMED, 2010, Gene
Ontology, 2010) and can be used in applications to
help provide domain-level reasoning with data. At a
minimum, ontology term linkage would help capture
the domain of discourse in an analysis. Leveraging
these technologies would also provide an approach
to elevate the data representation and reasoning
level. Current tools also do not exploit the
opportunities provided by the web for publishing
and sharing analyses. Many recent web applications
are built around the idea of collaboration, sharing
and reuse. Coupled with the use of ontologies,
analysis tools that adopt collaborative web
technologies can help support easier analysis
development and sharing.
There is a clear need for tools that facilitate the
352
J. O’Connor M., Bingen M., Richards A., W. Tu S. and Das A..
WEB-BASED EXPLORATION OF TEMPORAL DATA IN BIOMEDICINE .
DOI: 10.5220/0003348903520359
In Proceedings of the 7th International Conference on Web Information Systems and Technologies (WEBIST-2011), pages 352-359
ISBN: 978-989-8425-51-5
Copyright
c
2011 SCITEPRESS (Science and Technology Publications, Lda.)

specification of temporal analyses at a higher level.
To address this need, we developed an application
that allows researchers to interactively develop
temporal analysis that can be published and shared
with other researchers. The application, Semantic
Web-Enabled Exploration of Temporal Information
(SWEETInfo), is a web-based tool that lets
investigators collaboratively manipulate, explore and
visualize temporal data. It combines semantic web
technologies such as OWL (McGuinness and van
Harmelen, 2004) and SWRL (Horrocks et al., 2004)
with a variety of standard web technologies
SWEETInfo is based on a temporal information
model; it provides a standardized means of
representing all information in a system. This model
provides a principled basis for developing a variety
of temporal reasoning methods. It aims to provide
investigators with a reusable architecture for
querying temporal patterns and abstracting them.
2 RELATED WORK
The importance of temporal data in biomedicine has
driven the development of a number of custom
temporal management applications. One of the
earliest systems was KNAVE, which allowed users
to visualize time series data for patients in an
electronic medical record system. Its later iteration,
KNAVE II (Shahar et al., 2005) extended this work
to support simultaneous viewing of multiple patient
time series. Although its visualization configurations
were very flexible, the specification of
transformations on the data itself was limited. The
system required low-level setup of data using a
domain-specific ontology before it could be viewed
by the system.
VISITORS (Klimov et al., 2010), a recent
extension of the KNAVE work, allows users to
define temporal patterns dynamically, although
defining temporal patterns still requires considerable
domain and ontology expertise. All three
applications were desktop-based.
Recent general-purpose web-based systems
include the MIT SIMILE project (SIMILE, 2010)
and IBM's Many Eyes (Many Eyes, 2010). These
systems support very rich display of temporal data.
However, both provide weak support for expressing
temporal patterns or viewing population-level data.
For example, SIMILE cannot define repeated events.
Many Eyes supports detailed display individual time
series, but users cannot load, visualize, and compare
multiple time series.
Commercial systems include LabVIEW (Lab-
VIEW, 2010) from National Instruments and
Pipeline Pilot from Accelerys (Pipeline Pilot, 2010).
LabVIEW provides a flowchart-based graphical
programming environment that allows users to
create data analysis and visualization processes. It
has a library of hundreds of common sensors, and
also includes a large set of engineering-specific
processing functions, such as frequency analysis and
curve fitting routines. Pipeline Pilot is similar. It
provides interactive construction of data analysis
workflows using a component library. It was
initially targeted at laboratory data analysis in the
life sciences, but has now expanded to other fields.
A general shortcoming of these systems is that they
do not easily support the generation of complex data
analyses by non-specialist users. Also, apart from
supporting predefined time series processing
routines, they are weak in generating ad hoc
temporal queries.
3 SWEETInfo SYSTEM DESIGN
Operations are the system’s basic set of data
transformations. Each one was designed to be simple
enough to be defined using straightforward forms-
based dialogs. They were also designed to be easily
combined with other operations in a sequence. In
this way, users can build complex functionality from
relatively simple operations. The choice of operators
was driven by a process that identified common
selection criteria from a range of biomedical
publications. We concentrated on source documents
that contained rich temporal criteria, including
clinical trial eligibility documents and longitudinal
studies of drug treatment. The goal was to select
operators that were rich enough to express the
common temporal and basic non-temporal criteria in
these studies. We decided to omit statistical criteria
from the initial set of operations.
3.1 Operations
We identified an initial set of four generalized
operations necessary to express criteria commonly
found in the literature. They are:
Filter Operations. Filtering separates a defined
subset of data out of a larger dataset. A filtering
operation is used to specify the desired criteria. We
provide four filtering criteria. They are value criteria,
which can express basic equality or inequality criteria
on numeric or string data, aggregate criteria, which
can filter on the count, average or maximum or
WEB-BASED EXPLORATION OF TEMPORAL DATA IN BIOMEDICINE
353

minimum of data, and two forms of temporal
constraints. They are duration criteria, which can
select data based on the length of time between two
time points, and timing criteria, which support a
range of temporal criteria using standard Allen
operators (Allen, 1983). Both support operations at
multiple granularities. In addition, instances of these
four criteria can be composed in a single filter
operation (conjunctively or disjunctively) to build
complex selections of data. The four criteria can also
be used when defining the other three operations.
Grouping Operations. Dividing patients into
groups is common when analyzing data. Patients can
be grouped into related categories (e.g., short,
medium, tall), which are then analyzed in different
ways. A grouping operation allows users to define a
set of named groups meeting different sets of
criteria. Each group is specified using a criteria set,
and data for each group is generated from the subset
of input to a grouping operation that meet its
associated criteria.
New Variable Operations. SWEETInfo uses
variables to define data elements associated with
patients (e.g., blood pressure, viral load; see Section
4.2). Variables are the basic units used when
transforming data in SWEETInfo. Eeach patient.
This operation defines a new variable by creating a
restriction on an existing data. For example, a High
RNA variable is defined by selecting RNA values
that are greater than some number, using a value
criterion. Alternatively, a temporal duration criterion
could be used to find patients who had been treated
with a particular drug for longer than one month.
Temporal Context Operations. Defining temporal
patterns is a central requirement when working with
temporal data. Temporal context operations are basic
building blocks in this regard because they allow
users to specify periods that meet a certain pattern.
For example, if a user is interested in post-surgical
patient outcomes, he could create a new temporal
context to represent the period from the beginning of
a hospitalization to 30 days after release. This
context could be used more specifically in
subsequent operations, such as a review of
orthopedic surgeries only. This operation allows
complex temporal criteria to be built iteratively from
a smaller set of simple criteria.
Operations in SWEETInfo ultimately specify the
action taken when certain conditions are met. The
conditions are specified using a criteria set. Each
operation has an associated creation dialog, which
has four subtabs, one for each criteria type. Users
can specify criteria interactively, and, on creation,
they are displayed in summary form (see Figure 1).
3.2 Visualizations
Users can immediately execute an operation that
they have defined and examine the results in a set of
graphical displays, which show population-level
data. They can also drill down to examine individual
patient data. The population-level view provides a
simultaneous display of data for multiple patients.
The view node can also provide summary statistics
for an operation. For example, the number of
patients who have satisfied certain analysis criteria
can be seen in the view node summary statistics.
SWEETInfo provides customized displays for
different types of temporal data, and allows users to
customize display options. After viewing the data, a
user can modify operations in a pipeline immediately
or define additional operations. Users can also define
branching points using filter and group operations to
define parallel analysis paths. The immediate visual
feedback and the ability to quickly modify or extend
pipeline operations allows rapid analyses.
3.3 Pipeline
Biomedical studies are often presented as step-by-
step processes where data are iteratively refined. To
replicate this workflow, we used a pipeline-based
representation of analyses (Figure 2). A pipeline is
composed of chained operation-view pairs. This
approach allows users to see intermediate results of
the step-by-step operations that generate the overall
analysis. Multiple parallel paths can be defined with
filter and grouping operations. A visualization node
is automatically produced by each operation and can
be used to explore data. It can also be used to
summarize the number of patients meeting criteria at
each stage of the pipeline. Each view node can also
be opened to view detailed displays of the data.
3.4 Projects
SWEETInfo includes a project-based mechanism
that allows users to save their analyses and pipeline
definitions. It supports multiple projects per user,
with each project holding a data set and a pipeline.
This mechanism allows users to store, reload, and
execute the analyses defined in a pipeline.
SWEETInfo also allows users to share pipelines
with other users, which allows execution of pre-
defined analyses. Additional fine-grained sharing is
also provided. Each operation node, which can
define a set of complex constraints, can be shared. A
WEBIST 2011 - 7th International Conference on Web Information Systems and Technologies
354
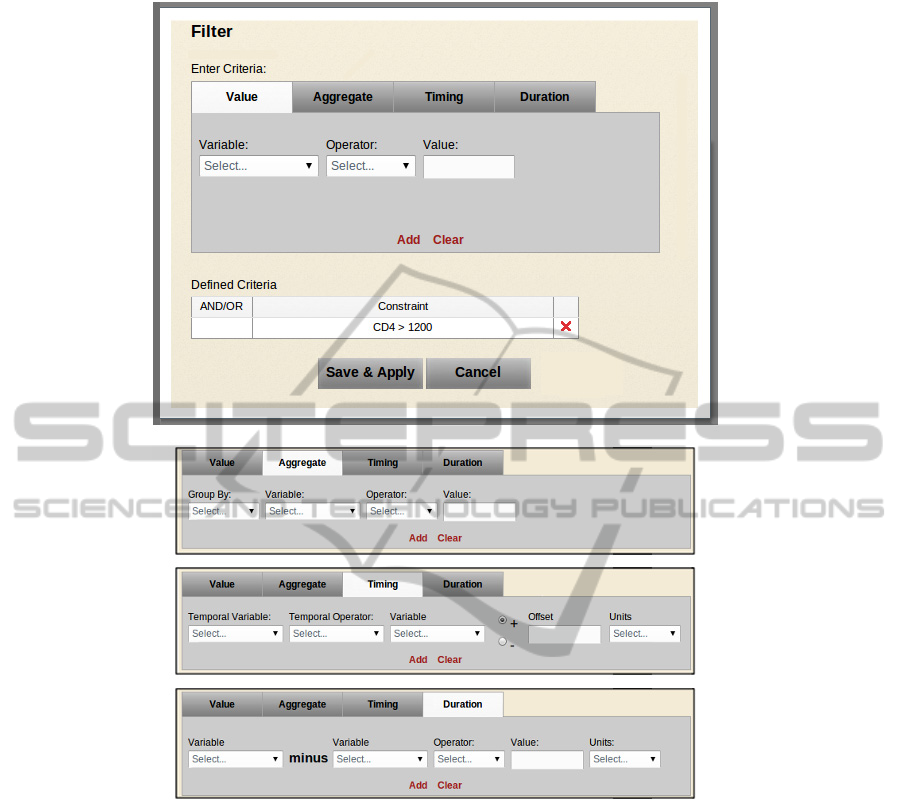
Figure 1: Top view: a filter operation creation dialog showing a Value Criterion definition tab, which is one of four
constraint definition tabs. Any criteria previously defined for the operation are shown in summary form below the tabs.
Bottom views: upper portion of aggregate, timing and duration tabs.
library of operations can be maintained for each
userand selectively shared. Shared operations can be
easily modified to deal with similar data sets.
4 SWEETInfo INFORMATION
ARCHITECTURE
SWEETInfo uses an OWL-based information model
to represent all the user data in the system. The
information model is built using a temporal model
that we have used successfully in other systems
(O’Connor and Das, 2010b). We used SWRL and
the SWRL-based OWL query language SQWRL to
encode and execute all operations in SWEETInfo
using this model. This approach provides a
declarative representation of all transformations that
can be performed in the system.
4.1 Temporal Model
When time-based analysis is important, a principled
temporal model is key because it enforces a
consistent representation of temporal information in
a system. One important result of research in the
area of temporal data representation is convergence
on the valid-time temporal model (Snodgrass, 1995).
Although numerous models have been used to
represent temporal information in relational
WEB-BASED EXPLORATION OF TEMPORAL DATA IN BIOMEDICINE
355
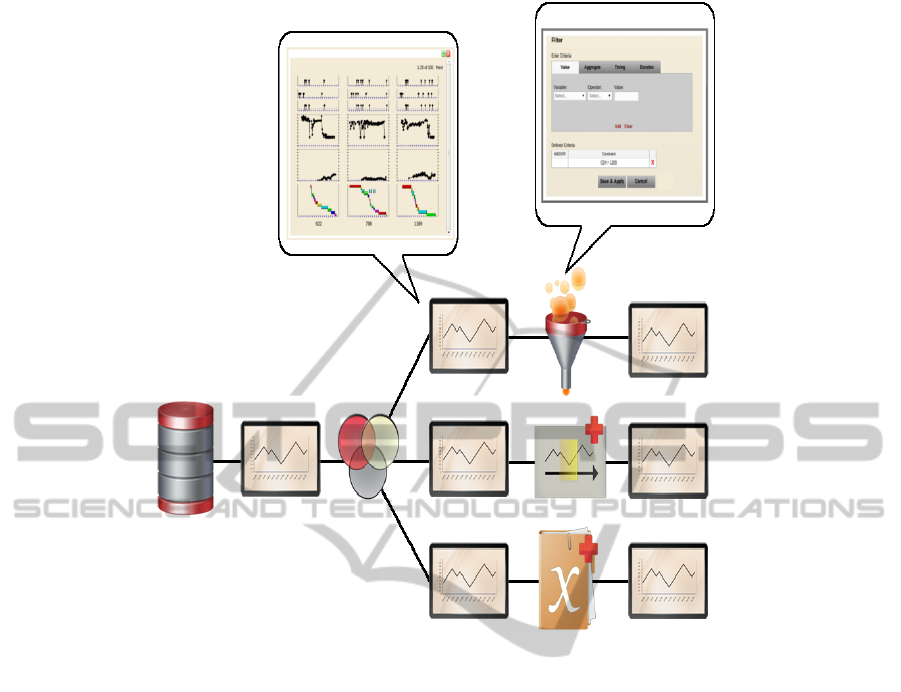
Figure 2: An analysis pipeline defined in SWEETInfo. A data source node feeds a group operation, which creates three
parallel analysis paths. The top path contains a filter operation, the middle path contains a time-context operation, and the
lower path contains a new variable operation. The output of each operation can be explored using a view node, which
generates population view displays. These can be further expanded to view data for individual patients. Operation nodes can
also be expanded to view and edit their criteria sets. The result is a system that allows users to define a data analysis path
with a set of data transformations defined using the four operations described above. These transformations can be applied
along multiple parallel paths which can be saved, reused, or shared.
databases and other information systems, we
selected this one because it couples simplicity with
considerable expressivity. We adopted an OWL-
based representation of this model in SWEETInfo
(O’Connor and Das, 2010a). This model is used to
encode the temporal dimension of all user data. It
facilitates the consistent representation of temporal
information in OWL, thus allowing standardized
approaches to temporal reasoning and querying. In
this model, a piece of information—which is often
referred to as a fact—is associated with instants or
intervals denoting the times that the fact is held to be
true. Facts have a value and one or more valid-times.
Conceptually, this representation means that every
temporal fact is held to be true during its associated
time(s). No conclusions can be made about the fact
for periods outside of its valid-time. The valid-time
model provides a mechanism for standardizing the
representation of time-stamped data.
4.2 Information Model
Using this temporal model as a base, we developed
an information model in OWL to provide a
consistent representation of all user data in our
system. Our model provides a consistent
representation of the data’s temporal dimension.
Non-temporal data is represented using variables,
which are atomic pieces of data. Each variable has a
value and a temporal dimension. Variables can be
numeric, string-based, or include ontology term
references. Example variables include viral load
values and blood pressure values. All variables are
associated with an object of interest (e.g., a patient).
All operations and displays in SWEETInfo are
defined in terms of objects of interest and the
variables associated with them. The information
model is intentionally simple so that it can easily be
populated by users and provide a basis for core
WEBIST 2011 - 7th International Conference on Web Information Systems and Technologies
356

systems operations. As mentioned, although the
operations are basic, they can be combined to create
more complex analyses.
4.3 Executing Operations
Once all temporal information is represented
consistently in an information model, it can be
manipulated using reusable methods. While OWL
has very limited temporal operators for manipulating
time values, its associated rule language SWRL
(Horrocks, 2004) provides a small set. However,
these operators are very basic, and provide simple
instant-based comparisons only. SWRL provides
built-ins, which are a mechanism for creating user-
defined libraries of custom methods and using them
in rules. We have used them to define a library of
methods that implement Allen’s interval-based
temporal operators (Allen, 1983). The library also
has a native understanding of our temporal
information model and supports an array of temporal
operations on entities defined using it. It can thus be
used to directly reason about data defined using our
information model.
A SWRL-based query language called SQWRL
(Semantic Query-Enhanced Web Rule Language;
O'Connor and Das, 2009) provides querying support
in the system. SQWRL defines a set of SQL-like
query operators that that can be used to construct
retrieval specifications for information in an OWL
ontology. SQWRL uses our temporal library to
provide complex temporal selection of results. For
example, it can make queries such as List the first
three doses of the drug DDI or Return the most
recent dose of the drug DDI. Supporting these
operators is a key requirement for expressing
temporal criteria in SWEETInfo. SQWRL’s ability
to work directly with our temporal model allows
expressive, yet relatively concise temporal queries
for expressing criteria. All criteria in SWEETInfo
can be expressed directly in SQWRL. Some
operations are implemented by combining rules and
queries to generate intermediate results
incrementally at successively higher levels of
abstraction.
5 SWEETInfo SYSTEM
IMPLEMENTATION
We adopted a standard layered web architecture to
implement SWEETInfo. However, a number of
customizations were required because we were using
OWL. Our implementation differs from most web
applications in that ontologies are used to describe
all application and user data. For example, all
project data are persisted using an OWL ontology.
These data include login and passwords, pipeline
configurations, and operations. OWL- and SWRL-
based reasoning services execute data
transformations. Internally, SQWRL queries
application and user data in much the same say as
SQL is used in system backed by relational
databases. The use of ontologies in this way required
a custom data access layer. For example, in
relational systems, products like Hibernate
(Hibernate, 2010) provide a high-level data access
layer to relational data from Java. No equivalent
systems exist for OWL, requiring the development
of one for SWEETInfo . For reasons of performance
and component separation, we ensured that this layer
completely separated front end code from any
knowledge of OWL.
OWL, SWRL, and SQWRL-based reasoning
services are provided by a Jess-based
implementation (O’Connor and Das, 2009) that
provides almost complete coverage of SWRL and
SQWRL and the subset of OWL necessary for
SWEETInfo’s information model and operations.
All four operations are executed as a set of SQWRL
queries that operationalize the criteria associated
with each operation. They are executed by our back
end, and the results are passed to a graph generation
module before being rendered by a view node.
We used Google’s GWT system (GWT, 2010)
with traditional HTML and CSS technologies for
front-end component development. Because
graphical generation is central to SWEETInfo, it
requires highly detailed custom graphs. We also
needed full rendering control of the graphs and the
ability to modify them interactively. Current GWT
graph libraries do not offer sufficient flexibility for
these types of graphs. A variety of suitable
JavaScript libraries are available, but for simplicity,
we wanted an all-Java solution. We resolved the
problem with a GWT mechanism to wrap a
JavaScript graphics library called Dojo (Dojo,
2010). This solution enabled us to write graph
generation code completely in Java.
In-browser generation of all front end graphs in
this way would be too computationally expensive for
a population-level graph view displaying dozens of
graphs at once. Fortunately, these graphs require less
detail and are not highly interactive. In contrast,
individual patient graphs are highly detailed and can
be interactively modified — for example, users can
zoom and pan. We developed a system to generate
WEB-BASED EXPLORATION OF TEMPORAL DATA IN BIOMEDICINE
357

summary graphs in the back end. These graphs can
be generated far more quickly than those rendered in
the browser. Rather than use a separate library for
generating them, we wrapped a Java graphics library
and provided the same interface as the wrapper
around the Dojo library. Thus, the same Java-based
routines can be used for both types of graphs. These
graphs are fed to the front end as PNGs. When users
select a graph for review from the population-level
display, a highly detailed graph is generated in the
browser using the Dojo-based wrapper.
6 USE CASE
To examine the expressivity of SWEETInfo, we
replicated a recent study on HIV anti-retroviral
therapies (Rhee et al., 2009). The study sought
associations between gene mutations, drug regimens,
and therapy outcomes in HIV infection. Gene
mutations can result from microbial responses to
pharmacologic agents, and this process can lead to
treatment inefficacy. In HIV, for example, a
mutation may be associated retrospectively to a
specific drug or prospectively to poor clinical
outcomes with one or more drugs. Establishing these
associations can help scientists understand how
particular mutations reduce drug efficacy, and can
help clinicians design treatment strategies.
The study defined a treatment change episode
(TCE) to help quantify these genotype-treatment
outcome associations. A TCE is two back-to-back
treatment regimens that include genotype, baseline
and follow-up RNA tests during specified periods.
Viral load and CD4 counts during these periods
provide a high-level view of therapy response.
Inferring the relationship between treatment and
clinical response in a TCE is complicated because it
combines temporal relationships between viral load,
CD4 count, and HIV gene mutations with a drug
treatment history for each patient. The authors of the
original study queried patient data for instances of
the TCE temporal pattern and generated a single
static graph for each TCE. This query was manually
generated using a set of SQL scripts.
We replicated the generation of a TCE using
SWEETInfo. We had access to the same data used in
the study, which is available in the Stanford HIV
Drug Resistance Database (HIVdb) (HIVDb, 2010).
This research database contains time-stamped data
on drug regimens, mutations in the HIV genome,
and CD4 and viral load counts for thousands of
patients. We loaded the data into SWEETInfo’s
information model and developed a pipeline to
describe the analysis outlined in the paper. We
executed the pipeline and validated it by comparing
the numbers reported in the study with
SWEETInfo’s output.
Overall, SWEETInfo was expressive enough to
replicate the results of the original study. We are
planning a formal evaluation with the developers of
the HIVdb database, and will use SWEETInfo to
replicate other published studies.
7 CONCLUSIONS
SWEETInfo is a web-based application that allows
users to analyze temporal data. It allows users to
construct analysis strategies interactively by
assembling simple operations into analysis pipelines.
At each stage of the pipeline, they can visualize
results and make modifications to further refine an
analysis. We believe that this incremental and highly
interactive approach facilitates the creation of
complex analyses by non-specialist users.
A key feature of the system is its use of semantic
web technologies, particularly OWL, SWRL, and
SQWRL. OWL is used to represent an information
model for storing user data. It is also used to store
application data, such as pipeline configurations. All
temporal operations in the pipeline are executed
using SWRL and SQWRL, and make use of an
expressive temporal model and library developed for
these languages. The system demonstrates that these
technologies can support the demands of complex
highly interactive web-based applications, and that
they can be combined with traditional web
technologies. The information model ontology and
data analysis modules that result from this
combination are reusable and can provide temporal
representation and analysis layers in other semantic
web applications.
We are currently adding more expressivity
through additional pipeline operations, such as, for
example, statistical analysis operations. These
operations will invoke external packages like R or
SAS. We also intend to allow users to assemble
individual operations into higher level components
and then to share them. Our ultimate goal is to
produce a library of reusable analysis modules, such
as those provided by standard statistical packages.
Performance is also a key goal. While the current
system performs satisfactorily, it does not scale to a
large number of users. In particular, performing
simultaneous analyses on a single server with SWRL
and SQWRL is computationally expensive. Ideally,
each user would get a dedicated execution engine
WEBIST 2011 - 7th International Conference on Web Information Systems and Technologies
358

when executing pipeline operations. We are
investigating the use of cloud computing strategies
to provide multiple engines on demand in response
to system load.
A key additional shortcoming of the system is
data acquisition. Users are currently responsible for
transforming their data into the OWL-based
information model used by SWEETInfo. We have
used tools such as DataMaster (Nyulas et al., 2007),
which supports relational importation, XMLMaster
(O'Connor and Das, 2010b) which supports XML
importation, and Mapping Master (O'Connor et al.,
2010c), which works with spreadsheets. While
sufficiently powerful, they require knowledge of
OWL and are not suitable for non-specialists. We
plan on providing a set of interactive tools to allow
users to create entities in our information model
directly, without knowledge of OWL.
A public release of SWEETInfo will be available
shortly (SWEETInfo, 2011).
ACKNOWLEDGEMENTS
This research was supported in part by grant
1R01LM009607 from the N.L.M.
REFERENCES
Allen, J. F. (1983) Maintaining knowledge about temporal
intervals. Communications of the ACM, 26(11), 1983.
Nyulas, C., O’Connor, M. J, Tu, S. W. (2007) DataMaster
- a plug-in for importing schemas and data from
relational databases into Protégé. 10th International
Protégé Conference, Budapest, Hungary.
Dojo (2010) http://www.dojotoolkit.org/
Gene Ontology(2010) http://www.geneontology.org/
GTW (2010) http://code.google.com/webtoolkit/
Hibernate (2010) http://www.hibernate.org/
HIVDb (2010) http://hivdb.stanford.edu/
Horrocks I., Patel-Schneider, P. F., Boley, H., Tabet, S.,
Grosof, B., Dean, M. (2004) SWRL: a Semantic Web
rule language combining OWL and RuleML. W3C.
Klimov, D., Shahar, Y., Taieb-Maimon, M. (2010)
Intelligent visualization and exploration of time-
oriented data of multiple patients. Artificial
Intelligence in Medicine.
LabVIEW (2010) http://www.ni.com/labview/
Many Eyes (2010) http://www-958.ibm.com/software/
data/cognos/manyeyes/
McGuinness, D. L. and van Harmelen, F. (2004) OWL
web ontology language overview. W3C.
O'Connor, M. J. and Das, A. K. (2009) SQWRL: a query
language for OWL. OWL: Experiences and
Directions, Fifth International Workshop, Chantilly,
VA.
O'Connor, M. J., Das, A. K. (2010a) A lightweight model
for representing and reasoning with temporal
information in biomedical ontologies. International
Conference on Health Informatics, Valencia, Spain.
O'Connor, M. J. and Das, A. K. (2010b) Semantic
reasoning with XML-based biomedical information
models. 13th World Congress on Medical Informatic,
Cape Town, South Africa.
O'Connor, M. J., Halaschek-Wiener, C., Musen, M. A.
(2010c) Mapping Master: a Spreadsheet to OWL
Mapping Language. 9th International Semantic Web
Conference, Shanghai, China.
PipeLine Pilot (2010) http://accelrys.com
Rhee, S. Y. et al. (2009) Predictive Value of HIV-1
Genotypic Resistance Test Interpretation Algorithms.
Journal of Infectious Diseases, 200(3), 453-463.
Shahar, Y., Goren-Bar, D., Boaz, D., Tahan, G. (2005)
Distributed, intelligent, interactive visualization and
exploration of time-oriented clinical data and their
abstractions. Artifical Intelligence in Medicine.
SIMILE (2010), http://simile.mit.edu/
Snodgrass, R. T., (1995). The TSQL2 Temporal Query
Language, Boston, MA: Kluwer.
SNOMED (2010) http://www.ihtsdo.org/
SWEETInfo (2011) http://www.sweetinfo.org.
WEB-BASED EXPLORATION OF TEMPORAL DATA IN BIOMEDICINE
359
