
DIVERSITY OF THE MASHUP ECOSYSTEM
Michael Weiss and Solange Sari
Department of Systems and Computer Engineering, Carleton University, 1125 Colonel By Dr, Ottawa, Canada
Keywords:
Mashups, Open APIs, Ecosystems, Diversity, Phylogenetic trees, Birth-death models.
Abstract:
Mashups allow users to develop applications from a variety of open APIs. The creation of mashups is sup-
ported by a complex ecosystem of interconnected data providers, mashup platforms, and users. A sign of a
healthy ecosystem is that the number and diversity of APIs and mashups in the ecosystem increases continu-
ously. In this paper, we describe a model of the evolution of the mashup ecosystem that allows us to estimate
the diversification of the mashup ecosystem over time. In this model we show the evolutionary relationships
between mashups as branches in a phylogenetic tree. We discuss how the diversification rate of the mashup
ecosystem can be estimated by fitting this tree to a birth-death process model. The results of our research show
that the diversity of the mashup ecosystem is increasing with time, however, not monotonically.
1 INTRODUCTION
Mashups allow users to develop applications from a
variety of open APIs (Yu et al., 2008). For exam-
ple, the Google Maps API generates maps for a given
location, and its output can be combined with other
open APIs and user-supplied data. The creation of
mashups is supported by a complex ecosystem of in-
terconnected data providers, mashup platforms, and
users (withheld). It is a sign of a healthy ecosystem
that the number and diversity of APIs and mashups
in the ecosystem increases continuously. The growth
of the mashup ecosystem has been attributed to pref-
erential attachment, whereby users select the APIs
to include in a mashup by their popularity (Yu and
Woodard, 2008). Furthermore, there is evidence that
many mashups are created by copying or imitating ex-
isting mashups (Weiss and Sari, 2010).
Previous work does not explain the evolution at
the microlevel. Is the ecosystem evolving to greater
levels of diversity? What type of changes are intro-
duced during this process? In this paper, we model
the evolution of mashups as a replication process
with duplication and mutation. The changes intro-
duced in this process lead to the diversification of the
ecosystem. In this evolutionary process, new types
or species of mashups are created by combining APIs
in novel ways. We refer to this step as speciation.
Speciation occurs when new species keep traits from
their ancestors, otherwise we say that a species has
become extinct. To picture this, let us think about
the first mashups created. It was common to have
mashups with only one API, such as Flickr or Google
Maps. Later on, APIs were combined. Mashups that
combine both APIs gave origin to the new Flickr and
Google Maps species. Thus, Google Maps is consid-
ered extinct in the Flickr clade, and vice versa.
From this perspective, we define the diversifica-
tion of the mashup ecosystem as the creation of a
greater variety of mashups. Diversification can be
modeled as a birth and death process, from which we
can estimate the rate of diversification as the differ-
ence between speciation and extinction rate. The evo-
lution of the mashup ecosystem can be reconstructed
as a phylogenetic tree by tracing lineages that have
given rise to at least one contemporary descendant.
This article investigates the patterns of evolution
of the mashup ecosystem and estimates the rate of
diversification of the ecosystem using phylogenetic
analysis. Section 2 reviews related work. Section 3
describes the model we use to reconstruct the evolu-
tion of the mashup ecosystem. Section 4 presents our
research method, and Section 5 our results. Section 6
closes with a discussion of the results.
2 RELATED WORK
2.1 Mashup Ecosystem
The structure of the mashup ecosystem and its growth
over time has been examined in (Yu and Woodard,
2008) and (Weiss and Sari, 2010). The authors of the
106
Weiss M. and Sari S..
DIVERSITY OF THE MASHUP ECOSYSTEM.
DOI: 10.5220/0003349701060111
In Proceedings of the 7th International Conference on Web Information Systems and Technologies (WEBIST-2011), pages 106-111
ISBN: 978-989-8425-51-5
Copyright
c
2011 SCITEPRESS (Science and Technology Publications, Lda.)

first study (Yu and Woodard, 2008) characterize the
mashup ecosystem as a three-tier structure: a central
tier around the Google Maps API, an intermediate tier
of the most popular APIs, and a peripheral tier of less
popular APIs that are, nonetheless, important for the
rich network structure of the ecosystem to emerge.
In our own work (Weiss and Sari, 2010), we
develop techniques for obtaining characteristics of
the ecosystem and identifying significant ecosystem
members and their relationships. The research sug-
gests that the position of a data provider in the mashup
ecosystem affects the likelihood of their API to be in-
corporated into a mashup. The number of mashups
using a given API indicates how likely an API will be
selected as the basis of a new mashup, and the fre-
quency with which APIs are combined in a mashup
indicates how likely they will be combined in fu-
ture mashups. The research also shows that the com-
plexity of mashups (where complexity is measured as
the number of APIs used) increases with time and
suggests that complexity drives the development of
mashup platforms.
2.2 Recombinant Innovation
(Hargadon, 2002) highlights the recombinant nature
of the innovation process. From this perspective, in-
novation can be described as the construction of new
ideas from existing ones. Benefits include shorten-
ing the learning curve by combining known elements,
sharing of past experience, and the diversity of prob-
lem solving frames. Recombinant innovation empha-
sizes the highly collaborative nature of innovation,
and the role of brokers to bridge between domains and
reinterpret existing ideas in new contexts.
The concept of recombinant innovation is closely
linked to the concept of modularity, which works
to accelerate innovation (Baldwin and Clark, 2000).
Modularity allows relatively independent innovation
within components, or localized adaptation, and the
creation of new products by mixing and matching
components, or recombination (Ethiraj and Levinthal,
2004). The increased modularity implied by open
APIs is of great influence on the development of
mashups. Open APIs are modules that can be com-
bined and recombined in novel ways into mashups.
Modularity is also the basis for imitating the design
of a mashup, when a user clones an existing mashup.
Work on the role of imitation in innovation (Ethiraj et
al., 2008) leads us to conclude that modularity enables
others to imitate the design of a system.
2.3 Growth Models
Many real networks such as citation networks (Price,
1965) and the Internet (Albert et al., 1999) have a de-
gree distribution that observes a power law. A dis-
tribution is said to follow a power law, if it adheres
to the form P(x) ∼ x
−a
. Networks with a power law
distribution are also known as scale free networks
(Albert et al., 1999). A growth model for scale-free
networks has been proposed in (Barabasi and Albert,
1999) based based on two processes: growth (nodes
are added continuously to the network) and preferen-
tial attachment (edges are added to nodes in propor-
tion to the number of their existing edges).
The web growth model in (Kleinberg et al., 1999;
Kumar et al., 2000) describes a copying process that
gives rise to a scale free network. The main step to
their model is that new nodes are created by copying
a subset of the links of a randomly selected existing
node. Others (Sole et al., 2002; Vazquez et al., 2003)
also recognize that duplication mechanisms could ex-
plain the scale-free nature of biological networks. For
example, the cell replication process has elaborate
copying mechanisms to limit the number of replica-
tion errors. However, occasional errors are significant
for creating the population diversity upon which se-
lection acts to produce evolution.
2.4 Biological Diversity
Observing statistics of biological taxa, (Yule, 1925)
detected that the distribution of the number of species
per genus follows a long-tailed form, and proposed a
stochastic model to fit this data. This model is widely
used to estimate diversification rates. The growth pro-
cess is reconstructed as a phylogenetic tree by trac-
ing lineages that have given rise to at least one con-
temporary descendant (Nee et al., 1994). Following
this approach, several methods have been proposed to
estimate diversification rates, for instance maximum-
likelihood estimators and method-of-moments esti-
mator described in (Magallon and Sanderson, 2000).
(Aldous, 2001) discusses stochastic modelling for
phylogenetic trees and calls for statistic descriptive
modelling. (Newman, 2005) states that the Yule pro-
cess is one of the most convincing mechanisms for
generating power laws.
3 MODEL
3.1 Mashup Ecosystem Structure
We model the mashup ecosystem as a network of
DIVERSITY OF THE MASHUP ECOSYSTEM
107

mashups and APIs (withheld). Technically, the net-
work is a bipartite graph G = (M ∪ A,E), where M is
the of mashups, A the set of APIs, and E the set of
edges or links between the two types of nodes. A link
between a mashup m ∈ M and an APIs a ∈ A indicates
that m uses a to provide its functionality.
As a shorthand, we can summarize the fact that
mashup m combines a set of APIs a
1
to a
n
as:
m = (a
1
,a
2
,.. .,a
n
) (1)
To test how similar two mashups are, we use the the
Jaccard similarity index (Paradis, 2006). It is defined
as the number of APIs common to both mashups di-
vided by the combined number of APIs:
sim
jaccard
=
|m
1
∩ m
2
|
|m
1
∪ m
2
|
(2)
Given two mashups m
1
= (GoogleMaps,Flickr) and
m
2
= (Flickr,Amazon), the Jaccard similarity is
1/3 = 0.33, as both mashups share Flickr, but are
each combined with a different other API.
3.2 Birth-Death Models
Diversification is commonly modeled as a birth-death
process (Nee, 2006). Speciation is assumed to occur
at a constant rate b, and extinction at a constant rate d.
The diversity of species in an ecosystem is expected
to grow exponentially at the diversification rate:
r = b − d (3)
The relative extinction rate is e = d/b (Bailey, 1964).
4 RESEARCH METHOD
4.1 Mashup Alignment
The dataset is obtained from the ProgrammableWeb
directory and over the period from Sep 2005 to Feb
2010.
1
The dataset has 4500 entries. Each entry
consists of the name of a mashup and a list of APIs
that compose the mashup. Mashups are aligned along
two dimensions: first we sort the mashups chronolog-
ically, then we order them by their distance computed
as the Jaccard similarity index (see Section 3).
4.2 Tree Reconstruction
A phylogenetic tree captures the evolutionary re-
lationships between species of mashups. Similar
1
http://www.programmableweb.com
mashups are in related branches of the tree. To es-
timate the tree we use the neighbor-joining method
(Gascuel, 1997), as implemented in the ape library in
the statistics package R.
2
Neighbor-joining joins the
two closest mashup species under a common node in
the tree. The joined mashup species are then consid-
ered as a single species. The algorithm terminates
when all pairs of mashup species have been consid-
ered. The estimated tree is subsequently calibrated by
resolving multichotomies (more than two branches)
and estimating node ages (Sanderson, 2002).
4.3 Experiments
We identify patterns of diversification at two levels.
The first experiment analyses the dataset in time win-
dows of 500 mashups, equivalent to six months each.
The second experiment selects subtrees representing
different clades or branches of the phylogenetic tree.
For each tree and subtree diversification rates are
computed according to the models in Section 3.
5 RESULTS
The experiments result in a total of 9 phylogenetic
trees, one for each time window between September
2005 and February 2010. Each subset is filtered by
excluding duplicates and selecting only mashups re-
lated to the top 5 APIs. Figures 1(a) and (b) describe
mashups in two distinct snapshots. The windows W1
and W5 refer to the periods 09/2005-04/2006 and
07/2007-12/2007, respectively. Each tree node rep-
resents a specific API combination that gives rise to
a clade of mashups which includes one or more APIs
of this combination. A clade is a group of similar
mashups sharing the same origin node. For exam-
ple, in W1 node 91 represents the combination of
GoogleMaps, Flickr, Delicious, and Amazon. Two
large clades (node 93 and node 114) derive from it.
The tree structure changes when looking at differ-
ent time intervals. Figure 2 includes all published
mashups from 09/2005 to 02/2010 and highlights the
major niches created around the most popular APIs:
GoogleMaps, Flickr, YouTube, Twitter, and Amazon-
Commerce. This visualization gives an idea of the
number of different clades, or the diversity of the
ecosystem. However, it does not establish a metric.
The transition between the snapshots is mirrored
in the diversification rates. In this birth-and-death
process, diversity is estimated in terms of diversifica-
tion rate (r = b − d) and extinction fraction (e = d/b).
2
http://ape.mpl.ird.fr
WEBIST 2011 - 7th International Conference on Web Information Systems and Technologies
108
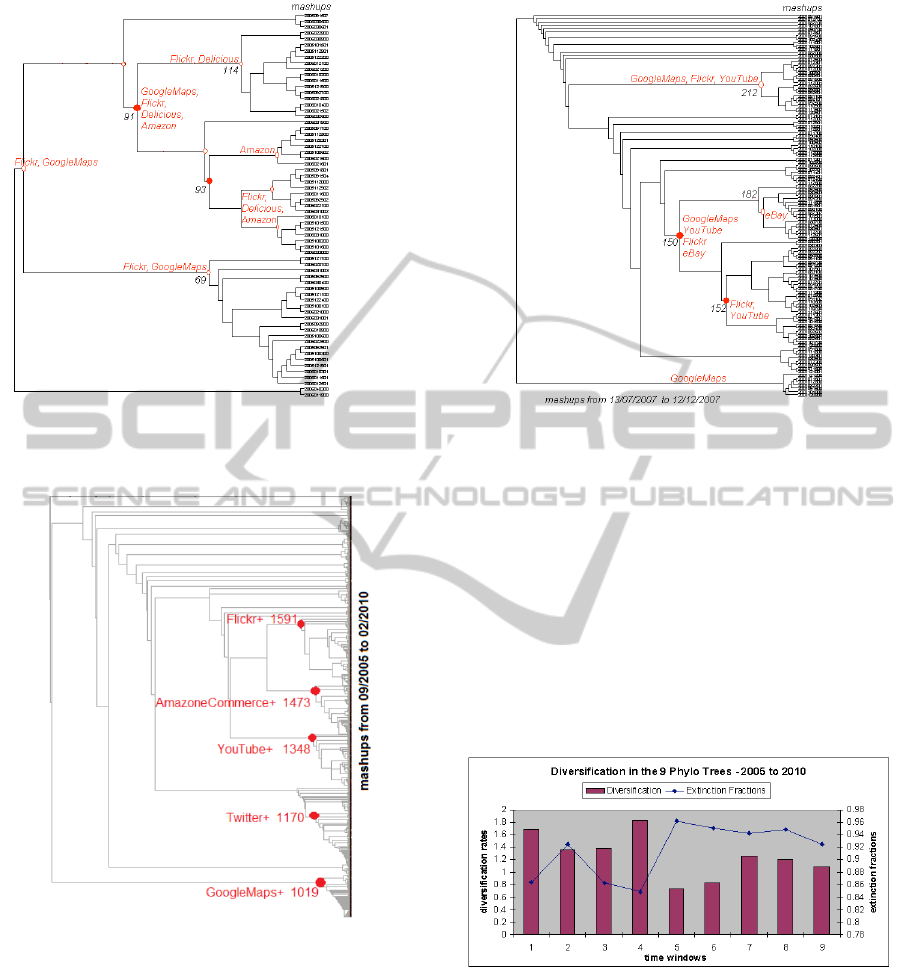
(a) Tree W1, [0,500) (b) Tree W5, [2000,2500)
Figure 1: Snapshots of the evolution of the mashup ecosystem two different periods of time.
Figure 2: Phylogenetic tree for the evolution of the mashup
ecosystem over the full observation period.
Figure 3 shows the diversification rate (left axis) and
extinction fraction (right axis) in the 9 phylogenetic
trees representing the mashup ecosystem.
We observe high speciation in the first four win-
dows and high extinction rate in the remaining win-
dows. In particular, W5 presents the lowest diversi-
fication rate and highest extinction fraction. Overall,
the pattern we observe is one of initial high diversifi-
cation (windows 1-4), which is followed by a period
of decline (windows 4-5). Subsequently (windows
5-7), the diversification rate increases again, and has
somewhat declined again since (windows 7-9).
Such an increase in diversity followed by a de-
cline in diversity is expected by the dominant de-
sign paradigm (Utterback, 1996). According to this
paradigm, innovation is expected to produce a great
variety of solutions until a dominant design emerges.
Innovation diversity will increase again when changes
to the environment favor the evolution of a new dom-
inant design. Tree reconstruction offers a new way of
empirically measuring this phenomenon.
Figure 3: Diversification rate (left axis) and extinction frac-
tion (right axis) in the mashup ecosystem.
Further investigation of the major clades of each
tree offers more information about diversity, as
showed in Figure 4. The highest extinction fraction
in the first time-window is the clade from 93-node,
see Figure 1(a). As discussed before, the extinction
event happens, because the Amazon clade tends to
evolve independently, not preserving traits from its
ancestors. Other outlier for extinction fraction is from
152-node of the W5 tree, see Figure 1(b). In this case,
DIVERSITY OF THE MASHUP ECOSYSTEM
109

Figure 4: Evolution of the diversification rate by clade.
the Flickr and YouTube clades tends to evolve without
the participation of GoogleMaps or eBay.
6 CONCLUSIONS
The results of our analysis indicate that the diversity
of the mashup ecosystem increases with time. Growth
of diversity indicates a healthy ecosystem. However,
diversity did not increase monotonically, as one might
have expected. The non-monotinicity of the growth of
diversity signals that the mashup ecosystem was able
to recover from a temporary decline in diversity.
The findings are relevant to the data providers and
users. Diversity is important as it fosters innovation.
By opening up APIs to users, data providers can lever-
age third-party innovation while maintaining control
over what information is exposed. Users can create
mashups that incorporate the APIs in novel ways not
anticipated by the data providers. In exchange, data
providers gain access to more ideas for applications
of their APIs and API improvements than they could
have discovered on their own.
In future work, we will further examine the rea-
sons for the non-monotonic growth in diversity, as ob-
served by the two periods of decline. From this, we
want to build an understanding of the conditions for
successful growth of the mashup ecosystem and other
similar ecosystems. We would expect disruption to
growth to result from the introduction of fundamen-
tally new species of mashups. One such event would
be the creation of the Twitter API. We leave a more
thorough analysis of this effect to future work.
ACKNOWLEDGEMENTS
Thanks to John Musser for providing an API key to
access the data on the ProgrammableWeb.
REFERENCES
Albert, R., Jeong, H., and Barabasi, A.L. (1999). Diameter
of the World Wide Web. Nature, 401, 130-130.
Aldous, D.J. (2001). Stochastic Models and Descriptive
Statistics for Phylogenetic Trees, from Yule to Today.
Statistical Science 2001, 26(1), 2334.
Bailey, N. (1964). The elements of stochastic processes with
applications to the natural sciences. In: Homogeneous
Birth and Death Process, Chapter 8.
Baldwin, C., and Clark, K. (2000). Design Rules: The
Power of Modularity, MIT Press.
Barabasi, A.L., and Albert, R. (1999). Emergence of scaling
in random networks. Science, 286, 509-512.
Ethiraj, S., and Levinthal, D. (2004). Modularity and In-
novation in Complex Systems. Management Science,
50(2), 159-173.
Ethiraj, S., Levinthal, D., and Roy, R. (2008). The Dual
Role of Modularity: Innovation and Imitation. Man-
agement Science, 54(4), 939-955.
Gascuel, O. (1997). BIONJ: an improved version of the NJ
algorithm based on a simple model of sequence data.
Molecular Biology and Evolution, 14, 685-695.
Hargadon, A., 2002. Brokering Knowledge: Linking Learn-
ing and Innovation. Research in Organizational Be-
havior, 24, 41-85.
Kleinberg, J., Kumar, R., Raghavan, P., Rajagopalan, S.,
and Tomkins., A. (1999). The web as a graph: Mea-
surements, models, and methods. International Con-
ference on Computing and Combinatorics, LNCS
1627, Springer, 1-17, 1999.
Kumar, R., Raghavan, P., Rajagopalan, S., Sivakumar, D.,
Tomkins, A., and Upfal, E., 2000. The web as a graph.
ACM Symposium on Principles of Database Systems,
1-10.
Magallon, S., and Sanderson, M.J. (2000). Absolute diver-
sification rates in angiosperm clades. Evolution, 55,
1762-1780.
Nee, S., May, R.M., and Harvey, P.H. (1994). The recon-
structed evolutionary process. Philosophical Trans-
actions of the Royal Society of London, Series B,
344:305-311.
Nee, S. (2006). Birth-death models in macroevolution. An-
nual Review of Ecology, Evolution and Systematics,
37, 1-17.
Newman, M. (2005). Power laws, Pareto distributions and
Zipfs law. Contemporary Physics, 46, 323.
Paradis, E., 2006. Analysis of Phylogenetics and Evolution
with R. Springer.
Price, D.J. de S., 1965. Networks of scientific papers. Sci-
ence, 149, 510-515.
Sanderson, M.J. (2002). Estimating absolute rates of molec-
ular evolution and divergence times: a penalized like-
lihood approach. Molecular Biology and Evolution,
19, 101-109.
WEBIST 2011 - 7th International Conference on Web Information Systems and Technologies
110

Sole, R.V., Pastor-Satorras, R., Smith, E. and Kepler, T.B.
(2002). A model of large-scale proteome evolution.
Advances in Complex Systems, 5(1), 43-54.
Utterback, J. (1996). Mastering the Dynamics of Innova-
tion, Harvard Business School Press.
Vazquez, A., Flammini, A., Maritan, A., and Vespignani,
A. (2003). Global protein function prediction from
protein-protein interaction networks. Nature Biotech-
nology, 21, 697-700.
Weiss, M., and Sari, S. (2010). Evolution of the mashup
ecosystem by copying. International Workshop on
Web APIs and Services Mashups (Mashups) (in press).
Yu, J., Benatallah, B., Casati, F., and Daniel, F. (2008).
Understanding mashup development. IEEE Internet
Computing, September/October, 44-52.
Yu, S., and Woodard J. (2008). Innovation in the Pro-
grammable Web: Characterizing the Mashup Ecosys-
tem. Second International Workshop on Web APIs and
Services Mashups, LNCS 5472, Springer, 136147.
Yule, G.U. (1925). A mathematical theory of evolution,
based on the conclusions of Dr. J.C. Willis. Philosoph-
ical Transactions of the Royal Society of London, Se-
ries B, 213, 2187.
DIVERSITY OF THE MASHUP ECOSYSTEM
111
