
INTERACTIVE SEARCH AND RESULT VISUALIZATION
FOR CONTENT BASED RETRIEVAL
Levente Kov
´
acs
Distributed Events Analysis Research Group, Computer and Automation Research Institute, Hungarian Academy of Sciences
Kende u. 13-17, H-1111 Budapest, Hungary
Keywords:
Content based retrieval, Indexing, Visualization application.
Abstract:
This paper presents visual query, search and result visualization application which is interactive, robust, and
flexible to be usable for different image and video retrieval applications. The main novelty of our approach
is that, at the same time, it provides a text and model based search interface, a visual browsing interface, a
distribution visualization interface based on a number of content based features, an annotation editing interface
and a content classification interface, all combined together in an easy to use prototype.
1 INTRODUCTION
There exist a number of solutions for content based
image and video categorization, indexing and re-
trieval, and most of them provide some kind of vi-
sualization for displaying the results.
1D/sequential display of results in a retrieval sys-
tem can only provide a row of results, which limits
or prohibits distance visualization. Result displays
in our view should resemble visualization maps sim-
ilar to (Gansner and Hu, 2010). The idea is to dis-
play the elements in a manner that reflects their re-
lation to each other, and to the query. (Moghad-
dam et al., 2001) presented an approach for display-
ing PCA-based 2D scatters of results. General image
search solutions (Fig. 1 a,b,c) use text queries over
annotations to display results in a sequential arrange-
ment,others (Fig. 1d) organize contents around a cen-
tral term, which are still not suitable for displaying
distances relative to the query.
Techniques have been investigated (Card and
Mackinlay, 1997) for visualizing interdependent data
structures, investigating scatter graphs, tables, dia-
grams, trees. Later, prototypes like the Bungee View
(Derthick, 2007) (Fig. 2) were developed, a way for
browsing image collections, but the handling of hi-
erarchies and distance visualizations remained an is-
sue. The hierarchical treemap concept was introduced
in (Bederson et al., 2002), which was used to build
zoomable structures for browsing image collections.
A similar concept was Photomesa (Bederson, 2001)
(Fig. 2). (Maillet et al., 2010) presents some of the
classical approaches towards interactive result visual-
ization. The Simplicity engine (Wang et al., 2001),
the Amico library (The Art Museum Image Consor-
tium, closed in 2005), followed by ARTStor (art-
stor.org), QBIC (Flickner et al., 1995) and the VideoQ
engine (Chang et al., 1997) are examples of content-
based search engines and interfaces, based on low
level features and annotation search. Tineye (tin-
eye.com) is an image search engine based on hash
comparisons. Jinni (jinni.com) combines extensive
manual tagging with machine learning to categorize
movies. These and others (Google, 2010b; Yahoo,
2010; Google, 2010a) mostly focus on providing rel-
evant results in 1D/sequential displays.
The presented approach of this paper follows
the browse&query based approach of the Ostensive
Model (Urban et al., 2006). Similar to the pure osten-
sive browsing (POB) approach (Fig. 2), all aspects of
the retrieval are automated. The novelty of the pre-
sented framework lies in providing multiple viewing
interfaces (2D, 3D), text and content queries, anno-
tation and classification editing. Our approach is to
use combinations of supported content features to dis-
play result distributions, where 2D/3D plots show the
distances of images/videos based on the selected fea-
tures. The idea is that both the model-based query
formulation and the retrieval visualization should be
interactive, with browsing, organizing and editing
functions. Moreover, these processes should be cou-
pled, and there should be no visual difference be-
266
Kovács L..
INTERACTIVE SEARCH AND RESULT VISUALIZATION FOR CONTENT BASED RETRIEVAL.
DOI: 10.5220/0003362702660269
In Proceedings of the International Conference on Imaging Theory and Applications and International Conference on Information Visualization Theory
and Applications (IVAPP-2011), pages 266-269
ISBN: 978-989-8425-46-1
Copyright
c
2011 SCITEPRESS (Science and Technology Publications, Lda.)
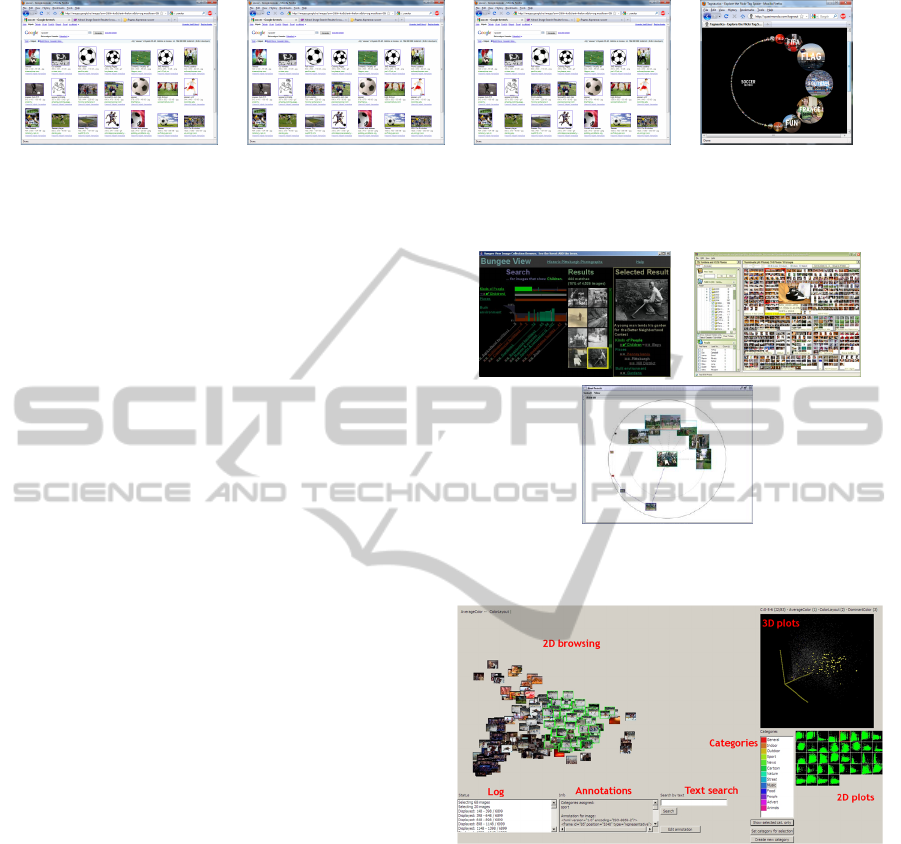
(a) (b) (c) (d)
Figure 1: Three current image search results (based on text queries) of three current search engines (a, b, c – Google, Yahoo,
Bing) for the term “soccer”, and the visual interface of Tagnautica (d) where related terms are grouped around the query.
tween querying, searching or browsing: the interface
should provide a smooth transition, while providing
high level user control.
For this work, we used a database of around
10000 videos of news, cartoons, sports, street surveil-
lance, etc. For indexing we used 9 features, extracted
automatically: average colour samples from frame
regions, relative focus maps (Kov
´
acs and Szir
´
anyi,
2007), colour segmentation, MPEG-7 colour, edge
and texture features (Manjunath et al., 2001).
2 VISUALIZATION FOR
BROWSING AND RETRIEVAL
One important part of interactive visualization should
be easy access to browsing, where users can view
parts of the dataset based on categories, features, or
distances of elements. Our concept is, that the pre-
sentation of contents should at the same time reflect
dependence on content based distances, and provide
options for quickly changing display properties.
In the presented framework browsing through the
stored contents is available through thumbnails of the
videos’ representative frames (Fig. 3). These thumb-
nails can be selected, dragged, zoomed, and chosen as
queries of content-based search. The results are dis-
played as new distributions, where the positions re-
flect the distances from the query (Fig. 6, 7). In case
of a large number of indexed video segments the num-
ber of displayed thumbnails can be limited. Browsing
can also be controlled by choosing different features,
and the new distribution can be viewed by clicking
on the 2D distribution icons (“2D plots” in Fig. 3, 4).
Fig. 6, 7 show samples for image distributions in the
case of different descriptors. In browsing mode there
are certain functions that can be accessed: use the se-
lected video as a content base query; display adminis-
trative information about the selection; display anno-
tations; selecting a group; edit categories; zoom.
When visualizing content distributions, the distri-
bution of the displayed elements depends on the selec-
tion of content features that are the basis of the com-
Figure 2: Shots of Bungee View (top-left), Photomesa (top-
right), POB (bottom).
Figure 3: The main interface.
parison. We also support switching between differ-
ent features by displaying all possible combinations
of 2D-pairings of selectable feature spaces, provid-
ing the possibility to show a distribution related to
selected features by clicking on icons that represent
those features (Fig. 4).
Icons representing the small 2D plots aid in
choosing distributions that provide better visualiza-
tion in the sense that the two descriptors for the cho-
sen distribution provide better scatter. A descriptor
that groups images from different categories closer
is worse than one that groups different categories
into different regions: distances between categories
should be reflected in visual distances. This also helps
in choosing features that are better at differentiating
INTERACTIVE SEARCH AND RESULT VISUALIZATION FOR CONTENT BASED RETRIEVAL
267
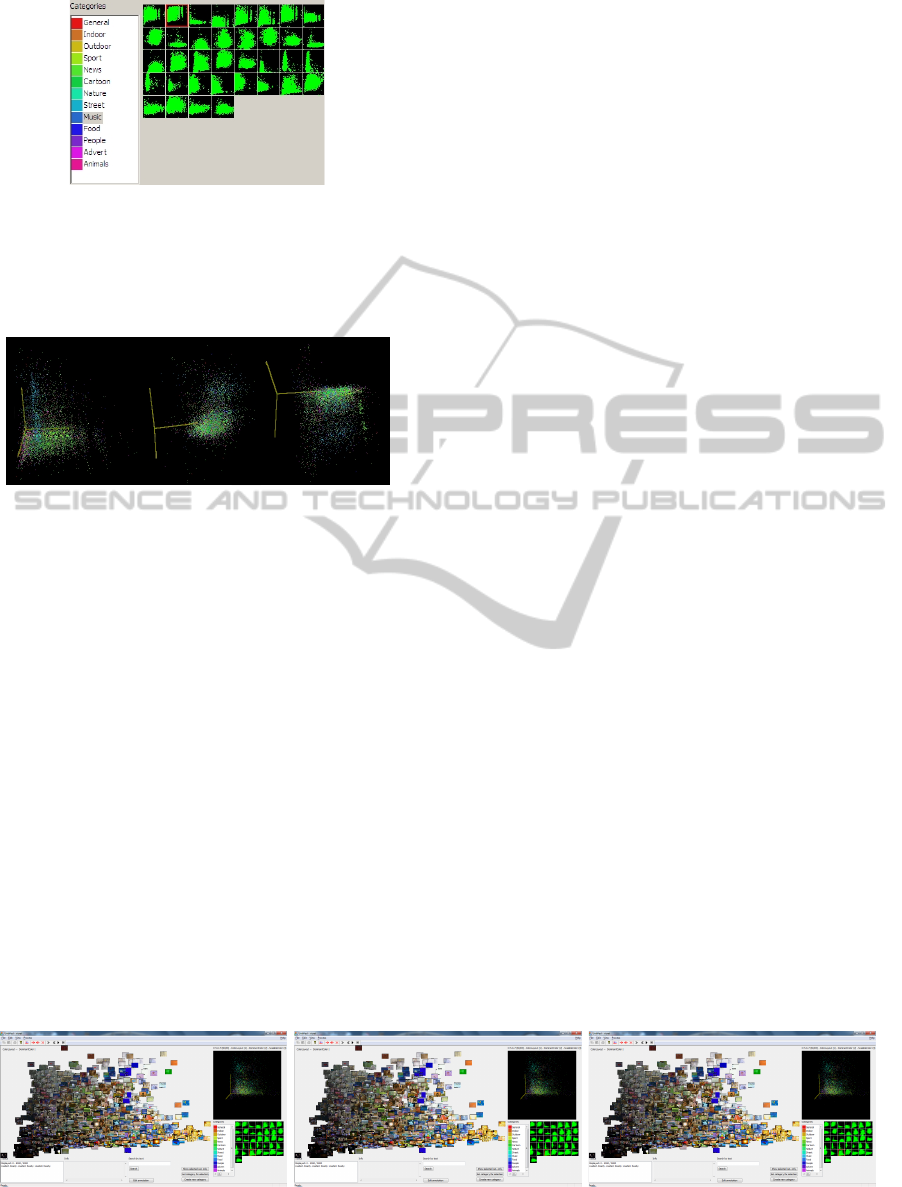
Figure 4: The available categories (left) colour coded.
These can be assigned to any selection of videos in the
browsing view. On the right all plots for any 2 selections of
descriptors are shown, which – when selected – will result
in the rearrangement of the videos in the browsing view.
Figure 5: 3 Samples for displaying 3D point cloud distribu-
tions of images, any of the descriptors can be selected to be
one of the 3 axes.
categories. Generally, the point distribution visual-
izations aid in choosing the best feature descriptors as
the basis for generating the thumbnail views.
Making selections in a view (thumbnail, 3D point
cloud) is a way of selecting groups of elements that
belong to the same visual region. However, these
regions visually represent the distances among ele-
ments, according to the selected features. Thus the
selection tools help in visualizing and editing cate-
gories, showing how they relate to each other, also
aiding the user to visually judge the correctness of the
category assignments.
Fig. 5 shows different distributions of the same 3D
point cloud according to different descriptors, where
colours represent different categories. The axes can
be any combination of available descriptors; plots can
be zoomed, rotated, points can be selected, any selec-
tion of images from the 2D view can be highlighted
in the 3D view as well.
Searches through the visualization interface can
be performed through the following options:
• Text query: after a text query the results will be
images or video segments whose annotations con-
tain the query text.
• Model based query: the query should be a thumb-
nail image, and as a result, all the views will be
rearranged so as to reflect other videos’ distances
from this query (Fig. 7).
• Category based query: after selecting categories,
only videos belonging to those categories (e.g.
“sport”) will be displayed (Fig. 6 b,c).
The difference between a text and a category-
based query is that while text queries lead to searches
among the annotations and the results will be ele-
ments that contain the text, the results of a category
based query will be elements that belong to those cat-
egories.
2.1 Annotations, Categories
In the presented framework the possibility of adding
annotations, viewing existing annotations and editing
is provided as an essential part of the main interface.
Viewing assigned annotations can be done by clicking
on any thumbnail of a video segment and choosing
to view the annotation. Assigning categories, com-
plementing existing ones and editing previous assign-
ments is also possible (Fig. 4). First, the user selects
elements, then can assign a class (existing or new), or
edit existing ones. The 3D point cloud view shows
points corresponding to video segments in different
colours (e.g. Fig. 5), where each colour corresponds
to different categories. Viewing images of a certain
class can be done by selecting the descriptors accord-
ing to which the distribution will be displayed, then
selecting one or more categories (Fig. 6 b,c).
(a) (b) (c)
Figure 6: (a) Displaying images according to their distribution by the selected colour descriptor; (b): displaying images from
the “sport” category; (c): displaying images from the “soccer” category (subset of “sport“).
IVAPP 2011 - International Conference on Information Visualization Theory and Applications
268
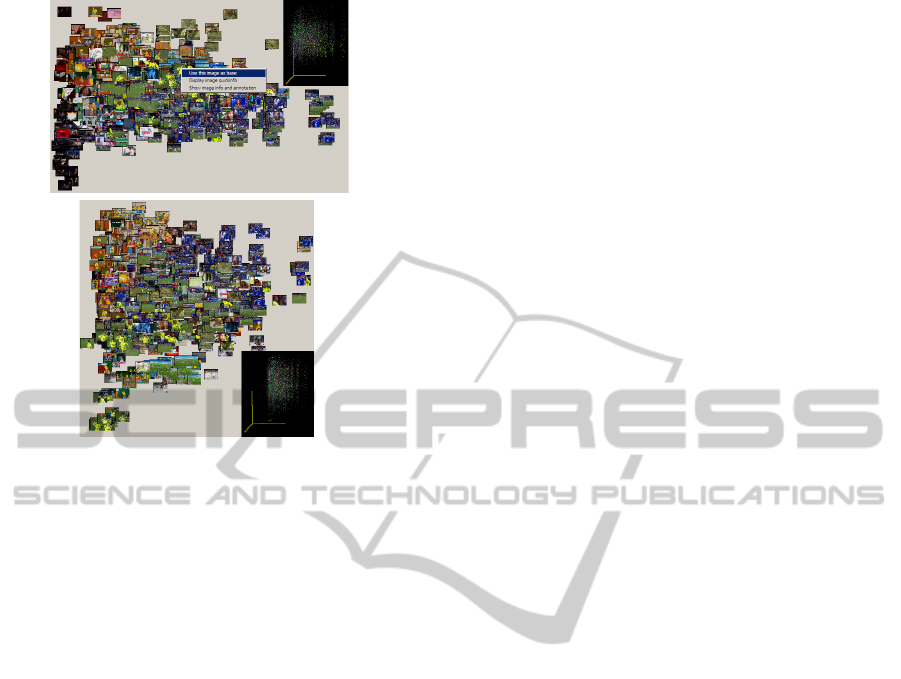
Figure 7: From the current distribution one video is selected
(top) as a new base (query) for the new distribution (bot-
tom), which shows the distances of all the videos from the
query based on the two selected descriptors.
3 CONCLUSIONS
We presented an interactive visualization prototype
for content-based query, search and result display,
with various organization and editing capabilities.
The results presented form a proof-of-concept that
can show the ideas we have about effective and inter-
active query and result visualization, and we intend
to follow up on this prototype with further work on
such solutions. We also work towards creating a video
search service with similar capabilities.
ACKNOWLEDGEMENTS
This work has been partially supported by the Hun-
garian Scientific Research Fund under grant number
PD83438.
REFERENCES
Bederson, B. B. (2001). PhotoMesa: A zoomable image
browser using quantum treemaps and bubblemaps. In
Proc. of ACM Symposium on User Interface Software
and Technology, pages 71–80.
Bederson, B. B., Shneiderman, B., and Wattenberg, M.
(2002). Ordered and quantum treemaps: Making ef-
fective use of 2D space to display hierarchies. ACM
Transactions on Graphics, 21(4):833–854.
Card, S. K. and Mackinlay, J. (1997). The structure of infor-
mation visualization design space. In Proc. of IEEE
Symposium on Information Visualization, pages 92–
99.
Chang, S. F., Chen, W., Meng, H. J., Sundaram, H., and
Zmong, D. (1997). VideoQ: An automatic content-
based video search system using visual cues. In Proc.
of ACM Multimedia.
Derthick, M. (2007). Bungee View at Carnegie Mellon.
Flickner, M., Sawhney, H., Niblack, W., Ashley, J., Huang,
Q., Dom, B., Gorkani, M., Hafner, J., Lee, D.,
Petkovic, D., Steele, D., and Yanker, P. (1995). Query
by image content: The QBIC system. IEEE Computer
Special issue on Content Based Retrieval, 28(9).
Gansner, E. and Hu, Y. (2010). GMap: Visualizing graphs
and clusters as maps. In Proc. of IEEE Pacific Visual-
ization Symposium, pages 201–208.
Google (2010a). Google Goggles –
www.google.com/mobile/goggles.
Google (2010b). Video Search – video.google.com.
Kov
´
acs, L. and Szir
´
anyi, T. (2007). Focus area extraction
by blind deconvolution for defining regions of inter-
est. IEEE Tr. on Pattern Analysis and Machine Intel-
ligence, 29(6):1080–1085.
Maillet, S. M., Morrison, D., Szekely, E., and Bruno,
E. (2010). Interactive representations of multimodal
databases. In Thiran, J., Marques, F., and Bourlard,
H., editors, Multimodal Signal Processing - Theory
and Applications for Human-Computer Interaction,
chapter 14, pages 279–306. Academic Press.
Manjunath, B. S., Ohm, J. R., Vasudevan, V. V., and Ya-
mada, A. (2001). Color and texture descriptors. IEEE
Trans. on Circuits and Systems for Video Technology,
2(6):703–715.
Moghaddam, B., Tian, Q., and Huang, T. S. (2001). Spa-
tial visualization for content-based image retrieval. In
Proc. of IEEE Intl. Conference on Multimedia and
Expo, pages 42–45.
Urban, J., Jose, J. M., and van Rijsbergen, C. J. (2006). An
adaptive technique for content-based image retrieval.
Multimedia Tools and Applications, 31(1):1–28.
Wang, J. Z., Li, J., and Wiederhold, G. (2001). SIMPLIcity:
Semantics-sensitive integrated matching for picture li-
braries. IEEE Trans. on Pattern Analysis and Machine
Intelligence, 23(9):947–963.
Yahoo (2010). Video Search – video.search.yahoo.com.
INTERACTIVE SEARCH AND RESULT VISUALIZATION FOR CONTENT BASED RETRIEVAL
269
