
A REAL TIME CARDIAC MONITORING SYSTEM
Arterial Pressure Waveform Capture and Analysis
V. G. Almeida, T. Pereira, E. Borges, J. M. R. Cardoso, C. Correia
Instrumentation Centre, Physics Department, University of Coimbra, R Larga, Coimbra, Portugal
H. C. Pereira
Instrumentation Centre, Physics Department, University of Coimbra, R Larga, Coimbra, Portugal
ISA- Intelligent Sensing Anywhere, Coimbra, Portugal
Keywords: PIC microcontrollers, dsPIC, Arterial pressure waveform, Physiological signals, Cardiac system, Embedded
systems, Real time.
Abstract: An arterial pressure waveform recorder and analyser based on a Microchip PIC microcontroller (µC),
dsPIC33FJ256GP710 is described in this article. Our purpose is to develop a dsPIC based signal monitoring
and processing system for cardiovascular studies, specially dedicated to arterial pressure waveform (APW)
capture. We developed a piezoelectric (PZ) probe designed to reproduce the APW from the pulsatile activity
taken non-invasively at the vicinity of a superficial artery. The advantages in developing a microcontroller
based system show up in decreasing the associate cost, as well as in increasing the functionality of the
system. Based on a MathWorks Simulink platform, the system supports the development and transfer of
program code from a personal computer to the microcontroller, and evaluation of its execution on rapid
prototyping hardware. Results demonstrate that embedded system can be an alternative to be used in
autonomous cardiovascular probes. Although additional studies are still required, this probe seems to be a
valid, low cost and easy to use alternative to expensive and hard to manipulate devices in the market.
1 INTRODUCTION
The social and economic impact of cardiovascular
diseases and the importance of efficient early
diagnostic tools keep mobilizing the interest of many
researchers (Laurent et al., 2006). Continuous
monitoring and analysis of physiological signals, as
well as online interactive signal processing are
essential in the management of ill patients. The term
arterial stiffness denotes alterations in the
mechanical properties of arteries, as the decay of
elasticity in the arterial wall fibers. Much effort has
focused in determining the best way to measure this
parameter: pulse pressure, pulse waveform analysis
and pulse wave velocity (PWV) measurements are
some examples.
Historically the cuff sphygmomanometer was the
first method to quantify a part of the medical
information contained in the arterial pressure
waveform (APW); however it provides a limited
amount of information: quantitative blood pressure
information at two specific points of the APW.
Electrocardiography (ECG) is another widely
accepted method to extract cardiovascular
information but is rather limited when arterial
stiffness information is concerned.
The APW morphology has gained clinical
interest due the additional information obtained from
the time-varying pulse waveform (Avolio et al.,
2010), such as the pattern of the ventricular ejection
and the elastic properties of the arterial tree.
Ideally, we are looking for an instrument capable
of delivering the calibrated, precise APW at the
ascending aorta, even though from a remote sensing
site (peripheral artery). Non-invasive assessment of
APW typically uses waveforms recorded at one of
two anatomical locations: the radial and the carotid
artery. Carotid blood pressure is often used as a
surrogate for central aortic blood pressure due its
location. Van Bortel et al. (2001) showed that the
carotid pulse pressure differ only 1.8 mmHg from
central aortic pulse pressure.
83
G. Almeida V., Pereira T., Borges E., M. R. Cardoso J., Correia C. and C. Pereira H. (2011).
A REAL TIME CARDIAC MONITORING SYSTEM - Arterial Pressure Waveform Capture and Analysis.
In Proceedings of the 1st International Conference on Pervasive and Embedded Computing and Communication Systems, pages 83-90
DOI: 10.5220/0003369600830090
Copyright
c
SciTePress
In this work we concentrate in developing a non-
invasive device suitable to carotid APW
measurements and to further processing, from which
a great deal of clinically relevant information can be
derived. The resulting instrument assumes the shape
of a real time system, autonomous, with minimal
human intervention, capable to respond to the time
variations of the physiological signals.
Real time embedded systems using digital signal
processors (DSP) in biomedical applications
assumed, over the last years, an increasing
importance due to the enhanced functionalities that
they are capable of imparting. The development of
this technology has enabled significant
improvements in speed of analysis, accuracy, noise
immunity, programmability, size reduction and, in
addition, a decrease in cost.
Numerous cardiovascular applications have been
reported in the literature: Klig et al. (1978) uses
these systems for monitoring blood pressure and
ECG signals. Bing-Nan et al. (2004) proposes an
embedded medical advisory system for mobile
cardiovascular monitoring devices that provides
microcirculation information. Germano et al. (2009)
introduces a generic architecture for developing
biomedical embedded systems with special
application for clinical analysis and for patient
monitoring.
The Explorer 16 development board with its
attached microcontroller is used with some
additional hardware in order to configure a fully
operational system.
The real time operating system is discussed
along the paper, as well as the details of data
acquisition, data pre-processing and data
transmission to the host computer. In Section 2 a
general embedded system design is briefly
introduced while the software parts are described in
Section 3. In Section 4, experimental results are
shown demonstrating a very good overall
performance in an almost autonomous (minimum
human intervention) mode of operation.
2 EMBEDDED SYSTEM DESIGN
The microcontroller (µC) was selected from the
Microchip PIC family due to its features and
embedded resources. These µCs are widely available
on the market at relatively affordable prices.
Moreover, a wide range of programming tools are
also available (Bansal et al, 2009, Smolnikar and
Mohorcic 2008).
The dsPICs are a hybrid solution that combines
the processing power of a DSP with the functionality
of a microcontroller, which includes fast interrupt
vectors, control of peripherals, general purpose I/O
and can run compact code.
The dsPIC33 family, in particular, employs a
powerful 16-bit architecture that integrates the
control features of a microcontroller with the
computational capabilities of a DSP. The
dsPIC33FJ256GP710 was chosen due to its
characteristics: 40 MIPS processor speed, 256 kbyte
program memory and 30 kbyte of RAM.
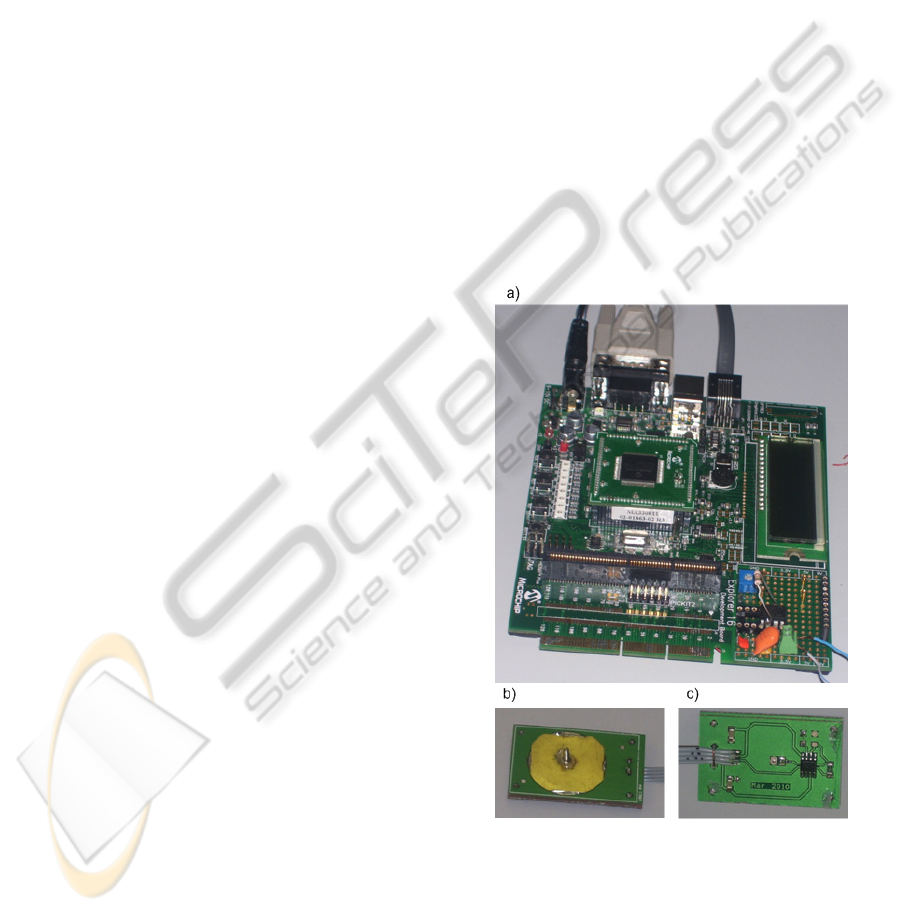
The Explorer 16 development board (figure 1 a)
is a low cost, efficient development board to
evaluate the features and performance of
Microchip's Microcontrollers, in particular the
PIC24FJ128GA010 and the dsPIC33FJ256GP710.
Top and bottom views of a piezoelectric (PZ)
probe responsible for capturing the APW at the
carotid artery site, are shown in figure 1 b) and c).
The architecture of the system is
diagrammatically represented in figure 2.
Figure 1: a) Explore 16 development board (a) and PZ
probe, top and bottom views, respectively b) and c).
The signal acquisition/processing block is
responsible for amplifying the sensor signal and
identifying the positive peak (one of the prominent
points of the APW).
The signal conditioning block has the function of
PECCS 2011 - International Conference on Pervasive and Embedded Computing and Communication Systems
84
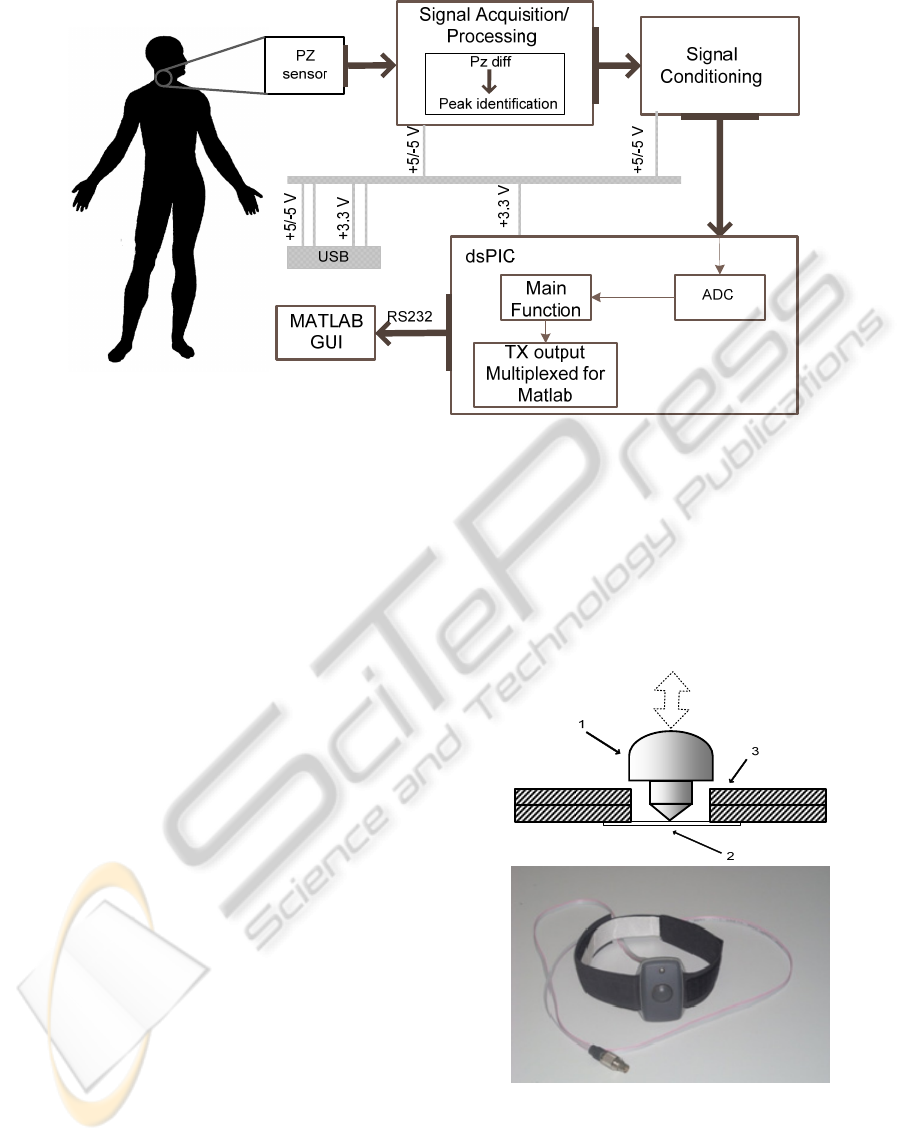
Figure 2: Workflow of the system.
supplying unipolar (positive only) values as required
by the dsPIC ADC. The microcontroller is
programmed to deliver the final pressure waveform
and transmit data via RS232 to a Graphical User
Interface (GUI) on MATLAB.
The PZ probe and rs232gui are discussed in
detail in the remaining of this section.
The USB (Universal Serial Bus) is also
responsible for supplying power to the system.
2.1 PZ Probe
PZ based probes have been widely used in APW
measurements along the last years as a result of their
characteristics: high sensitivity, high signal-to-noise
ratio SNR, as well the low price associated.
A PZ element is able to convert force or pressure
applied to its surface into a measurable voltage
signal. From an electrical point of view the sensor
can be modelled as an AC coupled voltage generator
(Karki, 2000) and, consequently, it does not respond
to static excitation.
Due to the above mentioned electrical
characteristics of the PZ probe, the collected signal
appears as a time derivative of the APW that excites
the PZ sensor.
In figure 3 a) the configuration of the probe is
shown. The PZ sensor (2) in use is the MURATA
7BB-12-9 sounder, this is attached on a double
printed circuit board (PCB) (3).The interface
between the transducer and artery (or silicon tube) is
done by a PVC piece (1) (in form of a “mushroom”,
with 15 mm diameter in top). The probe’s covering
consist in a plastic box (OKW (ENCLOSURES)-
B9002107).The final belt-mounted sensor used to
carotid artery in vivo acquisitions is shown in figure
3 b).
The principle of APW measurement is based on
the transmission of its mechanical energy that shows
up as a displacement of the tissue surface (carotid
artery) to the PZ surface.
Figure 3: a) The PZ probe configuration, the arrow
indicates the externally applied forces, (1) mushroom-
shaped interface, (2) PZ disc sensor and (3) printed circuit
board (PCB) and in b) the final probe is shown.
Figure 4 shows a typical response of the PZ
(gray line) to an APW-like excitation (black line)
A REAL TIME CARDIAC MONITORING SYSTEM - Arterial Pressure Waveform Capture and Analysis
85
obtained in a dedicated test bench (Pereira et al.,
2009). As the microcontroller cannot sample
negative voltages, the PZ signal is level shifted by a
convenient DC value before being fed to the
amplifier. Figure 5 depicts the level shift circuit.
Typically, if collected at the carotid site, it shows
peak amplitudes of around 1V and exhibits a SNR in
the order of 40 dB, allowing subsequent signal
processing algorithms to run free from noise induced
errors.
Figure 4: PZ signal (gray line) in response to APW
excitation (black line). Blue line represents the DC value.
Figure 5: Level Shifter circuit used to PZ signal, before
being fed to the ADC.
2.2 User Interface
As mentioned previously, data are uploaded via
RS232 interface. The system is capable of sending
captured data in real time with a signal acquisition
rate high enough to be useful in real time
hemodynamic monitoring, sampling rate of 1kHz.
This program reads the serial RS232 port and
displays the data in a graph. It stores the received
data in an individual text file for each measurement.
This GUI is based on the one developed by Kerhuel
(2010).
3 SOFTWARE MODULES
In the system design, the speed of computation and
memory capacity are considered as top importance
characteristics.
Microchip MPLAB v8.30 is used for building the
modules using the C30 compiler for C
programming, which simplifies code generation.
We also use the MathWorks Simulink platform
to generate C code. It provides an interactive
graphical environment in which the algorithms are
developed in the form of block diagrams. With the
aid of Real Time Workshop Embedded Coder it can
be used to generate the target independent ANSI C
code. The code generated can be included into
MPLAB IDE projects. The flowchart below
represents the programming stages. The program is
based in the available blockset Embedded Target for
PIC/dsPIC (Kerhuel, 2010).
Figure 6: Flowchart of the stages of programming. The
microcontroller transmits the data in real time through
UART (universal asynchronous receiver/transmitter).
The C code includes the following software
modules:
• Integration function
• Peak identification
• Baseline restoration
• Time Delay
0 0.2 0.4 0.6 0.8 1
-0.5
0
0.5
1
1.5
2
V
R1
R2
U1A
TL082CD
3
2
4
8
1
U2
INA128P
6
4
7
3
2
5
1
8
VCC
VSS
VCC
R3
VCC
VSS
PZ signal (LS)
PZ signal
Time (s)
PECCS 2011 - International Conference on Pervasive and Embedded Computing and Communication Systems
86
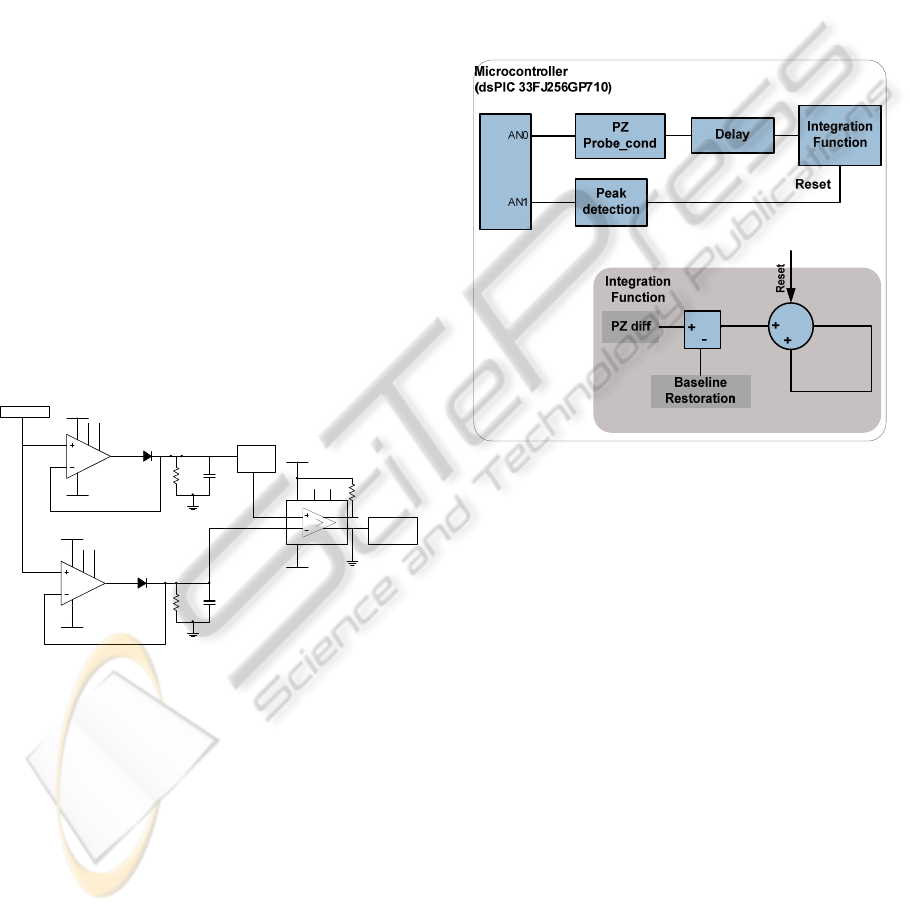
3.1 Physiological Assumptions
We start by recalling that, due to the inherently
capacitive nature of the sensor, its voltage signal will
inevitably occurs in the shape of a time derivative of
the APW and, consequently, the output stage will
perform an integration of the signal in order to
recover the original APW.
The prominent point’s identification is an
important task to identify different phases of the
cardiac cycle, and for hemodynamic parameters
extraction (Almeida et al, 2011).
As is well known, signal integration requires a
periodic reset signal to avoid saturation. A time
reference, for the reset signal must be identified in a
pulse by pulse basis. The prominent peak in figure 4
(gray line) corresponds to the highest rise slope of
the pressure waveform, few milliseconds after the
beginning of the pulse (ventricular contraction). To
identify this peak the PZ signal is fed to a peak
detector (figure 7) formed by two peak stretchers
(U3, D1, R4, C1 and U4, D2, R5, C2) and a
comparator (U5).
To avoid false triggers the peak stretchers have
different time constants, R4C1 and R5C2
, chosen
according to the typical signals, and one this is level
shifted before being fed to the comparator.
Figure 7: Peak detector circuit.
This mechanism contributes to the baseline
restoration process. The elimination of baseline drift
consists in forcing the foot of systolic pulses to start
close to zero without affecting the shape of the
signal.
Like many other biosignals, APW pulse drift
essentially correlates to three sources: respiratory
activity, variations in signal shape and signal jitter
(defined as a random variation of the of the pulse
period). If an operator holds the probe during data
collection, an extra source of baseline drifts shows
up due to the variations of its interaction with the
patient. In in vivo tests a collar is used to eliminate
the influence of the operator.
In a typical measuring session, the first few
pulses are used just to gather the two main system
adjustment parameters: time delay and baseline
level, both to be used in the signal integration. Then
real data collection starts for as long as possible (no
discomfort for the patient that is asked not to
swallow during data acquisition). Typically, one to
two minutes allows the acquisition of a number of
cardiac pulses high enough for the statistical
processing that follows.
In figure 8 a flowchart of the system design is
represented.
Figure 8: System overview. Acquisition/processing
platform of the system.
4 RESULTS
The real time embedded system developed for
cardiovascular applications was tested using cardiac
simulated waveforms, synthesized using a weighted
combination of exponential functions (Almeida et
al., 2010).
An Agilent 33220A arbitrary wave generator
delivers the signal that excites the system via a test
input coupled through a capacitor of the same order
of magnitude of the sensor capacity itself).
In vivo tests are performed in some volunteers
that granted their previous written, informed
consent.
Peak detection (Figure 9) and delayed PZ
waveform (Figure 10, black line) intermediate
signals are shown. The relative error is computed
from the data shown in Figure 11 a), comparing the
integrated waveform with the excitation waveform
(Agilent).
U3
TL081CD
3
2
4
7
6
51
VCC
VSS
D1
R4 C1
U4
TL081CD
3
2
4
7
6
51
VCC
PZ signal
VSS
D2
R5 C2
VCC
U5
LM311D
B/STBVS+ BAL
VS-
2
3
4
8
7
5 6
1
VCC
VSS
VSS
R6
VCC
Peak
detection
Level
Shifter
A REAL TIME CARDIAC MONITORING SYSTEM - Arterial Pressure Waveform Capture and Analysis
87
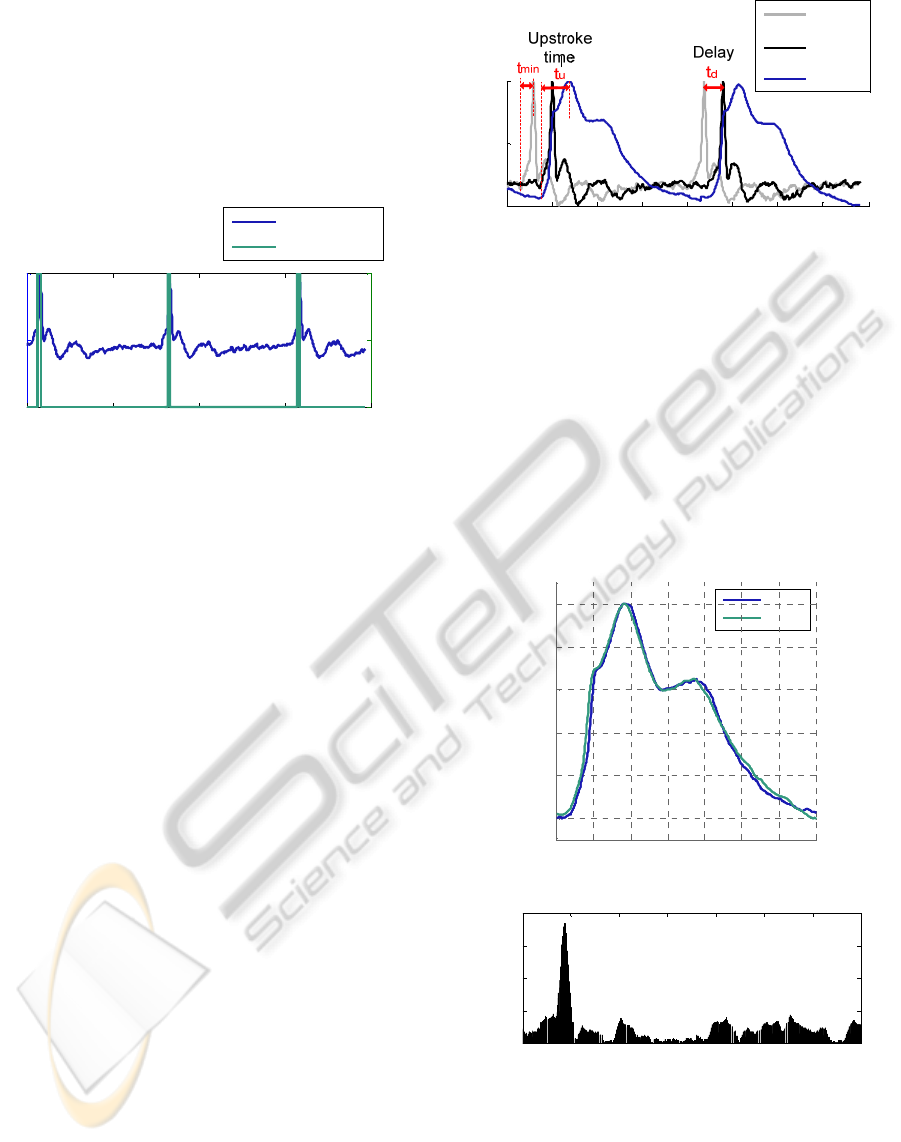
4.1 Peak Identification
The more prominent positive peak (green line) is
identified, as shown in the figure 9 using the circuit
described in figure 7.
As mentioned previously, this peak in the
differentiated signal (PZ diff) corresponds to the
highest rise slope of the arterial pressure waveform.
Figure 9: Results from the peak identification circuit.
4.2 Delay
The ideal delay value required, tmin, rising time of
the most prominent peak in the PZ signal, not being
possible to measure, so a time delay td is calculated
for this purpose, To determine td we use information
about systolic upstroke time, tu, of general APWs,
Buteler (1961) measures the change in systolic
upstroke time in patients with different diseases. The
upstroke time varied between 110 ms and 230 ms. In
our measurements a 110 ms time delay is used to
perform the integration.
min2 ttu ×≈
(1)
230110 ≤≤ tu
(2)
11555 ≤≤ td
(3)
Figure 10 shows the original PZ signal (gray
line) and the delayed PZ signal (black line).
Integration (blue line) is performed for the delayed
PZ signal, as is visible.
4.3 Integration
The system is capable of recovering the APW from a
PZ probe, as is shown in figure 11 where the
excitation (blue) and the recovered waveforms (light
blue) are shown.
Figure 11 b) plots the relative error (defined as
the difference in amplitude from original and
recovered waveform). Table 1 resumes the statistical
parameters of the measurements. The data are
Figure 10: PZ waveform is represented in gray line and
delayed PZ waveform in black line. The integrated
waveform PZ int (integrated) represented in blue line was
obtained from the delayed PZ waveform. tmin - ideal
delay value, tu- time during of systolic upstroke, td- delay
time used in the integration of the PZ waveform.
characterized by a mean value, a minimum and a
maximum, as well as by the standard deviation
(STD) for the relative error, between the excitation
and the recovered waveforms. Maximum error
occurs in the ascendant edge, 88 ms and minimum
error occurs at 450 ms. The mean value is only 2.19
%, and the. STD is 2.57 %.
Figure 11: a) Integrated waveform (PZ int) and the
excitation waveform (Agilent). b) The relative error
between the original and the final waveform.
0 0.5 1 1.5 2
-200
0
200
Time (ms )
0 0.5 1 1.5 2
0
0.5
1
PZ
diff
Peak detection
A.U.
A.U.
0 0.2 0.4 0.6 0.8 1 1.2 1.4 1.6
0
0.5
1
Time (m s)
A.U.
PZ
probe
PZ
probe
(delay)
PZ int
0 100 200 300 400 500 600 700
0
0.2
0.4
0.6
0.8
1
Time (ms )
A.U.
Agilent
PZ int
0 100 200 300 400 500 600 700
0
5
10
15
20
Time (ms)
| Agilent-PZ int | (%)
a)
b)
PECCS 2011 - International Conference on Pervasive and Embedded Computing and Communication Systems
88
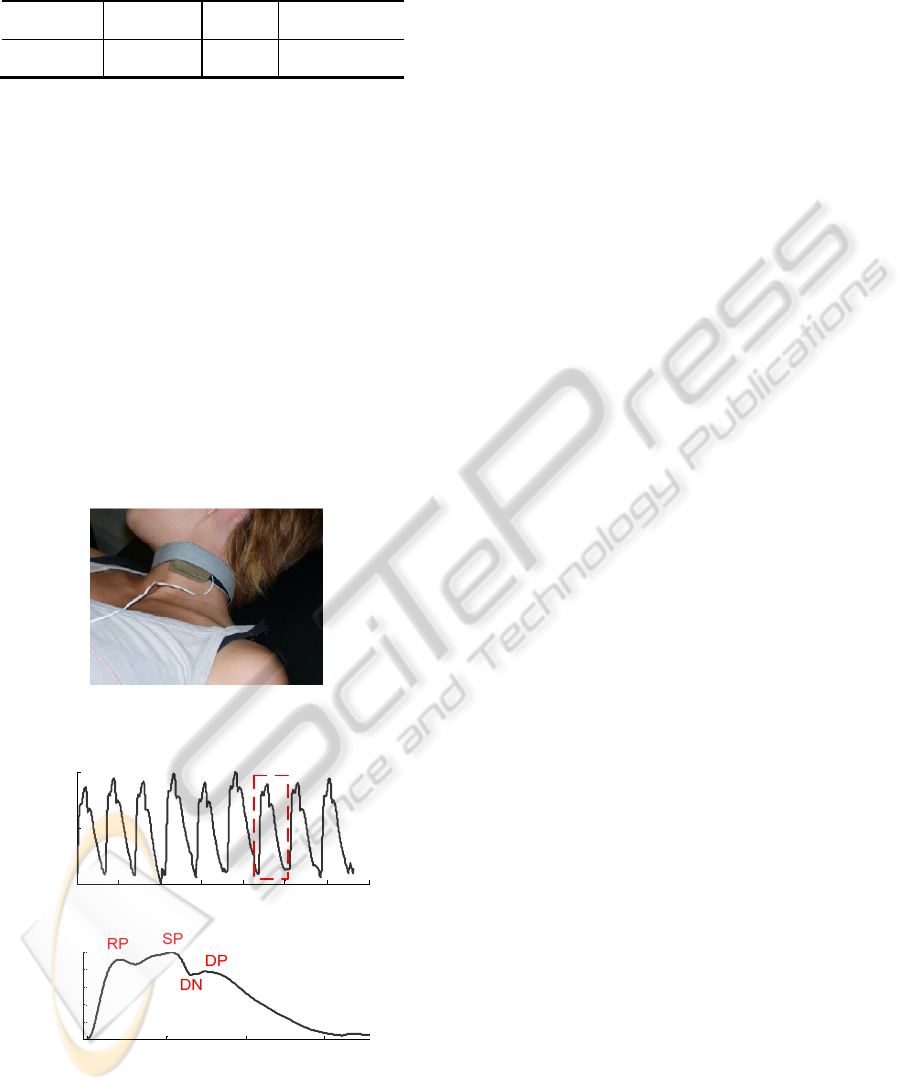
Table 1: Statistics information of measurements depicted
in figure 11 b).
Maximum
(%)
Minimum
(%)
Mean
(%)
STD Deviation
(%)
18.520 0.001 2.1999 2.572
4.4 In vivo tests
To assess the capability of the system in
distinguishing different points in APW morphology
a small universe of volunteers was analysed.
The PZ probe is held by a collar and placed in
the carotid artery site for in vivo data acquisition
(figure 12).
The output shows a typical waveform where the
most prominent points are easily identified: systolic
peak (SP), reflection point (RP), dicrotic notch (DN)
and dicrotic peak (DP). The effect of the baseline
restoration mechanism that prevents baseline
fluctuations along time can also be seen. In figure 13
a set of pulses, about 7 seconds are shown, where is
possible identify a typical morphology of the APW
with its prominent points identified in b).
Figure 12: Our probe is held by a collar and placed over
carotid artery.
Figure 13: a) A set of pulses and in b) is shown a detail
view of one pulse. RP-reflected point, SP-systolic peak,
DN-dicrotic notch, DP-dicrotic peak.
5 CONCLUSIONS
In this paper, we presented the design of a real time
cardiac monitoring system for APW capture. A PZ
sensor was integrated in a signal acquisition circuit
that communicates with a dsPIC. Application
software running on the matlab was also developed
to receive and plot APW signals.
Currently we are studying the clinical use of our
probe, in medical environment, comparing our data
with catheter collected data to prove that this system
is a valid alternative with low cost associated.
Algorithms for the patient’s information must be
integrated in order to extract information about:
heart rate, AI, PWV and reflection points (Almeida
et al 2010, Almeida et al 2011, Pereira et al, 2010).
The proposed system was designated with user-
friendly interfaces which easy the usability of this
system and reduce the need of a long-time-training
before usage. The minimal human intervention is a
fundamental characteristic for this purpose.
ACKNOWLEDGEMENTS
We acknowledge support from Fundação para a
Ciência e a Tecnologia for funding (PTDC/SAU-
BEB/100650/2008 and SFRH/BD/61356/2009) and
from ISA, Intelligent Sensing Anywhere.
REFERENCES
Almeida V., Pereira T., Borges E., Figueiras E., Cardoso
J., Correia C., Pereira H. C., Malaquias J. L. and
Simões J. B., 2010. Synthesized cardiac waveform in
the evaluation of augmentation index algorithms. In
IEEE EMB, Proceedings of the 3rd International Joint
Conference on Biomedical Engineering Systems and
Technologies (BIOSTEC 2010). Valencia, Spain 20-
23 January 2010.
Almeida V., Santos P, Figueiras E, Borges E, Pereira T,
Cardoso J, Correia C., 2011. Hemodynamic features
extraction from a new Arterial pressure waveform
Probe. Accepted to be presented in Biosignals 2011
(BIOSTEC 2011). Rome, Italy.
Avolio A. P., Butlin M., and Walsh A., 2010. Arterial
blood pressure measurement and pulse wave analysis -
their role in enhancing cardiovascular assessment.
Physiol. Meas. 31, R1–R47.
Bansal D., Khan M.,Salhan A. K., 2009. A real time
embedded set up based on digital signal controller for
detection of bio-signals using sensors. Sensors &
Transducers Journal, Vol. 105, Issue 6, pp. 26-32
0 1 2 3 4 5 6 7
0
0.5
1
Time (s )
V
0 0.2 0.4 0.6
0.2
0.4
0.6
0.8
1
Tim e
(
s
)
V
A REAL TIME CARDIAC MONITORING SYSTEM - Arterial Pressure Waveform Capture and Analysis
89

Bing-Nan L., Ming-Chui D., Vai M. I., Mak P. U., 2004.
An embedded medical advisory system for mobile
cardiovascular monitoring devices. IEEE International
workshop on biomedical circuits & systems. S2.1-1-4
Buteler, B., 1961. The relation of systolic upstroke time
and pulse pressure in aortic stenosis.
Germano J., Ramalho R., Sousa L., 2009. On the design of
distributed autonomous embedded systems for
biomedical applications. CST Pervasive Health 2009.
Karki J., Signal Conditioning Piezoelectric Sensors.
[Online] Texas Instruments, Application Report,
SLOA033A (2000) Available at: http://focus.ti.com
/lit/an/sloa033a/sloa033a.pdf [Accessed 21 June 2010]
Kerhuel L., Embedded Target for dsPIC. [Online]
Available at: www.kerhuel.eu. [Accessed 01
November 2010]
Klig V. 1978. Biomedical applications of microprocesors.
Proceedings of the IEEE, vol. 66, no.2, 151-161
Laurent S., Cockcroft J., Van Bortel L., Boutouyrie P.,
Giannattasio C., Hayoz D., Pannier B., Vlachopoulos
C., Wilkinson I., and Struijker-Boudier H., 2006.
Expert consensus document on arterial stiffness:
methodological issues and clinical applications.
European Heart Journal, 27, 2588–2605.
Mackenzie I. S., Wilkinson I. B. and Cockroft J. R., 2002.
Assessment of arterial stiffness in clinical practice. Q J
Med., 95, 67–74.
Pereira H. C., Cardoso J. M., Almeida V. G., Pereira T.,
Borges E., Figueiras E., Ferreira L. R., Simões J. and
Correia C., 2009. Programmable test bench for
hemodynamic studies IFMBE Proc. 25 1460ff
Pereira, H. C., Pereira, T., Almeida, V., Borges, E.,
Figueiras, E., Simões, J. B., Malaquias, J. L., Cardoso,
J. M. R., Correia, C. M. B., 2010. Characterization of
a double probe for local pulse wave velocity
assessment. Physiol. Meas 31,1449–1465
Smolnikar M., Mohorcic M., 2008. A framework for
developing a microchip PIC microcontroller based
applications. Wseas Transactions On Advances In
Engineering Education, vol 5, Issue 2, pp83-91
Van Bortel L. M., Balkestein E. J., van der Heijden-Spek
J., Vanmolkot F. H., Staessen J. A., Kragten J. A.,
Vredeveld J. W., Safar M. E., Struijker-Boudier H. A.
and Hoeks A. P., 2001. Non-invasive assessment of
local arterial pulse pressure:comparison of applanation
tonometry and echo-tracking. J. Hypertens. 19 1037–
44
PECCS 2011 - International Conference on Pervasive and Embedded Computing and Communication Systems
90
