
BALL ROTATION DETECTION BASED
ON ARBITRARY FEATURES
Alexander Sz
´
ep
Institute of Computer Technology, Vienna University of Technology, Gusshausstr. 27-29/384, A-1040 Vienna, Austria
Keywords:
Visual rotation detection, Motion tracking, Sports engineering, Racket equipment classification.
Abstract:
This work presents an objective method to detect ball rotation in image sequences. We apply this method to
objectively classify racket sports equipment. Therefore, we observe the ball impact on a racket and compare
rotation differences detected prior to and after the impact. The method combines ball center tracking with sur-
face corner tracking to calculate ball rotation. Because our method’s application has real-time constraints our
rotation detection is fully automatic. The bottom line: Our experimental results enable racket classifications.
Athletes and sports federations are therefore our stakeholders.
1 INTRODUCTION
We present a visual method for detecting ball rotation
aimed for the ball sports domain. Knowledge about
ball rotation enables a range of applications for sports
where rotation plays a crucial role like in table tennis,
tennis, soccer, baseball, golf, bowling, and billiard.
Our envisioned application in racket sports is racket
equipment classification. The amount of rotation a
racket imparts on a ball is a significant classification
factor. Such classifications can be used in two ways:
First, athletes can make objective and deliberate de-
cisions to purchase equipment. Second, sports feder-
ations can classify illegal equipment which does not
conform to the rules.
Ball rotation has been analyzed in following sports
domains: tennis (Goodwill and Haake, 2004), soc-
cer (Neilson et al., 2004), table tennis (Tamaki et al.,
2004), and baseball (Theobalt et al., 2004). Neilson et
al. (Neilson et al., 2004) measure the spin of a soccer
ball. Their results are based on a unique color pat-
tern on the ball surface where each 2D view of the
ball identifies its 3D position. Our approach in con-
trast works with arbitrary corner features on a ball’s
surface. Tamaki et al. (Tamaki et al., 2004) mea-
sure ball spin of table tennis balls. Their approach is
based on image registration in addition to depth infor-
mation from a manually fitted 3D sphere model. The
work of Boracchi et al. (Boracchi et al., 2009) exam-
ines spin by analyzing blurred images. For the general
case of a spinning and translating ball they propose a
semi-automatic user-assisted approach. Both (Tamaki
et al., 2004) and (Boracchi et al., 2009) require man-
ual user intervention whereas our approach is fully
automatic. Theobalt et al. (Theobalt et al., 2004) de-
termine the spin of baseballs based on multi-exposure
stereo images. Their approach relies on 3D depth data
of predefined tracked color markers. We instead only
use a single camera and do not need depth informa-
tion.
Our contribution is a fully automated rotation de-
tection without user intervention. The high-speed
cameras we use deliver gray scale image data. There-
fore, our method copes with arbitrary corner features
in gray scale image data. We provide detection re-
sults within less than three seconds for 20 processed
frames—this is sufficient to classify a racket. Further,
our method is independent from any motion model
and works with monocular camera data. We point out
that we only detect rotation with an axis perpendicular
to the image plane.
We briefly explain our data acquisition setting in
Section 2 followed by implemented method details in
Section 3. In Section 4 we discuss experimental re-
sults and revise our contribution.
2 DATA ACQUISITION
We use rotating table tennis balls as a test environ-
ment. Compared to tennis, soccer, baseball, and
golf we can reproduce and verify results with less
effort due to a simpler data acquisition setting, de-
700
Szép A..
BALL ROTATION DETECTION BASED ON ARBITRARY FEATURES.
DOI: 10.5220/0003372707000703
In Proceedings of the International Conference on Computer Vision Theory and Applications (VISAPP-2011), pages 700-703
ISBN: 978-989-8425-47-8
Copyright
c
2011 SCITEPRESS (Science and Technology Publications, Lda.)

picted in Figure 1. We use an automatic ball feeder
(on the left in the figure) to obtain repeatable pre-
conditions. The feeder propels the balls with back-
spin (3800 ± 100 revolutions per minute (rpm)) to-
wards the rigidly mounted racket from a short dis-
tance (0.5 m)—we capture the ball before and after
impact on the racket with a high-speed camera. The
image plane is parallel to the translational ball motion
and the camera observes the ball from 2 m distance
(focal length 100 mm). We light the scene with three
1000 W floodlights to achieve enough contrast on the
ball contour and on the ball surface features for fur-
ther processing. The main light direction of all three
floodlights is positioned perpendicular to the image
plane. The frame rate is 1000 frames per second (fps),
the exposure time is
1
7000
s to minimize motion blur,
and the captured image sequences have a resolution of
1280 × 512 pixels (landscape). Every certified table
tennis ball has a printed logo of the manufacturer on
its surface. A single logo is an insufficient feature for
our measurement approach, therefore we augment the
surface texture with additional painted artificial fea-
tures to ensure visible texture in every captured frame.
Figure 1: Data acquisition setting.
3 SPIN CALCULATION
Figure 2 depicts the detection principle with four su-
perimposed frames of a sequence—the ball moves
from left to right as in Figure 1. The first two frames
are taken prior to the ball impact whereas the last two
frames are taken after the impact. For better visibility
a yellow dot marks a particular surface corner which
is tracked in all five frames (this yellow dot only aug-
ments Figure 2 and does not exist on the ball itself).
The rotation magnitude results from the angle the dot
has traveled between two frames within an elapsed
time. Blue dashed lines mark the ball center in each
frame and solid red lines indicate the current angle of
the tracked dot with reference to the current ball cen-
ter. We calculate rotation magnitudes (spin rates) for
the sequence between frames 13 and 19 as well as be-
tween frames 36 and 56. The lower part of the figure
sums up the interpretation and calculation: An angle
difference of 138.5
◦
within 6 frames corresponds to
Figure 2: Detection principle.
3847 rpm whereas an angle difference of 17
◦
within
20 frames corresponds to 141 rpm.
Our basic idea is the calculation of displacements
between corresponding corners in two subsequent
frames. The approach consists of the following six
steps:
Step 1: Segmenting ball from background: To do this,
we learn a background model based on frames be-
fore a ball becomes visible in the scene. During this
learning phase we observe a certain intensity range for
each image pixel. After the learning phase a pixel is
considered as foreground when this pixel’s intensity
value is outside the learned intensity range.
Step 2: Determining center position: First, we fit a
bounding box around the ball contour. Second, we fit
a circle into this bounding box. Figure 3 shows an
input image with a superimposed fitted circle and the
ball center. This image highlights a problem: If the
ball surface is not lit uniformly, as in our case, the
contrast varies between the projected sphere contour
and the background. This hinders accurate circle fit-
ting and center finding.
Figure 3: Circle fitting to ball contour.
BALL ROTATION DETECTION BASED ON ARBITRARY FEATURES
701
Step 3: Identifying corners within the ball contour:
According to the criterion for “good” corners in (Shi
and Tomasi, 1994) we identify corners where both
eigenvalues of the second moment matrix are above
a certain threshold. We set the threshold to 80% of
the best found corner’s lower eigenvalue.
Step 4: Tracking identified corners: For finding cor-
respondences between found corners we apply the
pyramid version of the Lucas-Kanade optical flow
algorithm (Lucas and Kanade, 1981) which allows
for larger displacements than the conventional Lucas-
Kanade approach.
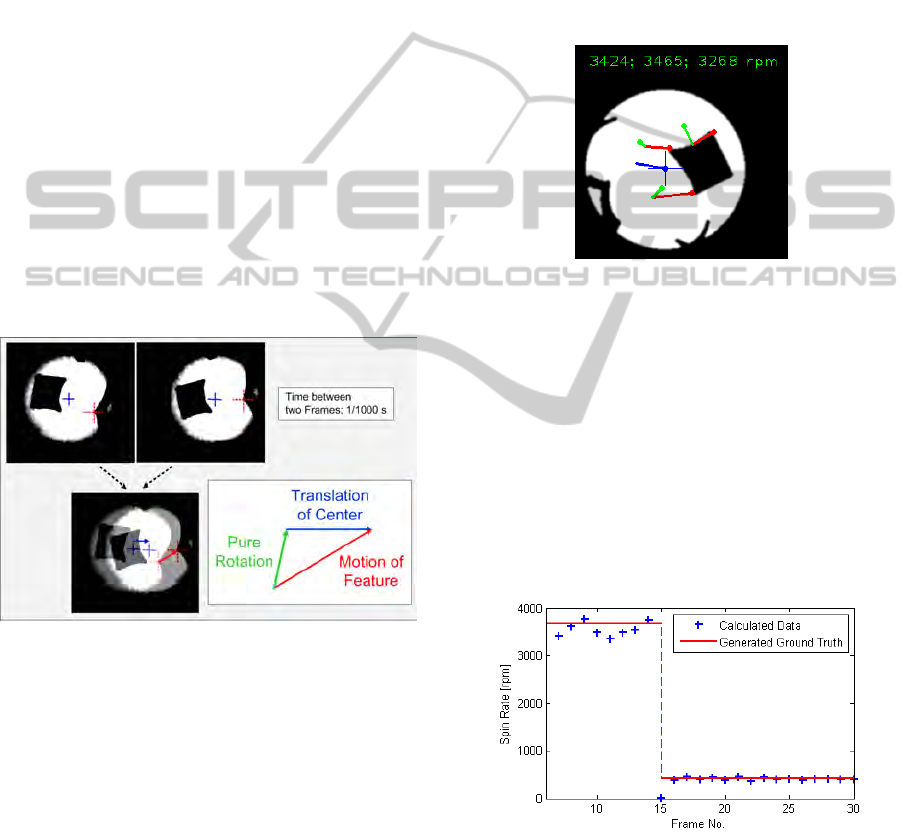
Step 5: Calculating rotational displacement: Figure 4
explains the spin calculation based on vector subtrac-
tion by means of two frames (top row of figure) super-
imposed in a third frame (lower row of figure). The
solid blue crosses mark the ball center and the dashed
red crosses mark the tracked corner. The vector sub-
traction is depicted right of the superimposed frame:
The ball translation vector in blue is subtracted from
the general corner displacement vector in red. This
results to the pure rotational displacement of the cor-
ners highlighted in green.
Figure 4: Calculating rotational displacement.
Step 6: The spin magnitude is calculated with
straightforward trigonometry and requires no further
details.
4 RESULTS AND CONCLUSIONS
Obtaining ground truth data from real image se-
quences is a tedious task. Therefore, we gener-
ated synthetic image sequences where ground truth
is known. Figure 5 visualizes a snapshot of an ana-
lyzed synthetic image sequence where the simulated
spin is 3667 rpm prior to impact. Three corners of
the square-like region are automatically chosen and
tracked. The upper right image corner contains the
three computed corresponding spin values. Ideally,
all three values should be the same, the difference be-
tween them indicates inaccuracy. Seven vectors with
three different colors are visible, their end points are
marked with dots of the same color. According to Fig-
ure 4 the ball center translation is shown in blue, the
tracked corners’ general displacements are shown in
red, and the pure rotational corner displacements after
vector subtraction of the center translation are shown
in green. In this particular snapshot we obtain a mean
error of -7.7%.
Figure 5: Spin computation (synthetic image sequence).
Figure 6 shows the calculated spins of the syn-
thetic image sequence. Ground truth spin prior to
impact is 3667 rpm and after impact 417 rpm. The
values in this diagram represent average values calcu-
lated over the number of each spin value contributed
by the tracked corners—with reference to Figure 5
this is an average over three values. Of course this
simple averaging includes also outliers but we wanted
to show the mean result variation. The mean measure-
ment error prior to impact is -4.7% and after impact
-0.9%.
Figure 6: Results of synthetic image sequence.
Figure 7 depicts a snapshot of an analyzed real
image sequence where the manually measured spin
is 3750 rpm prior to impact. The mean error -20.5%
of this sequence results mainly from inexact contour
fitting and thus, inexact center computation because
of non-uniform lighting especially at the first frames.
VISAPP 2011 - International Conference on Computer Vision Theory and Applications
702

A comparison between Figure 7 and Figure 5 illus-
trates the apparently different shape of ball contours
after segmentation, additionally only two corners are
tracked in the real sequence due to corner correspon-
dence quality.
Figure 7: Spin computation (real image sequence).
Figure 8 shows the calculated spins of a real im-
age sequence. Ground truth spin prior to impact is
3750 rpm and after impact 500 rpm. Our ground truth
values are themselves error-prone as we obtain them
by manually measuring angle differences in the se-
quence on a computer display. As mentioned above
the large deviations of the values prior to impact re-
sult from inexact contour fitting due to non-uniform
lighting. The mean measurement error prior to impact
is -21.8% but is simultaneously less important. Prior
to impact we can assume that the ball feeder gener-
ates a constant spin through all captured sequences—
therefore, spin prior to impact needs not to be mea-
sured accurately because no changes are expected.
In contrast, after impact, when we expect differences
caused by different rackets, the mean error magnitude
descends significantly to 2.4%.
Figure 8: Results of real image sequence.
We captured experimental sequences with five dif-
ferent rackets according to Figure 1—overall eight se-
quences were captured, some of them with the same
racket. Manual spin measurements after impact re-
vealed an average spin range per sequence between
200 and 1250 rpm.
We have shown a motion analysis approach espe-
cially for the measurement of ball spin. Experiments
proved this method’s feasibility to infer racket prop-
erties from spin measurements based on arbitrary sur-
face features without user intervention. The execution
time for processing 20 frames was about 3 seconds (s)
(run on an Intel Core i7 L620, 2 GHz processor). A
sequence of 20 captured frames is sufficient for a sig-
nificant racket classification and the time delay of 3s
is acceptable for on site classification of illegal rack-
ets during sport events.
Future Work: We will successively challenge our
method’s robustness by decreasing the number of ar-
tificial surface features. Another measurement setting
with two opposing cameras can lower the risk of oc-
cluded features even when only a single feature is ex-
istent on the whole ball surface.
REFERENCES
Boracchi, G., Caglioti, V., and Giusti, A. (2009). Estima-
tion of 3d instantaneous motion of a ball from a single
motion-blurred image. In VISIGRAPP, pages 225–
237.
Goodwill, S. R. and Haake, S. J. (2004). Ball spin genera-
tion for oblique impacts with a tennis racket. Experi-
mental Mechanics, 44(2):195–206.
Lucas, B. D. and Kanade, T. (1981). An iterative image-
registration technique with application to stereo vi-
sion. In Proceedings of International Joint Conference
on Artificial Intelligence (IJCAI), pages 674–679.
Neilson, P., Jones, R., Kerr, D., and Sumpter, C. (2004).
An image recognition system for the measurement of
soccer ball spin characteristics. Measurement Science
and Technology, 15(11):2239–2247.
Shi, J. and Tomasi, C. (1994). Good features to track. In
1994 IEEE Conference on Computer Vision and Pat-
tern Recognition (CVPR’94), pages 593–600.
Tamaki, T., Sugino, T., and Yamamoto, M. (2004). Measur-
ing ball spin by image registration. In Proceedings of
the Tenth Korea-Japan Joint Workshop on Frontiers of
Computer Vision, pages 269–274.
Theobalt, C., Albrecht, I., Haber, J., Magnor, M., and Sei-
del, H.-P. (2004). Pitching a baseball - tracking high-
speed motion with multi-exposure images. In Pro-
ceedings of ACM SIGGRAPH.
BALL ROTATION DETECTION BASED ON ARBITRARY FEATURES
703
