
FLEXIBLE CONTROL OF PERFORMANCE AND EXPENSES FOR
DATABASE APPLICATIONS IN A CLOUD ENVIRONMENT
Shoubin Kong, Yuanping Li
Department of CS&T, Tsinghua University, Beijing 100084, China
Ling Feng
Department of CS&T, Tsinghua University, Beijing 100084, China
Keywords: Cloud computing, Infrastructure-As-A-Service (IaaS), Virtual machine (VM), Resource configuration,
Performance, Expenses, Multiple objective optimization.
Abstract: IaaS is a popular cloud computing service paradigm based on virtualization technology. In an IaaS cloud
environment, the service provider configures VMs with physical computing resources (e.g., CPU and
memory) and leases them to IaaS customers to run their applications. The customers pay for the resources
they use. Such a pay-as-you-go charging mode brings about a few critical concerns about the expenses paid
and the performance received. From the standpoint of cloud customers, such concerns as minimizing the
expenses while ensuring the performance, optimizing the performance within the budget limit,
compromising the expenses and performance, or balancing performance of applications running on different
VMs, etc. thus arise. For the IaaS provider, how to reasonably configure VMs so as to meet various
requirements from different customers becomes a challenge, whose solution influences the acceptance of
IaaS in the future. In this paper, we address this problem and present a weighted multiple objective
optimization approach for flexible control of expenses and performance in an IaaS cloud environment. We
focus on database applications, consisting of various queries to be executed on different VMs. A genetic
algorithm is implemented based on a fine-grained charging model, as well as a normalized performance
model. Experiments have been conducted to evaluate the effectiveness and efficiency of our approach, using
TPC-H queries and PostgreSQL database in a simulated cloud environment.
1 INTRODUCTION
IaaS is an important cloud computing service
paradigm provided by a few well-known IT
companies such as Amazon, IBM, etc. IaaS depends
largely on virtualization technology, enforcing
simple and flexible management of computing
resources. As a result, customers can get desirable
resources as needed, and the IaaS provider charges
the customers for the resources they use. This is
coined as “pay-as-you-go”. Under such a charging
mode, from the standpoint of IaaS customers, a few
critical concerns about expenses paid for the service
and obtained performance of their applications thus
inevitably arise.
Let’s consider such a scenario. An IaaS customer
wants to run several database applications on a few
VMs in an IaaS cloud environment. How to
configure these VMs with reasonable physical
computing resources is the first issue that the IaaS
provider needs to solve. At the same time, the
customer may also have a number of doubts and
questions about the expenses to be paid for the
resources, as well as the obtained applications’
performance.
1) Is it possible to achieve the best performance
within a budget limit?
2) Is it possible to minimize the expenses while
still guaranteeing the performance?
3) Is it possible to make a compromise between
expenses and performance?
4) Is it possible to achieve a balanced
performance when running different applications on
different VMs under the premise of guaranteeing the
overall performance?
From the perspective of the IaaS provider,
201
Kong S., Li Y. and Feng L..
FLEXIBLE CONTROL OF PERFORMANCE AND EXPENSES FOR DATABASE APPLICATIONS IN A CLOUD ENVIRONMENT.
DOI: 10.5220/0003379802010210
In Proceedings of the 1st International Conference on Cloud Computing and Services Science (CLOSER-2011), pages 201-210
ISBN: 978-989-8425-52-2
Copyright
c
2011 SCITEPRESS (Science and Technology Publications, Lda.)

proper answers to the above-mentioned questions
apparently determine the acceptance of IaaS by its
potential cloud customers.
The aim of this paper is to provide a solution to
address the above-mentioned questions. Based on a
fine-grained charging model with respect to the
usage of CPU and memory, along with a normalized
performance model, we formalize the above-
mentioned problems into a multiple objective
optimization problem, and solve it by means of a
genetic algorithm.
Considering that a customer may have a variety
of applications or queries from the same application
running on different VMs, a uniform and reasonable
performance model is a challenge here. For example,
an airline ticket database application supports not
only OLTP queries like querying flight schedules,
but also OLAP queries like mining association rules
from the data. In this case, 1 minute may be too long
for OLTP queries, but 1 hour is still acceptable for
OLAP queries. Therefore, using the absolute
execution time of queries to measure the
performance of different types of queries isn’t
reasonable, and may lead to skewed resource
configuration. In this paper, we tackle this issue
through normalization of execution time.
To evaluate the effectiveness and efficiency of
our approach, we conduct some experiments by
running a few typical TPC-H queries in a simulated
IaaS cloud environment. The results are as follows:
1) The performance model with execution time
normalization can effectively avoid skewed
resources configuration.
2) The optimized resources configuration
strategy given by our approach can get 20% even up
to 30% performance improvement over the default
configuration.
3) The multiple objective optimization method
can effectively save the expenses when the increase
of computing resources contributes to little
improvement of performance. It can also help
balance the performance of applications running on
different VMs with little drop of overall
performance.
4) Benefiting from our performance model for
individual queries, our approach is quite adaptable to
resource requirements of different applications.
The contribution of the paper primarily lies in
two aspects. 1) A weighted multiple objective
optimization approach is proposed for flexible
control of expenses and performance in an IaaS
cloud environment, with an aim to meet a variety of
requirements coming from different cloud
customers. 2) A normalized performance model is
built, taking different kinds of applications from a
customer into account.
The remainder of the paper is organized as
follows. In Section 2, we review some closely
related work and highlight the differences of our
work from existing ones. In Section 3, we formalize
the problem and present our solution. We describe
our performance study in Section 4, and conclude
the paper in Section 5.
2 RELATED WORK
Virtualization technology has received lots of
attention in both industry and academia. IaaS is a
typical application of virtualization in industry. In
recent years, issues on resource and performance
management and resource charging in virtualized
environments become hot research topics in
academia.
Performance Management. Performance is a
critical concern in virtualization for cloud customers.
To deliver satisfactory application performance,
tremendous efforts have been made, including
performance management and application behavior
analysis (Xiong et al., 2010), application
performance isolation in a virtualized environment
(Somani and Chaudhary, 2009), power and
performance management in virtualized computing
environments via lookahead control (Kusic et al.,
2009), automated control of multiple virtualized
resources (Padala et al., 2009), proper resource
configuration for virtual machines (Rao et al., 2009,
Bu et al., 2010), balancing power and application
performance for virtualized server clusters (Wang
and Wang, 2009), control of resource allocation and
power management in virtualized data centers
(Urgaonkar et al., 2010). However, none of these
work incorporated the cost or expenses for using
resources in cloud environments, which is an
important focus of this paper.
There has also been some work on improving the
performance of database applications in a virtualized
environment through different methods, including
on-demand provisioning of virtual machines
(Shivam et al., 2007), and resource configuration of
virtual machines (Soror et al., 2008). We also
consider resource configuration in this study.
However, we are oriented at a scalable cloud
environment, while the work of Soror et al. (2008) is
based on a fixed amount of physical resources
shared by multiple VMs and their assumption that
execution time of queries is linear in the inverse of
CLOSER 2011 - International Conference on Cloud Computing and Services Science
202

resource allocation level is limited to small
adjustments in resource configuration.
Resource Charging. The resource charging of IaaS,
which is another important aspect the cloud
customers care about, has become focus of some
researchers in the last two years.
Florescu and Kossmann (2009) emphasized the
necessity of minimizing cost given performance
requirements, and Henzinger et al. (2010) proposed
a fine-grained charging model in a simulated cloud
environment. The charging model generally refers to
how IaaS providers charge for their services.
Usually IaaS providers set the leasing price for each
kind of computing resource, and customers pay for
the resources configured for their VMs. The current
charging model of IaaS is that providers offer and
charge for fixed configured VMs. For example,
Amazon EC2 offers 10 different kinds of resource
configurations for VMs. If a customer’s application
running on one VM, s/he needs to pay the amount
corresponding to that VM of a fixed resource
configuration. Rogers et al. (2010) further presented
a framework for minimizing the operational cost on
Amazon EC2 within target QoS expectations. But
this work assumed that each VM runs a single type
of queries, and took operational cost as the sole
optimization objective.
Our work differs from the above-mentioned
charging models in the following three aspects. First,
we adopt a pay-as-you-go charging strategy, wherein
customers can ask for a flexible (rather than fixed)
amount of resources (i.e., CPU and memory) for
personalized configuration as needed. Second, we
consider a more complex yet realistic query
workload to be executed by a VM, considering that
one VM may be assigned different types of queries
in some real-world applications. Third, besides
optimizing application performance and expenses,
we also try to balance performance across different
VMs, since one customer may have more than one
VM to run their business. To this end, we set up a
multiple objective optimization model, aiming to
optimize performance, minimize expenses, and
balance application performance across different
VMs.
3 MODELING AND SOLUTION
In this section, we present our approach to formalize
and solve the problems mentioned above. First, we
obtain a performance model for individual queries
by fitting sample data. Then we build a uniform
performance model for workloads through
normalization of execution time. After that, the
problem of performance and expenses control is
turned into a weighted multiple objective
optimization problem. At last, we present some
details of the genetic algorithm implemented to
solve the problem.
3.1 Preliminaries
Suppose an IaaS customer has N query workloads to
be running on the same number of VMs. A workload
on a VM is composed of one or more (i.e. mixed)
types of queries. In another word, one workload
corresponds to one special VM, and may contain
various types of queries. For each workload, assume
the percentage of each type of queries is given,
which can be obtained in practice by sampling and
statistic.
Let W
i
denote the workload running on the
i
th
VM (
1 iN
≤
≤
). To model mixed queries in a
workload, let Q
ij
be the
j
th type of queries in W
i
and let p
ij
denote the percentage of Q
ij
in W
i
(
1
i
jn
≤
≤
); let n
i
be the number of query types in
W
i
. To express the resource configuration of VMs,
let c
i
be the CPU capacity of the
i
th VM, e.g. 1GHz,
and let m
i
be the memory size of the
i
th VM, e.g.
1GB.
3.2 Performance Model for Individual
Queries
To establish relationship between expenses and
performance, we need a mapping function from
computing resources (CPU, memory) to the
execution time of queries, i.e. performance model
for queries. We can obtain the mapping function by
fitting some sample data. And there are two sources
of the sample data; one is the estimates of DBMS
query optimizer (Soror et al., 2008), the other is the
real experiment data. In order to ensure the accuracy
of the data, we have adopted the real experiment
data obtained by running TPC-H queries on VMs
with different resources configuration. By
leveraging nonlinear surface fitting functions of the
numeric analysis software Origin 8.0 over the
sample data, we found the Rational2D function
fitted the data well, with the R
2
value reaching 0.99.
R
2
is an indicator of the goodness of fit, and a R
2
value close to 1 indicates that the fit is a good one.
The fitting algorithm in Rational2D function is
based on LMA (Levenberg-Marquardt Algorithm
(More, 1978)), a robust iterative algorithm effective
FLEXIBLE CONTROL OF PERFORMANCE AND EXPENSES FOR DATABASE APPLICATIONS IN A CLOUD
ENVIRONMENT
203
to nonlinear fitting problems. The standard form of
the Rational2D function is as follows:
23
01 2 3 4
23 2
56 7 89
1
ij ij i ij i ij i ij i
ij
ij i ij i ij i ij i ij i
AAxAyAyAy
t
A
xA x A x A yA y
+×+×+×+×
=
+×+×+×+×+×
(1)
where
ij
t
is the execution time of
ij
q
;
1
ii
x
c
=
,
wherein c
i
is the CPU capacity of the
i
th VM;
1
ii
ym=
, wherein m
i
is the memory size of the
i
th
VM;
ijk
A
(
09k≤≤
) is the coefficient obtained by
fitting the sample data.
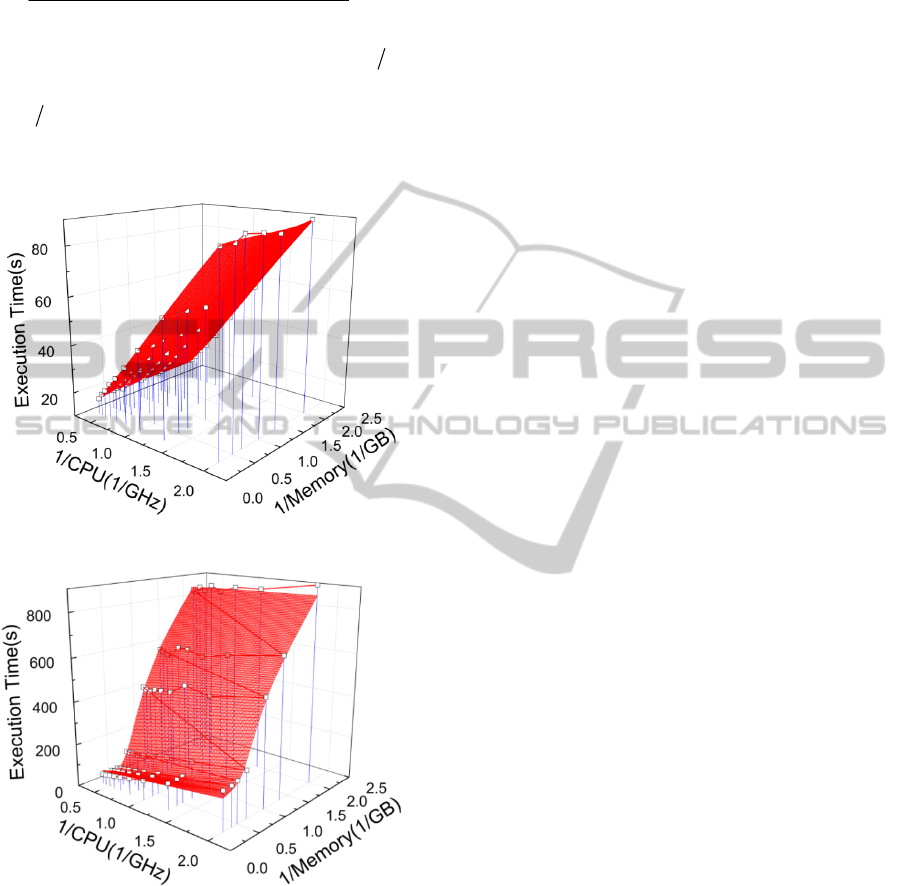
Figure 1: The fitted result for Q13.
Figure 2: The fitted result for Q21.
Figure 1 and 2 show the fitted results for two
typical types of query, Q13 and Q21, which are
respectively a CPU-intensive and a memory-
intensive query from TPC-H benchmark. The
execution time of CPU-intensive queries is mainly
influenced by CPU capacity, while that of memory-
intensive queries is mainly influenced by memory
size.
3.3 Performance Model for Workloads
After obtaining the mapping function, we need an
expression to formalize the performance of each
workload. At first, we consider using the expected
execution time of queries in a workload, which is
1
i
n
iijij
j
Tpt
=
=
×
∑
(2)
where T
i
is the expected execution time of queries in
W
i
, which is taken as the execution time of W
i
.
However, sometimes this may lead to unreasonable
resources configuration. For example, the workload
on a VM instance contains two different types of
queries, one is CPU intensive and the other is
memory intensive; the order of magnitude of the
execution time of the former is 1ms, and that of the
later is 1000ms. Besides, the CPU-intensive query
accounts for 90% of the workload, and the memory-
intensive one 10%. Obviously, the former plays a
dominant role in this workload, so the right way to
improve the performance of the workload should be
giving it more CPU capacity. In order to satisfy most
query requests, we hope to pay 90% of our
optimization effort on the CPU-intensive query.
However, if using formula (2), the result of 90%
multiplying by 1, 0.9 is much less than 100, that of
10% multiplying by 1000. In this case, the memory-
intensive query will be mistaken for the dominator
of the workload, which will lead to incorrect
resources configuration. That is to say, difference of
the order of magnitude of the execution time may
lead to undesirable and even wrong configuration
strategies. So it’s necessary to normalize the
execution time of different types of queries.
Formula (3) shows our normalization method,
multiplying the execution time by a normalization
factor
λ
. Formula (4) is the expression of the
normalization factor; the denominator is the average
execution time of the standard type of queries
selected beforehand, and the numerator is that of
other queries. The average execution time of each
type of queries can be obtained from sample data,
and the ratio is taken as the normalization factor to
eliminate the undesirable influence of different order
of magnitude of the execution time. In following
sections, unless otherwise specified, any execution
time is the normalization time with average
execution time ratio.
ij ij ij
tt
λ
′
=
×
(3)
CLOSER 2011 - International Conference on Cloud Computing and Services Science
204

ij s ij
tt
λ
=
(4)
ij
t
′
is the normalization result of
ij
t
(
1
i
jn≤≤
);
ij
λ
is
the normalization factor of
ij
t
(
1
i
jn≤≤
);
s
t is the
average execution time of the standard type of
queries selected beforehand;
ij
t
is the average
execution time of
ij
q
. Then the normalization result
of
i
T
is formed as:
1
i
n
iijijij
j
Tp t
λ
=
=××
∑
(5)
3.4 Multiple Objective Optimization
Based on the information above, three objective
functions are formed as:
1
1
:min
N
cpu i mem i
i
obj price c price m
=
×+ ×
∑
(6)
2
111
:min min
i
n
NN
iijijij
iij
obj T p t
λ
===
=××
∑∑∑
(7)
3
1
:min{max{ }}
min{max{ }}
i
i
n
ij ij ij
j
obj T
pt
λ
=
=
××
∑
(8)
where price
cpu
is the leasing price of CPU, e.g.
0.02$/GHz·hour; price
mem
is the leasing price of
memory, e.g. 0.01$/GB·hour. Formula (6) aims at
minimizing the total expenses per leasing interval.
Formula (7) aims at minimizing the total execution
time of all the workloads, i.e., optimizing overall
performance. And formula (8) minimizes the
maximal execution time of different workloads,
aiming at balancing the performance of different
workloads. And the constraints of the problem are as
follows:
1
1
i
n
ij
j
p
=
=
∑
(9)
ij
ij q
t bound≤
(10)
1
N
cpu i mem i
i
price c price m budget
=
×+ × ≤
∑
(11)
Formula (9) ensures the percentage of each type
of queries in a workload adds up to 1. Formula (10)
ensures the execution time of each type of queries
against exceeding their respective bound, and
formula (11) ensures the total expenses against
exceeding the budget limit.
At last, we transform the multiple objective
optimization problem to a single objective
optimization problem using linear weighting method.
The new objective function is
3
0
1
:min
ii
i
obj w obj
=
×
∑
(12)
where w
i
,
13i
≤
≤
, are respectively the weights
of three original objective functions.
3.5 Algorithm
Then we design and implement a genetic algorithm
by C++ language to solve the problem. Primary
algorithm codes are as follows.
Input:
the number of generations: G
the size of population: P
the number of query types: Q
the number of workloads (VMs): N
the percentage of queries in each workload: p
ij
the performance model for queries: Rational2D
the normalization factor of execution time: λ
ij
the weight of each objective function: w
i
Output:
the resource configuration of each VM: c
i
, m
i
Function 1: Main function
Begin
Initialization;
foreach k from 1 to G do
Selection;
Crossover;
Mutation;
Evaluation;
End
Function 2 is used to initializing the population,
and the chromosomes consist of c
i
and m
i
randomly
generated.
Function 2: Initialization
Begin
foreach k from 1 to P do
foreach i from 1 to N do
Chrom
ki
=random CPU capacity;
foreach i from N+1 to 2N do
Chrom
ki
=random memory size;
Check constraints;
foreach i from 1 to 2N do
Chrom
0i
=Chrom
1i
;
ObjFunctions;
foreach j from 1 to 3 do
Obj
0j
=Obj
1j
;
End
FLEXIBLE CONTROL OF PERFORMANCE AND EXPENSES FOR DATABASE APPLICATIONS IN A CLOUD
ENVIRONMENT
205

Function 3 is used to compute the value of objective
functions so as to evaluate the fitness of
chromosomes.
Function 3: ObjFunctions
Begin
foreach k from 1 to P do
CPU=0; Memory=0;
foreach i from 1 to N do
x
i
=1/Chrom
ki
;CPU+=Chrom
ki
;
y
i
=1/Chrom
k(i+N)
;Memory+=Chrom
k(i+N)
;
Obj
k1
=price
cpu
*CPU +price
mem
*Memory;
Obj
k2
=0; Obj
k3
=0;
foreach i from 1 to N do
T
i
=0;
foreach j from 1 to Q do
if(p
ij
!=0)
t
ij
=Rational2D
j
(x
i
,y
i
);
T
i
=p
ij
*λ
ij
*t
ij
;
Obj
k2
+=T
i
;
if(T
i
>Obj
k3
) Obj
k3
=T
i
;
Obj
k0
=w
1
*Obj
k1
+w
2
*Obj
k2
+w
3
*Obj
k3
;
End
Function 4 aims at evaluating the fitness of
chromosomes after crossover and mutation.
Function 4: Evaluation
Begin
ObjFunctions;
foreach k from 1 to P do
n=0; obj
min
=Obj
n0
;
foreach j from k+1 to P do
if(obj
min
>Obj
j0
)
obj
min
=Obj
j0
;
n=j;
if(n!=0)
foreach i from 1 to 2N do
swap Chrom
ki
and Chrom
ni
;
foreach j from 1 to 3 do
swap Obj
kj
and Obj
nj
;
End
Since Selection, Crossover and Mutation are
familiar to traditional genetic algorithm, the codes of
them are not given here. The time complexity of the
algorithm is O(GPNQ). And the results of our
experiments show when P is set to 30 (an empirical
value for genetic algorithm), the algorithm can give
near-optimal configuration strategy with G reaching
two or three orders of magnitude; and when N and Q
are respectively less than 10 and 5, it takes less than
1 second to perform the algorithm.
4 EVALUATION EXPERIMENTS
In this section, we show some experimental results
obtained by running a few typical TPC-H queries in
a simulated IaaS cloud environment. These
experiments aim at evaluating the effectiveness of
the normalized performance model, the performance
improvement of the optimized configuration
strategies given by our approach, the compromise
between performance and expenses, the tradeoff of
workloads on different VMs, and the adaptability to
resource requirements of workloads.
4.1 Experimental Settings
Experimental Environment. We use two identical
computers to construct a simulated cloud
environment, each with one 2.5GHz Intel Xeon
Quad-Core processor and 5GB of memory.
XenServer is used for virtualization. XenServer is a
product based on Xen, a powerful open source
industry standard for virtualization. Amazon EC2 is
exactly based on Xen virtualization solution.
CentOS-5.4-x86_64 is used as the operation system
of VMs.
Charging Model. The absolute leasing prices of
CPU and memory won’t influence the evaluation,
but the ratio between them should be reasonable. In
our experiments, we determine their leasing price
with the ratio corresponding to their actual market
price ratio. We have investigated the market prices
of CPU and memory, and the price ratio is
approximately 2:1. In the following experiments, the
leasing prices of CPU and memory are respectively
set to 0.02$/GHz·hour and 0.01$/GB·hour.
Basic Metric for Performance Improvement.
Generally, execution time can reflect the
performance directly. Therefore, we use the
execution time of a workload to measure its
performance, and the total execution time of all the
workloads to measure the overall performance. Then
we define a default resources configuration strategy,
that is, to average the given budget for all VMs, and
for each instance, the memory size is 1.872 times as
CPU capacity. We obtain this default strategy from
the configuration of the standard VM instances from
Amazon EC2. Table 1 shows the CPU and memory
configuration of three standard VM instances from
Amazon EC2. We run a linear regression on the data
to get the default configuration ratio between CPU
and memory. Figure 3 shows the perfect regression
result with the R
2
value reaching 0.999. Then
formula (13) shows the basic evaluation equation.
CLOSER 2011 - International Conference on Cloud Computing and Services Science
206
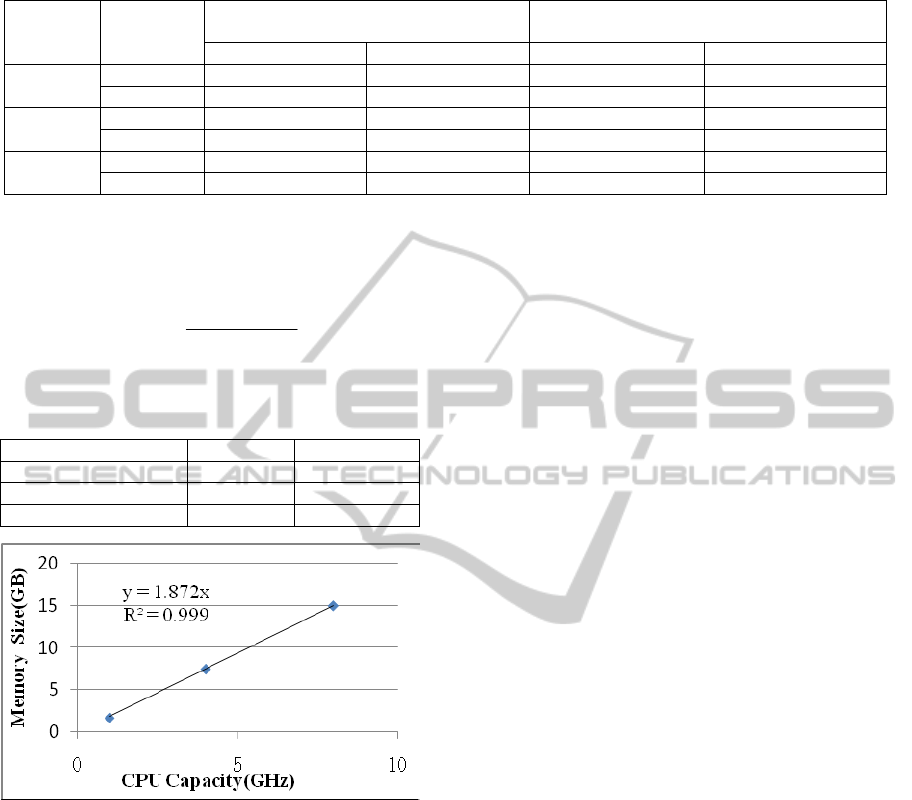
Table 2: The configuration strategies with and without execution time normalization.
Budget($) Workload
Strategy with execution time
normalization
Strategy without execution time normalization
CPU (GHz) Memory (GB) CPU (GHz) Memory (GB)
0.04
W
1
0.7 0.5 0.6 1.3
W
2
0.8 0.5 0.5 0.5
0.06
W
1
1.2 0.6 1.1 1.9
W
2
1.2 0.5 0.7 0.5
0.08
W
1
1.6 1.0 1.5 2.1
W
2
1.6 0.5 1.1 0.5
T
default
and T
optimal
are respectively the execution time
under default and optimized configuration.
default optimal
default
TT
improvement
T
−
=
(13)
Table 1: The CPU and memory configuration of three
standard VM instances from Amazon EC2.
Type of VM instances CPU (GHz) Memory (GB)
Small 1 1.7
Large 4 7.5
Extra large 8 15
Figure 3: The regression result for the CPU and memory
configuration of VM instances from Amazon EC2.
4.2 Verifying the Necessity and
Effectiveness of Execution Time
Normalization
Since the difference of the order of magnitude of the
execution time may lead to undesirable and even
wrong configuration strategy, we have brought in
the normalization factor to terminate this undesirable
influence. To verify the necessity and effectiveness
of normalization factor, we select three types of
TPC-H queries, Q11, Q21 and Q6 to conduct this
experiment. Q11 and Q21 are respectively CPU
intensive and memory intensive, and Q6 isn’t very
sensitive to CPU or memory. Besides, Q11 and Q6
have the same order of magnitude, and Q21 has
nearly two orders higher than them.
We start two VMs with two different workloads
respectively running on them. W
1
consists of Q11
and Q21 with 9:1 quantity ratio, and W
2
is composed
of Q11 and Q6 with 9:1 quantity ratio. So both
workloads are CPU intensive because Q11 plays a
dominant role in them, and the correct configuration
strategy is to give more CPU capacity to both VMs.
Table 2 shows the configuration strategies given
by two approaches with and without execution time
normalization under different budget constraints.
From the table, it can be seen that the strategy with
time normalization is correct, giving priority to CPU
configuration for both VMs. In contrast, the strategy
without time normalization, giving priority to
memory configuration for W
1
, doesn’t correspond to
the actual demand.
4.3 Evaluating the Basic Performance
of Our Approach
In this section, we focus on evaluating the
effectiveness of our approach to combination of
workloads with different natures. We use three
typical combinations of workloads to test the
improvement of overall performance.
Case1: The experiment in the previous section is a
typical case, for both workloads are CPU intensive.
Figure 4 shows the total execution time respectively
under default configuration strategy mentioned
above and optimized configuration strategy given by
our approach. It can be seen that the improvement is
significant, reaching 20% even up to 30%.
Case2: Then we design another typical case using
Q6, Q21 and Q13. Q6 and Q21 have been
introduced in the previous section, and Q13 is
almost an absolutely CPU-intensive query,
extremely insensitive to memory. Similar to the
previous experiment, we run two different
workloads on two VMs respectively. W
1
consists of
Q6 and Q21 with 1:9 quantity ratio, and W
2
is
FLEXIBLE CONTROL OF PERFORMANCE AND EXPENSES FOR DATABASE APPLICATIONS IN A CLOUD
ENVIRONMENT
207
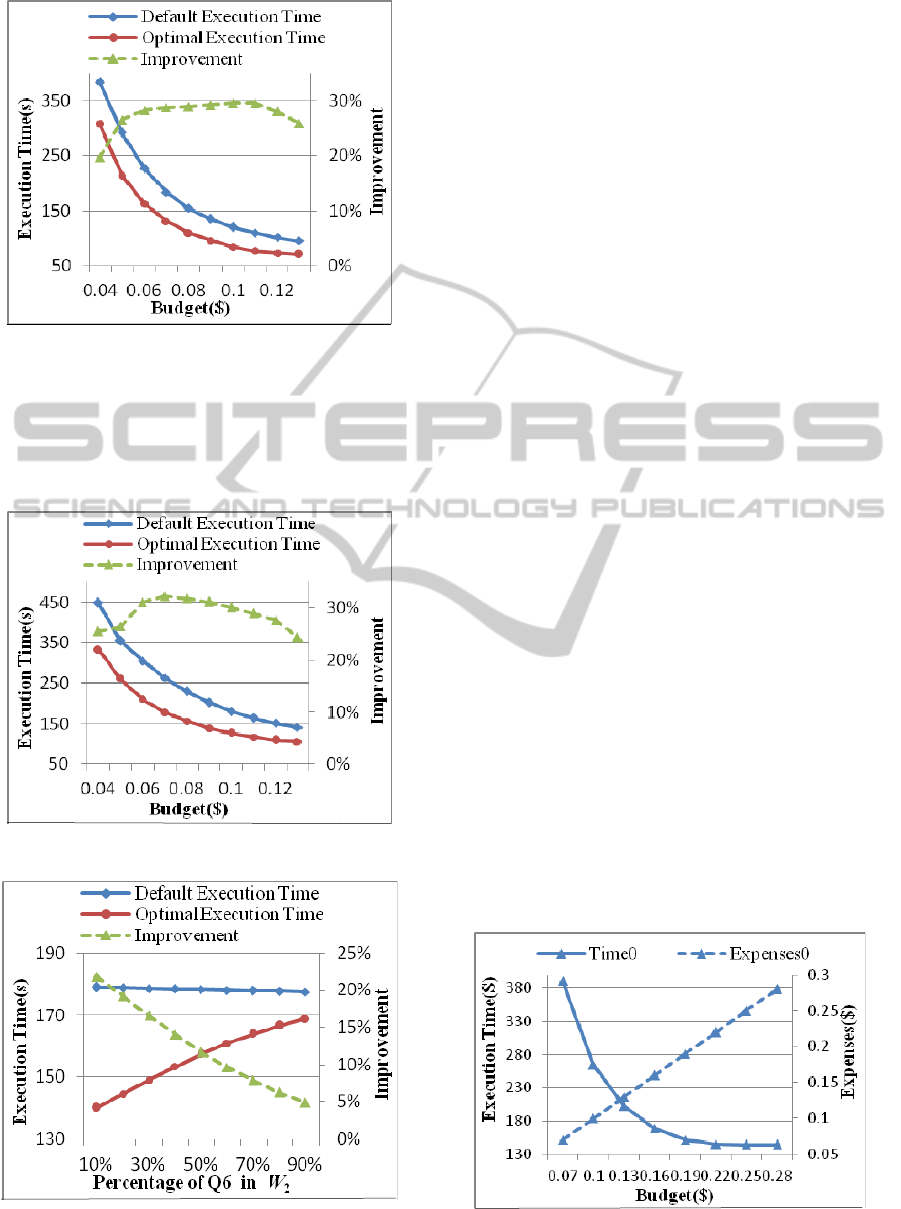
Figure 4: Optimization result for Case1.
composed of Q6 and Q13 with 1:9 quantity ratio. So
W
1
is typically memory intensive while W
2
is
typically CPU intensive. Figure 5 shows the result of
this experiment. It can be seen that the improvement
is satisfying, over 20% even exceeding 30%.
Figure 5: Optimization result for Case2.
Figure 6: Optimization result for Case3 with different
percentage of Q6 in
W
2.
Case3: Next, let’s look at the third typical case. We
just make some changes based on Case2, turning the
quantity ratio into 9:1 for W
1
, and : (10 )nn− for W
2
,
from
1n
=
to
9n
=
. As a result, W
1
isn’t very
sensitive to CPU or memory because Q6 becomes
the dominator, while W
2
’s sensitivity to CPU
decreases as
n
increases. Figure 6 shows the result
of this experiment. It can be seen that the
improvement drops significantly as the percentage
of Q6 in W
2
increases.
From these experiments, it can be concluded that
our approach can lead to significant performance
improvement when the combination of workloads is
sensitive to resources, or else the improvement isn’t
very apparent.
4.4 Verifying the Effectiveness of
Compromising Performance and
Expenses
Formula (12) in section 3 shows us the aggregating
objective function using linear weighting method,
and w
i
(
13i
≤
≤
), the weights of three original
objective functions, can be adjusted as needed. If the
customers only care about one aspect of them, they
just need to set the weights of other objective
functions to zero. In this experiment, we focus on
the expenses and the overall performance under
different budget constraints.
We start three VMs with three different
workloads respectively running on them. To verify
the applicability of our approach, all the workloads
consist of Q6, Q21 and Q13, three different types of
queries (c.f. section 5.2, 5.3) with random instead of
controlled quantity ratio. For comparison, firstly w
1
and w
3
in formula (12) are set to 0, and w
2
is set to 1.
In this case, the only objective is minimizing the
total execution time of the workloads, i.e. optimizing
the overall performance.
Figure 7: Execution time and expenses when ignoring
cost-performance ratio.
CLOSER 2011 - International Conference on Cloud Computing and Services Science
208
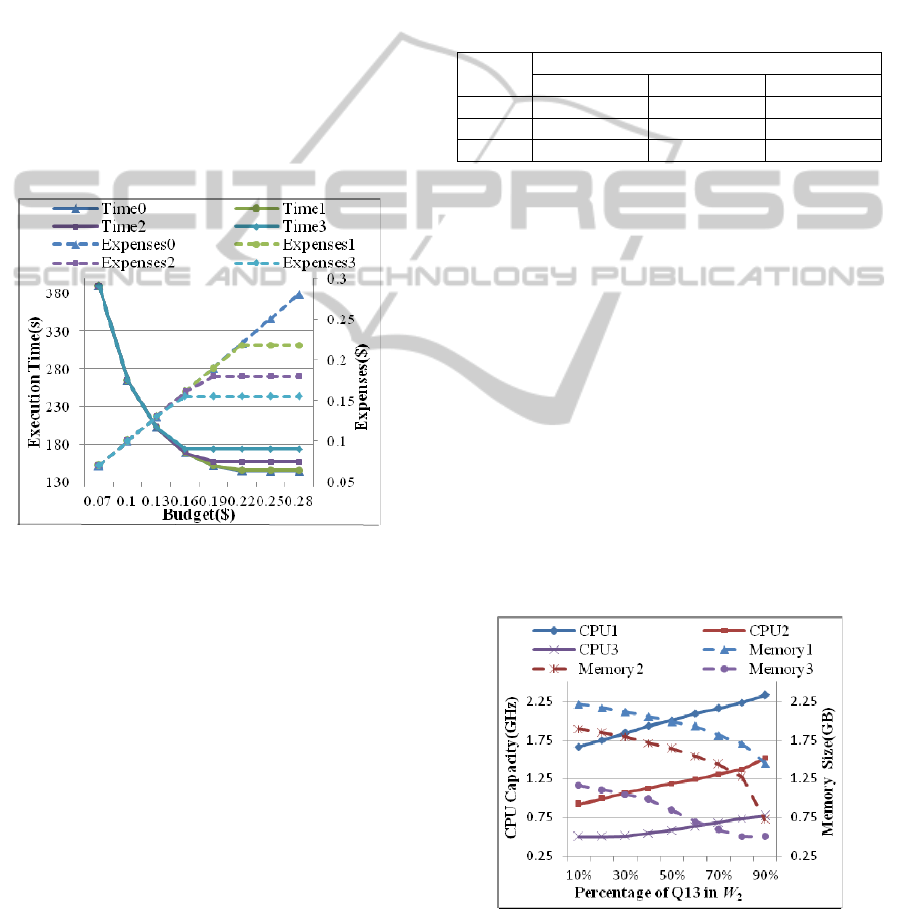
Figure 7 shows the expenses and total execution
time under different budget constraints, ignoring
cost-performance ratio. It can be seen that, when the
budget increases beyond a certain value, the total
execution time decreases very slowly, but the
expenses increase as usual. This is because when
resources reach a certain level, the performance
nearly reaches saturation point. Under this
circumstance, single objective optimization can’t
give a fine configuration strategy. It’s necessary to
adjust the ratio between the weights of objective
functions to obtain more reasonable strategies.
Figure 8 shows some new results by adjusting w
1
and w
2
, and the tradeoff between performance and
expenses is significant. Especially when the budget
is relatively higher, our approach can save the
expenses significantly, with little drop of
performance.
Figure 8: Execution time and expenses when considering
cost-performance ratio. Time1-3 are three execution time
curves under different ratios between
w
1
and w
2
, and
Expenses1-3 are corresponding expenses curves.
4.5 Verifying the Effectiveness of
Balancing the Performance of
Different Workloads
In the previous experiment, the tradeoff between
performance and expenses can be achieved by
adjusting the ratio between w
1
and w
2
. Analogously,
if the customers hope to balance the performance of
different workloads, they just need to increase the
value of w
3
, i.e. the weight of the third objective
function.
We start two VMs with two different workloads
respectively running on them. W
1
consists of Q21
and Q13 with 1:9 quantity ratio, while W
2
is
composed of Q21 and Q13 with 9:1 quantity ratio.
So W
1
is typically CPU intensive while W
2
is
typically memory intensive.
Table 3 shows the experimental results with
different ratios between w
2
and w
3
. From the table it
can be seen that, as the value of w
3
:w
2
increases, the
performance tradeoff between the two workloads
become more significant. At the same time, the
impact on the overall performance is limited,
because the increase of total execution time is not
apparent.
Table 3: Performance tradeoff of workloads under
different ratios between
w
3
and w
2
.
w
3
:w
2
Execution time with normalization
W
1
W
2
Total
0:1 60.05 29.55 89.60
1:1 53.12 39.36 92.48
9:1 49.30 49.29 98.59
4.6 Verifying the Adaptability to
Resource Requirements of
Workloads
The purpose of this experiment is to verify the
adaptability of our approach to resource
requirements of workloads. Q13 and Q21 are
selected to design this experiment, which are
respectively CPU intensive and memory intensive.
We run two workloads on two VMs. As the control
group, W
1
is composed of Q13 and Q21 with fixed
quantity ratio, 5:5. W
2
is composed of Q13 and Q21
with varying quantity ratio
:(10 )nn
−
, from
1n
=
to
9n
=
. Therefore, as n increases from 1 to 9, W
2
changes from a memory-intensive workload to a
CPU-intensive workload, and the correct
configuration strategy is to give it more CPU and
less memory.
Figure 9: CPU and memory configuration strategies for W
2
corresponding to different percentage of Q13 in
W
2
.
CPU1-3 are three CPU configuration curves under low,
middle and high budget constraints, and Memory1-3 are
corresponding Memory configuration curves.
FLEXIBLE CONTROL OF PERFORMANCE AND EXPENSES FOR DATABASE APPLICATIONS IN A CLOUD
ENVIRONMENT
209

Figure 9 shows the configuration strategies for
W
2
given by our approach under low, middle and
high budget constraints. From this figure we can see
that our approach is adaptive enough to resource
requirements of workloads.
5 CONCLUSIONS
In this paper, we propose an approach for flexible
control of performance and expenses in IaaS cloud
environments with different requirements of
customers. We focus on the workloads with mixed
types of queries in database applications. Based on a
fine-grained charging model and a normalized
performance model, we build a model of multiple
objective optimization, which covers different
aspects cloud customers care about, such as
expenses, performance, the compromise between
performance and expenses, the performance tradeoff
of applications on different VMs, etc. Under this
model, these complicated problems are turned into
an optimization problem, which can be addressed by
a genetic algorithm we have implemented. And from
the results of some experiments, it can be seen that
the effectiveness of our approach is significant.
There is also some work to do in the future, such
as building a more comprehensive charging model
considering I/O performance and network bandwidth,
and exploring more delicate performance model
considering database concurrency control.
ACKNOWLEDGEMENTS
The work is funded by National Natural Science
Foundation of China (61073004) and Chinese Major
State Basic Research Development 973 Program
(2011CB302200).
REFERENCES
TPC-H. Retrieved October 26, 2010, from
http://www.tpc.org/tpch/default.asp
Amazon EC2 Instance Types. Retrieved October 29, 2010,
from http://aws.amazon.com/ec2/instance-types
OriginLab: data analysis and graphing software.
Retrieved November 3, 2010, from
http://www.originlab.com/
XenServer. Retrieved November 5, 2010, from
http://www.citrix.com/English/ps2/products/product.as
p?contentID=683148&ntref=prod_top
Bu, X., J. Rao and C. Z. Xu. 2010. CoTuner: a framework
for coordinated auto-configuration of virtualized
resources and appliances. In
Proceeding of the 7th
international conference on Autonomic computing
.
ACM.
Florescu, D. and D. Kossmann. 2009. Rethinking cost and
performance of database systems.
ACM SIGMOD
Record
38(1):43-48.
Henzinger, T. A., A. V. Singh, V. Singh, T. Wies and D.
Zufferey. 2010. FlexPRICE: Flexible Provisioning of
Resources in a Cloud Environment. In
2010 IEEE 3rd
International Conference on Cloud Computing
. IEEE.
Kusic, D., J. O. Kephart, J. E. Hanson, N. Kandasamy and
G. Jiang. 2009. Power and performance management
of virtualized computing environments via lookahead
control.
Cluster Computing 12(1):1-15.
More, J. 1978. The Levenberg-Marquardt algorithm:
implementation and theory. Numerical analysis:105-
116.
Padala, P., K. Y. Hou, K. G. Shin, X. Zhu, M. Uysal, Z.
Wang, S. Singhal and A. Merchant. 2009. Automated
control of multiple virtualized resources. In
Proceedings of the 4th ACM European conference on
Computer systems
. ACM.
Rao, J., X. Bu, C. Z. Xu, L. Wang and G. Yin. 2009.
VCONF: a reinforcement learning approach to virtual
machines auto-configuration. In
Proceedings of the
6th international conference on Autonomic computing
.
ACM.
Rogers, J., O. Papaemmanouil and U. Cetintemel. 2010. A
generic auto-provisioning framework for cloud
databases. In 2010 IEEE 26th International
Conference on Data Engineering Workshops
(ICDEW)
. IEEE.
Shivam, P., A. Demberel, P. Gunda, D. Irwin, L. Grit, A.
Yumerefendi, S. Babu and J. Chase. 2007. Automated
and on-demand provisioning of virtual machines for
database applications. In Proceedings of the 2007
ACM SIGMOD international conference on
Management of data
. ACM.
Somani, G. and S. Chaudhary. 2009. Application
Performance Isolation in Virtualization. In
2009 IEEE
International Conference on Cloud Computing
. IEEE.
Soror, A. A., U. F. Minhas, A. Aboulnaga, K. Salem, P.
Kokosielis and S. Kamath. 2008. Automatic virtual
machine configuration for database workloads. In
Proceedings of the 2008 ACM SIGMOD international
conference on Management of data
. ACM.
Urgaonkar, R., U. C. Kozat, K. Igarashi and M. J. Neely.
2010. Dynamic resource allocation and power
management in virtualized data centers. In
Network
Operations and Management Symposium (NOMS)
.
IEEE.
Wang, X. and Y. Wang. 2009. Co-con: Coordinated
control of power and application performance for
virtualized server clusters. In 17th International
Workshop on Quality of Service
. IEEE.
Xiong, P., Z. Wang, G. Jung and C. Pu. 2010. Study on
performance management and application behavior in
virtualized environment. In
Network Operations and
Management Symposium (NOMS)
. IEEE.
CLOSER 2011 - International Conference on Cloud Computing and Services Science
210
