
PROCESSING WIKIPEDIA DUMPS
A Case-study Comparing the XGrid and MapReduce Approaches
Dominique Thi´ebaut, Yang Li, Diana Jaunzeikare, Alexandra Cheng, Ellysha Raelen Recto
Gillian Riggs, Xia Ting Zhao, Tonje Stolpestad and Cam Le T. Nguyen
Dept. Computer Science, Smith College, Northampton, MA, U.S.A.
Keywords:
Grid computing, XGrid, Hadoop, Wikipedia, Data mining, Performance.
Abstract:
We present a simple comparison of the performance of three different cluster platforms: Apple’s XGrid, and
Hadoop the open-source version of Google’s MapReduce as the total execution time taken by each to parse
a 27-GByte XML dump of the English Wikipedia. A local hadoop cluster of Linux workstation, as well as
an Elastic MapReduce cluster rented from Amazon are used. We show that for this specific workload, XGrid
yields the fastest execution time, with the local Hadoop cluster a close second. The overhead of fetching
data from Amazon’s Simple Storage System (S3), along with the inability to skip the reduce, sort, and merge
phases on Amazon penalizes this platform targeted for much larger data sets.
1 INTRODUCTION
The aim of this paper is to find the fastest parallel
computer cluster available at Smith College for pro-
cessing Wikipedia dumps and for generating word
statistics. We implement the parsing of the XML
dump of the English wikipedia, and the gathering of
word usage on an Apple XGrid system, and on two
Hadoop clusters, one local, the other hosted on Ama-
zon, and we report on the performance obtained from
the different systems. We also compare these three
clusters to a multi-core multi-threaded, single com-
puter system.
Apple’s XGrid (Hughes, 2006) offers a low-cost,
easy, versatile, and powerful infrastructure for exe-
cuting data-parallel programs on tens, or hundreds of
Mac computers, and is used mostly in academia and
for scientific computing, less so in commercial appli-
cations. Hadoop (White, 2009) runs mostly on Linux
machines, but can also run on other platforms. It sup-
ports data-intensive distributed applications running
on thousands of nodes processing petabytes of data,
and has a strong presence in the commercial world,
with Yahoo! its main contributor (Baldeschwieler,
2008).
While the XGrid is a natural choice for parsing the
30 GBytes of a dump of the English wikipedia, in this
paper we investigate whether hadoop is a contender,
and under which conditions the execution time of the
parsing process is comparable on both frameworks.
When low-cost, powerful, and easily accessible
parallel computational platforms are available, it is
important to better understand their source of perfor-
mance and pick the best one for a solving a given
problem.
Our results show that the XGrid is the fastest plat-
form for our needs, with the local Hadoop cluster a
close second. The size of our data set is too low, and
our computation too simple to offset Amazon’s high
storage access overhead. However, Amazon can still
provide acceptable support in its multicore single-
machine options, and we provide, as an anecdotal data
point the result of running our workload on a sin-
gle 26-core Amazon AMI instance running a multi-
threaded version of our code.
We review the litterature in the next section. We
then set the conditions of our experiments in precise
terms. We report the XGrid performance results in
Section 4, and Hadoop in Section 5. Our analysis is
presented in Section 6. Section 7 concludes this re-
port.
2 BACKGROUND
The individual performance of the XGrid and Hadoop
systems under various loads and conditions have been
reported extensively, but few reports compare them
to other systems or to each other. Different stud-
ies offer comparison of grids using different metrics,
391
Thiébaut D., Li Y., Jaunzeikare D., Cheng A., Raelen Recto E., Riggs G., Ting Zhao X., Stolpestad T. and Le T. Nguyen C..
PROCESSING WIKIPEDIA DUMPS - A Case-study Comparing the XGrid and MapReduce Approaches.
DOI: 10.5220/0003385603910396
In Proceedings of the 1st International Conference on Cloud Computing and Services Science (CLOSER-2011), pages 391-396
ISBN: 978-989-8425-52-2
Copyright
c
2011 SCITEPRESS (Science and Technology Publications, Lda.)

such as evaluating the scheduling policy only (Kokaly
et al., 2009). Because Hadoop follows the approach
of Google’s MapReduce, it is well suited to process
large data sets in text format, and its performance and
tuning for sorting large text files has been carefully
studied (O’Malley and Murthy, 2009).
There are few published comparisons of
Hadoop/MapReduce against other computing
solutions, and the study by Pavlo et al. (Pavlo et al.,
2009) along with a rebutal by Google’s Dean and
Ghemawat (Dean and Ghemawat, 2010) stand out.
Pavlo et al. compare the MapReduce paradigm to
parallel and distributed SQL database management
systems (DBMS), and herald the superiority of
DBMS but recognize the superiority of Hadoop
for its fault tolerance and ease of installation. The
rebutal published in CACM is an indication that
the fair comparison of different approaches to solve
identical parallel problems is nontrivial, and that the
assumptions made can greatly influence the results.
Iosup and Epema (Iosup and Epema, 2006) pro-
pose the creation and use of synthetic benchmarks
to rate the performance of grids, and evaluate their
methodology on one system only, which unfortu-
nately uses neither XGrid nor Hadoop.
While the work in (Raicu et al., 2006) is a very
comprehensive framework for measuring the perfor-
mance of various grids, it includes world-wide net-
work of research computers, or centralized Linux net-
works but not Hadoop or XGrid clusters.
The evaluation of MapReduce on multicore sys-
tems presented by Ranger (Ranger et al., 2007) is
worth mentioning, and although it does not compare
Hadoop’s performance to that of other grids, it points
to multicores as a competitor to clusters in some ar-
eas, and we present data supporting this argument.
It is a challenging task to provide a fair compar-
ison of the computational power of systems that op-
erate at different clock speeds, with different mem-
ory support, using different file systems, and with dif-
ferent network bandwidth. None the less, we feel
that our attempt to find the fastest solution for our
wikipedia processing problem is worth reporting, and
we hope our results will help others pick the best clus-
ter for their need.
3 PROBLEM STATEMENT
Our goals are simple: find among the available plat-
forms the parallel approach that provides the fastest
parsing of the entire contents of a dump of the En-
glish Wikipedia, where word-frequency statistics is
gathered for all pages.
Figure 1: Main block diagram of the processing of the XML
dump.
The process, illustrated in Figure 1, is the fol-
lowing: The data dump (pages-articles, collected
10/17/2009) is first retrieved from Mediawiki (Medi-
aWiki, 2002), and then parsed by a serial C++ pro-
gram, divide, that formats 9.3 million XML entries
into 431 XML files, each containing as many whole
entries as can fit in 64 Mbytes. We refer to these 431
files as splits, according to the hadoop syntax. Each
individual entry in a split represents a wikipedia page
and is formatted as a single line of text, making it di-
rectly compatible to the Hadoop data input format.
The 431 splits are then processed in parallel (paral-
lel parse), stop words are removed, and word statis-
tics are computed and stored in N (output files). N
varies depending on the platform and configuration
used. The storing of these files into database is not
reported in this comparison. Only the parallel parse
module is the subject of our comparative study. We
pick four different frameworks that are easily accessi-
ble on and off campus: a local XGrid cluster of iMacs
(in computer labs and classrooms) a local cluster of
Fedora-workstation running Hadoop, and Amazon’s
Elastic MapReduce framework (Amazon, 2002), both
as a cluster and as a multicore single instance. The
input and output files may reside in different storage
systems which we select to make the parallel com-
putation of Wikipedia an easily interchangeable stage
of a larger computational pipeline. For this reason,
we include setup, upload and download times of in-
put and output files in our comparison data.
The target execution time to beat is 15 hours 34
minutes and 28 seconds (56,068 seconds) for the se-
rial execution of parallel parse on one of the 2-
core iMac workstations used as standard agent in our
XGrid, with all files (executable, input and output)
stored on the iMacs local disk. This execution in-
volves only one core, due to the lack of multitasking
of the C++ program.
In the next section we present the XGrid infras-
tructure and the performance measured on this net-
work.
CLOSER 2011 - International Conference on Cloud Computing and Services Science
392

Table 1: XGrid Execution Times as a function of Proces-
sors.
Processors Exec. Times (min sec)
25 45 m 11 s
32 41 m 3 s
34 35 m 2 s
41 36 m 0 s
4 XGrid SETUP
4.1 Hardware Setup
The XGrid is a collection of iMac workstations lo-
cated on the same 1-gigabit LAN in the department
of computer science at Smith College. The XGrid
controller is an 2.8 GHz 8-core MacPro3.1, with 10
GB Ram. The agents are 3.06 GHz Intel 2-core duos
iMacs, with a maximum of 42 processors available in
the grid. The number of processors enrolled in the
grid may be less depending on different network/user
conditions, but all experiments reported were per-
formed on a stable and constant number of proces-
sors, although the number of processors may change
from one experiment to another.
4.2 Workload Setup
We use a C++ program to process each of the 431 in-
put files. The program uses Nokia’s Qt library (Nokia,
2005) for its efficient and versatile string and XML
processing capabilities. To reduce the size of the
batch job, the input files are downloaded by the XGrid
agents from a Web server, and the output files are up-
loaded back to the same server. Our measurements
show that the upload to the Web server is less than
1% longer in relative execution time compared to re-
lying on XGrid to handle the upload and download
itself.
4.3 Execution Times
Table 1 presents the average execution times observed
when processing the 431 input files on the XGrid.
The best speedup observed is 26.6 for 34 cores, cor-
responding to the fastest execution time of 2,102 sec-
onds, or 35 min 2 sec. The different node configura-
tions illustrate the variation in node availability typi-
cal of workstations located in public lab spaces.
5 HADOOP ON LOCAL CLUSTER
Two different Hadoop platforms are used for this test.
The first one is a local cluster of 10 Fedora 2 GHz,
quad-core Intel Linux workstations with 8 GB Ram,
on a 1-gigabit LAN.
5.1 Experiment Setup
The same C++ program used on the XGrid is mod-
ified to become the map task of Cloudera’s patched
Hadoop 0.18 distribution (Cloudera, 2009). We do
not use a reduce task, which has the advantage of
forcing Hadoop to automatically upload the local re-
sult files generated by the map tasks to distributed file
storage. They form the result files of our computa-
tion. The C++ executable is run in streaming mode.
The ten quad-core CPUs form a set of 40 processors to
run the Map and Reduce tasks, comparable in number
of cores to the XGrid cluster, with an aggregated pro-
cessing power of 80 GHz for Hadoop, versus 125.5
GHz for the XGrid cluster. The 1 gigabit LAN linking
the Fedora workstations is the same network linking
the iMacs of the XGrid cluster. Each cluster resides in
a lab of its own, in the same building. The number of
map tasks running concurrently is set to 4, as it yields
the fastest observed execution time.
5.2 Performance
The execution times for setting up, executing, and
downloading the results of the MapReduce program
are presented in Table 2, and the total time is 1,400
seconds, or 23 min 20 sec. T0 represents the time
taken to upload the input splits to HDFS. This is a
required condition for MapReduce applications. This
step involves creating 2 copies (replication factor =
2) of the same split on the distributed (local) disks of
cluster workstations. T1 represents the execution of
the MapReduce program, including replication of the
binaries to the compute nodes, execution, and storage
of the resulting files in HDFS. T2 is the time taken to
download the files from HDFS to the local disk of a
workstation on the same subnet. T3 is the sum of T1
and T2. T4 represents the time taken if the output files
are downloaded from HDFS as soon as they are cre-
ated, in essence overlapping execution and I/O. While
T4 is slightly lower than T3, we elect to use T3 as the
representative quantity, which will make our compar-
ison easier in Figures 2 and 3 below.
PROCESSING WIKIPEDIA DUMPS - A Case-study Comparing the XGrid and MapReduce Approaches
393
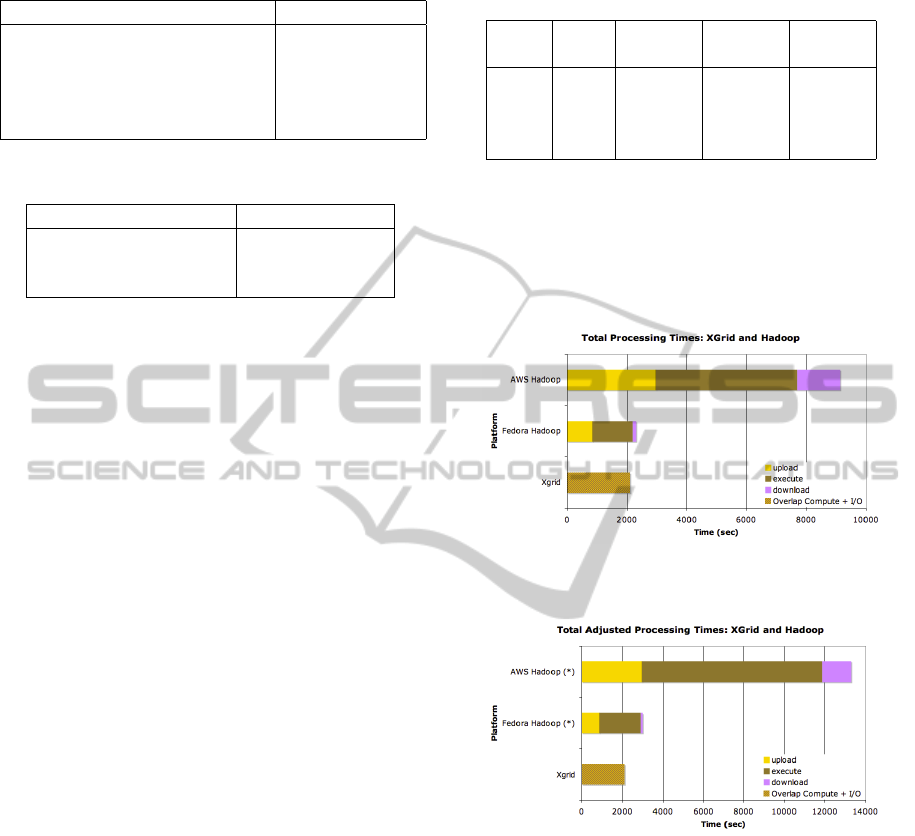
Table 2: Execution times on local Hadoop Fedora cluster.
Operation Execution Times
T0: Upload to HDFS 14 m 0 s
T1: Computation only 22 m 37 s
T2: Download from HDFS 1 m 53 s
T3: Computation + I/O (T1+T2) 24 m 30 s
T4: Computation and Download 23 m 20 s
Table 3: Execution times on Amazon Web Services.
Operation Execution Times
T0: Upload splits to S3 49 m 17 s
T1: Computation only 1 hr 19 m 0 s
T2: Download from S3 16 m 0 s
6 HADOOP ON AMAZON
The second Hadoop setup is the AWS platform of-
fered by Amazon (Amazon, 2002). Because the Ama-
zon platform does not allow for reduce-free MapRe-
duce programs, we use an identity Reduce function.
Note that because the reduce step must be used, the
sorting and merging of the output records are auto-
matically performed by Hadoop, a time consuming
step we avoided with the local cluster. Before the
computation, the 431 splits are uploaded to S3 stor-
age using Smith College’s high speed network con-
nection. Then 10 m1-large instances are harnessed
into an Elastic MapReduce cluster of 10 nodes, or 40
cores. The resulting files are then downloaded from
S3 to a local disk. The 10-node cluster contains 40
cores, and is the closest match to the XGrid and local
Hadoop setups.
6.1 Performance Measurements
The average times observed for the upload, execution,
and download operations on the 431 splits on the 10-
node Elastic MapReduce cluster are presented in Ta-
ble 3. Note that we use the ability of Hadoop to au-
tomatically read compressed data files as well as gen-
erate compressed output files, so as to minimize the
upload and download times.
We also measure the execution times of our
Hadoop program on 5, 10, and 15-node clusters, and
record the execution times in Table 4. The table in-
cludes the number of instance hours, which is the
number of instances used per hour of computation, the
quantity used by Amazon for billing users. We note
that even with twice the number of cores as the lo-
cal Hadoop cluster, the computation on 80 core takes
3,660 seconds, close to three times the 1,357 sec-
Table 4: Measured Execution times as a function of cluster
size on Amazon Web Services.
Nodes Cores Exec.
Times
Instance
Hours
Effi-
ciency
5 20 2 h 12 m 60 0.19
10 40 1 h 19 m 80 0.16
15 60 1 h 6 m 120 0.12
20 80 1 h 1 m 160 0.10
onds it takes on the 40-core local cluster. We fur-
ther note that the 5-node, 20-core AWS cluster is the
most efficient of the four sizes considered, with an effi-
ciency (speedup/number of cores) of 0.19, as opposed
to 0.16, 0.12, and 0.10 for the other configurations.
Figure 2: Execution times on the three platforms, XGrid,
Fedora Hadoop and AWS Hadoop.
Figure 3: Adjusted execution times for XGrid, Fedora
Hadoop, and AWS Hadoop.
7 MULTI-THREADED
MULTI-CORE ALTERNATIVE
One shouldn’t underestimate the power of the vari-
ety EC2 instances available. As an experiment we
wrapped our C++ executable into a multi-threaded
Python shell and ran it on Amazon’s largest instance
at the time of this experiment, a 26-core, 68.4 GB
m2.4x-large instance, and recorded its executiontime.
The transfer of data to and from the Smith Web server
and the threaded computation takes only three times
longer that the same operations on the local Hadoop
CLOSER 2011 - International Conference on Cloud Computing and Services Science
394
cluster with almost twice as many cores (40). The to-
tal execution time of 1 hour 14 minutes, which is a vi-
able option for our purpose, and in line with Ranger’s
observation (Ranger et al., 2007) who obtains similar
performance for MapReduce programs on multicores
with shared memory as with P-Threads.
8 COMPARATIVE ANALYSIS
8.1 One-core Normalization
Because the platforms all use different hardware,
we normalize our measured times by recording the
speed of the three clusters relative to each other when
processing all 431 splits on a single core of each
platform. In all three cases, the input and output
files are retrieved from and stored back on the same
Web Server. The m1-large EC2 instance on Ama-
zon performs the fastest, 1.88 times faster than the
XGrid processor, and 1.23 times faster than the Fe-
dora Hadoop core.
8.2 Cluster Comparison
Figure 2 shows the time taken to transfer 431 input
files to the selected platform, process them in paral-
lel, and get the resulting files back. These times are
nicely separated for the Hadoop platforms, but be-
cause the XGrid platform allows individual nodes to
download, process, and upload back to the server in
parallel with other nodes, the three different actions
are merged into one solid block.
The first observation is that the XGrid performs
faster than the other two platforms. The second obser-
vation is that the local Hadoop cluster performs much
faster than the AWS cluster. This can be attributed
primarily to the overhead of the S3 storage, as well as
the sort and merge phase that follow the reduce step in
the AWS case. Remember that while we could imple-
ment a reduce-less MapReduce program on the local
Hadoop cluster, Amazon does not allow for it. As a
result, 40 of the the fastest cores used in this study
take the longest processing time.
We see that for the computation only, the local
Fedora Hadoop infrastructure is more efficient, with
XGrid a close second. However, because download
and upload are integrated in the measured execution
time, XGrid performs actually better than reported.
To reduce the disparity in the architectures and
provide a more meaningful comparison, we show in
Figure 3 the same data as in Figure 2, but we normal-
ize the execution times on the hadoop platforms by
Table 5: Multithreaded Execution on a 26-core m1-large
AWS EC2 Instance.
Step Operation Execution
Time (hms)
T0 Download from Web
Server to EC2 Instance
28 m
T1 Unzip Split and Compu-
tation
36 m 22 s
T2 Upload to Web Server 9 m 40 s
T3 Total (T0+T1+T2) 1 h 14 m 2 s
the factors reported in the One-Core Processing sec-
tion above, i.e. 1.52 for the local hadoop, and 1.88 for
the AWS hadoop. In effect we simulate the hadoop
platforms on XGrid cores. Here again we observe the
fastest execution on the XGrid, with the local Hadoop
close to 1.5 times slower, and the AWS hadoop more
than 6 times slower.
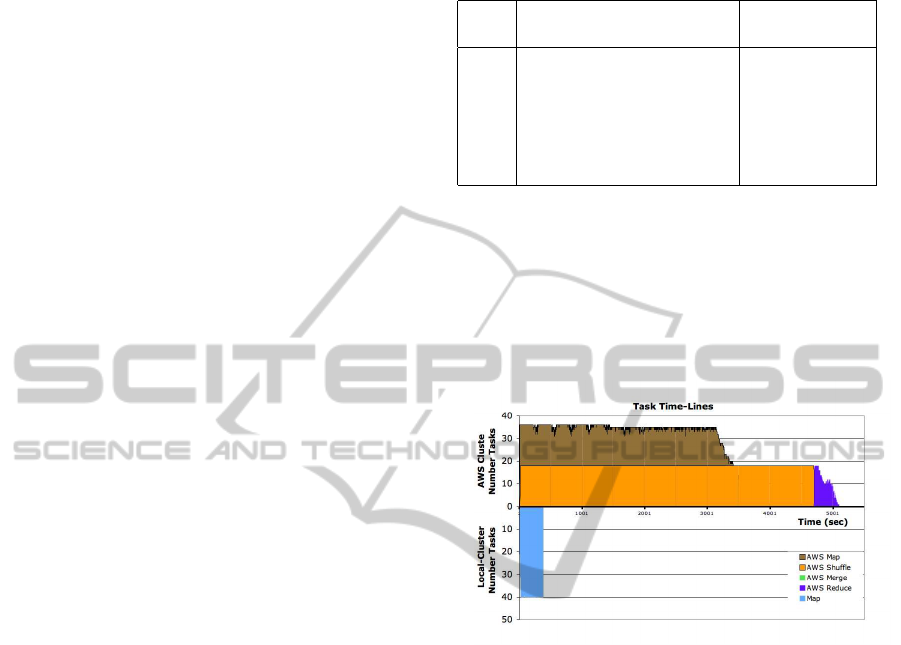
Figure 4: Time-Lines of the map-reduce-shuffle tasks on
AWS (positive axis) and the map-only tasks on the local
Hadoop cluster.
The lower performance of Amazon’s Elastic
MapReduce is due to several factors. First, it is ill-
suited for the small-scale problem we have applied
it to. Second, it fetches its data from S3 which is
a wide-area attached storage, as compared to the lo-
cally stored data of the local Hadoop cluster. Finally
AWS forces the use of a reduce phase, which forces
us to pay for the sorting and shuffle phases. Figure
4 which shows the time-lines for the Map-Reduce-
Shuffle computation on Amazon, and the Map-only
computation on the local hadoop cluster illustrates
this difference in performance.
9 CONCLUSIONS
Our efforts provide one data-point in the comparison
of the three cluster platforms, and not a comprehen-
sive comparison or evaluation of the different parame-
ters influencing the execution times. Such a study, in-
PROCESSING WIKIPEDIA DUMPS - A Case-study Comparing the XGrid and MapReduce Approaches
395

cluding the tuning of various parameters, such as the
size of the input splits, the number of reduce tasks, the
C++ library used is left for future work.
XGrid is found to providethe fastest time for gath-
ering the input data, processing them, and storing the
result back in a place where it can easily be reached
for the next step of the process. The Local Hadoop
cluster, with its distributed file system spread over the
local disks of the ten workstations performs almost as
well. AWS performs the worse, but one should re-
member that this commodity-computing solution has
great appeals, in particular that of requiring no physi-
cal or manpower infrastructure. The 2010 cost of per-
forming the processing of Wikipedia on all of the dif-
ferent clusters (5, 10, 15, and 20 nodes) was less than
US-$60. we strongly suspect that the 27 GB size of
the input data is simply too small to make this plat-
form shine, and that its true power is best expressed
on much larger data sets.
ACKNOWLEDGEMENTS
This work was supported in part by NSF Grant DMS-
0721661. We are also happy to acknowledge Kurt
Messersmith of Amazon.com for the grant of free
compute time on Amazon Web Services. This time
was used primarily in the class CSC352, Introduction
to Distributed and Parallel Processing, and for this re-
search.
REFERENCES
Amazon (2002). Amazon web services.
http://aws.amazon.com/.
Baldeschwieler, E. (2008). Yahoo! launches
world’s largest hadoop production application.
http://developer.yahoo.net/blogs/hadoop/2008/02/
yahoo-worlds-largest-production-hadoop.html.
Cloudera (2009). Cloudera. http://cloudera.com/.
Dean, J. and Ghemawat, S. (2010). MapReduce: A flexible
data processing tool. Communications of the ACM,
53(1):72–77.
Hughes, B. (2006). Building computational grids with ap-
ple’s xgrid middleware. In Buyya, R. and Ma, T., ed-
itors, Fourth Australasian Symposium on Grid Com-
puting and e-Research (AusGrid 2006), volume 54 of
CRPIT, pages 47–54, Hobart, Australia. ACS.
Iosup, A. and Epema, D. (2006). Grenchmark: A frame-
work for analyzing, testing, and comparing grids. In
CCGRID ’06: Proceedings of the Sixth IEEE Inter-
national Symposium on Cluster Computing and the
Grid, pages 313–320, Washington, DC, USA. IEEE
Computer Society.
Kokaly, M., Al-Azzoni, I., and Down, D. G. (2009). Mgst:
A framework for performance evaluation of desktop
grids. Parallel and Distributed Processing Sympo-
sium, International, 0:1–8.
MediaWiki (2002). Mediawiki foundation.
http://www.mediawiki.com/.
Nokia (2005). Nokia Qt cross-platform application and UI
framework library. http://qt.nokia.com/.
O’Malley, O. and Murthy, A. (2009). Hadoop sorts a
petabyte in 16.25 hours and a terabyte in 62 seconds.
http://developer.yahoo.net/blogs/hadoop/2009/05/
hadoop sorts a petabyte in 162.html.
Pavlo, A., Paulson, E., Rasin, A., Abadi, D. J., DeWitt,
D. J., Madden, S., and Stonebraker, M. (2009). A
comparison of approaches to large-scale data analysis.
In SIGMOD Conference, pages 165–178.
Raicu, I., Dumitrescu, C., Ripeanu, M., and Foster, I.
(2006). The design, performance, and use of diperf:
An automated distributed performance testing frame-
work. In the Journal of Grid Computing, Special Issue
on Global and Peer-to-Peer Computing.
Ranger, C., Raghuraman, R., Penmetsa, A., Bradski, G.,
and Kozyrakis, C. (2007). Evaluating mapreduce for
multi-core and multiprocessor systems. In HPCA
’07: Proceedings of the 2007 IEEE 13th International
Symposium on High Performance Computer Archi-
tecture, pages 13–24, Washington, DC, USA. IEEE
Computer Society.
White, T. (2009). Hadoop: The Definitive Guide. O’Reilly,
first edition.
CLOSER 2011 - International Conference on Cloud Computing and Services Science
396
