
SLA-BASED PLANNING FOR MULTI-DOMAIN INFRASTRUCTURE
AS A SERVICE
Kuan Lu, Thomas R
¨
oblitz
Information Technology and Media Center (ITMC), Dortmund University of Technology, Dortmund, Germany
Peter Chronz, Constantinos Kotsokalis
Information Technology and Media Center (ITMC), Dortmund University of Technology, Dortmund, Germany
Keywords:
Service level agreements, Infrastructure as a service, Optimization, Greedy algorithm, Outsourcing, Pricing.
Abstract:
This paper discusses the problem of planning resource outsourcing and local configurations for infrastructure
services that are subject to Service Level Agreements. The objective of our approach is to minimize implemen-
tation and outsourcing costs for reasons of competitiveness, while respecting business policies for profit and
risk. We implement a greedy algorithm for outsourcing, using cost and subcontractor reputation as selection
criteria; and local resource configurations as a constraint satisfaction problem for acceptable profit and failure
risks. Thus, it becomes possible to provide educated price quotes to customers and establish safe electronic
contracts automatically. Discarding either local resource provisioning, or outsourcing, models efficiently the
specialized cases of infrastructure resellers and isolated infrastructure providers respectively.
1 INTRODUCTION
Recent years have seen the uprise of utility comput-
ing, the usage model where customers rent infrastruc-
ture on demand under pay-as-you-go charging. The
advantages of this paradigm in relation to in-house
infrastructure have led to an explosion of customer
interest and entrepreneurs’ investments, resulting in
ubiquitous infrastructures now referred to as clouds.
More recently, cloud computing has been extended
to refer to Software-as-a-Service (SaaS) clouds, data
clouds, etc. Nevertheless in this work we only con-
cern with Infrastructure-as-a-Service (IaaS) clouds:
The provisioning of virtual infrastructure resources
to customers, under a temporary contract that defines
all relevant aspects of the service. In the meanwhile,
as it is known that for big cloud providers, resources
can be provisioned as on demand mode. For in-
stance, Google App Engines (Engines, 2010), Ama-
zon EC2 (Cloud, 2010) and so on. However, for
smaller cloud providers with restricted resources, not
all the requests from customers can be satisfied, when
multiple-requests come at the same time.
In services science the contracts between cus-
tomers and service providers are referred to as Ser-
vice Level Agreements (SLAs). Currently, IaaS SLAs
are essentially static, and they do not bear any dy-
namic customer-specific customization. This work
takes them one step further, to enable at least a mini-
mal level of customization. The latter refers to Qual-
ity of Service (QoS) guarantees that customers re-
quest dynamically from the IaaS providers.
In order to satisfy as many customers as possible,
what service providers can do are: on the one hand
trying to find an optimal strategy for reservation of the
resources (e.g., virtual machine) in advance by sus-
pending and resuming the jobs with lower priorities
(Sotomayor et al., 2008); on the other hand, trying to
outsource from infrastructure subcontractors. In our
work, we focus on the later approach. Since there is
no prior work that has provided a consistent method-
ology for selecting infrastructure subcontractors and
generating the requests to them, in this paper, we pro-
pose a method of planning resource outsourcing and
local configurations for infrastructure services that are
subject to SLAs. Besides, a greedy algorithm for out-
sourcing, using cost, subcontractor reputation as well
as local resource configurations is also presented.
The rest of the paper is organized as follows. In
Section 2 we describe problem statement about the
motivation of this paper as well as preliminary as-
sumptions for the proposed solutions. Then the model
343
Lu K., Röblitz T., Chronz P. and Kotsokalis C..
SLA-BASED PLANNING FOR MULTI-DOMAIN INFRASTRUCTURE AS A SERVICE.
DOI: 10.5220/0003386603430351
In Proceedings of the 1st International Conference on Cloud Computing and Services Science (CLOSER-2011), pages 343-351
ISBN: 978-989-8425-52-2
Copyright
c
2011 SCITEPRESS (Science and Technology Publications, Lda.)

of the problem is given in Section 3. In Section 4 we
discuss about subcontracting in IaaS. Furthermore,
based on the work that we have done in previous sec-
tions, in Section 5 we describe the bottom line for sat-
isfying the request from customer by mashing up the
local and external resources. In Section 6 we present
the experimental verification and in Section 7 the state
of the art of related problem is analyzed. Finally we
conclude the paper in Section 8.
2 PROBLEM STATEMENT
An IaaS provider, just like any service provider, seeks
to maximize profits and achieve business sustainabil-
ity. These translate to attractive and competitive pric-
ing while allowing for an acceptable profit margin,
but also avoiding penalties and building a reputation
that will lead to longer contracts and returning cus-
tomers.
On the same time, resources are finite. It might
be the case that IaaS providers must turn to external
entities and competitors if they run out of resources
(Figure 1), so that they do not lose the customer –
even if that may compress their profit margins for the
specific contract. Other reasons why this may hap-
pen are requests for unsupported resource types, or
unsupported storage locations (perhaps desirable for
legal reasons), etc. Independent of the reason, a ser-
vice provider may become a customer itself to another
provider. This subcontracting requirement is further
underlined in a scenario where autonomous agents ne-
gotiate for resources on demand, in a fully dynamic
environment without human intervention. Recent
standardization efforts (e.g., the Open Cloud Comput-
ing Interface (OCCI) (Forum, 1999)) are pointing to
the direction of interoperable cloud interfaces for pro-
visioning requests. This is something that we expect
to exist as a means of such subcontracting, in com-
bination with standards for SLA negotiation, such as
WS-Agreement (Forum, 2007).
Customer
Request
I need 500
cores.
Provider
A
Provider
B
Provider
C
Request
Request
I only have
300. I will
ask B and C
for 200.
Figure 1: Multi-domain resource provisioning.
The problem that this work tries to solve is how to
plan for internal resources and outsourcing (subcon-
tracts for external resources) in such a manner that:
profitability requirements are satisfied; financial risk
is kept low; reputation remains as good as possible;
and price quotes provided to customers are minimized
for reasons of competitiveness. SLAs are used as a
means to establish formally the agreement between
the provider and the customer. They concern the ser-
vice, its qualitative characteristics, and the penalties
in case of violation of the agreement. This differs sig-
nificantly from simple provisioning requests, as it con-
tains guarantees for quality and penalties.
Certain assumptions are made as a basis for the
proposed solutions.
1. If the provider owns resources (i.e. it is not a pure
resource reseller) it always prefers to utilize them
first, before turning to subcontractors.
2. There are no locality or other kinds of dependen-
cies between the requested resources. They can
be arbitrarily split between different locations and
administrative domains, if needed. Nevertheless,
we must make an effort to keep as many as pos-
sible co-located, to facilitate data exchange and
therefore performance. Thus, if resources are out-
sourced, the number of subcontractors must re-
main as low as possible.
3. The customer’s requirements are strict. There is
no SLA negotiation other than consecutive re-
quests for quotes, possibly followed by a message
to establish the agreement for the latest quote. The
response to a customer request for N resources
of some type, at certain quality, is a tuple of the
form (n, p,t). Element n is the confirmed resource
quantity, p is the price, and t is the validity period
for this quote. If the provider cannot offer as many
resources as the user requested, it is considered
possible to return a value n < N.
4. There is a specific and unambiguous penalty
scheme for violated SLAs. All parties involved,
both end-customers and providers, are aware of
this scheme either by default or via negotiation.
Without loss of generality, in our approach this
scheme is defined as a fixed penalty in the case
that the SLA is violated.
5. Providers decide at runtime on the importance of
accepting and enforcing each incoming SLA re-
quest. They make dynamic decisions about how
far they will go to ensure that a SLA is not vi-
olated, based on business criteria such as costs,
profit and failure risks.
3 PROBLEM MODELING
Let us assume resource types R
1
, R
2
, ..., R
n
, each bear-
CLOSER 2011 - International Conference on Cloud Computing and Services Science
344

ing characteristics H
i
1
, H
i
2
, ..., H
i
m
i
, 1 ≤ i ≤ n. Those
characteristics refer to inherent resource details, e.g.,
location of resource, clock speed for CPU cores, etc.
The qualitative characteristics supported in SLAs
is a topic heavily researched in the last decade (e.g.,
(Zhou et al., 2004; Dobson and Sanchez-Macian,
2006)). In this paper we do not go in detail to define
the exact qualitative characteristics to be requested
by customers; we only assume that there is a list of
such supported characteristics, published by the cloud
provider within SLA templates – that is, customizable
documents that serve as a basis for bootstrapping SLA
negotiation. Eventually, a provisioning request (in the
form of a SLA establishment request by the customer,
or a request for a price quote) will include a list of
quantities for resources with specific characteristics
and specific qualities. We do not consider the exact
semantics of the qualities. Rather, they come into the
model as coefficients for defining costs.
3.1 Cost
As discussed in Section 2, we wish to minimize the
cost for implementing a solution, while respecting
constraints for profitability and financial risk related
to SLA violations (i.e. failure to comply with SLAs).
We are modeling cost C
i
for a solution involving re-
source R
i
as the sum of internal cost C
i
I
(i.e. resources
utilized internally) and external cost C
i
E
(i.e. sub-
contracted resources). Internal cost is then modeled
after the base cost per resource unit C
i
B
for a solution
given standard (baseline) Quality of Service (QoS).
C
i
B
is multiplied by a factor σ
i
that models the cost
of increased QoS as it is given within the quote/SLA
request by means of conditions Q
i
1
, Q
i
2
, ..., Q
i
r
i
for the
qualitative characteristics of the resources, and apply-
ing price reductions for bulk purchases (i.e. large val-
ues for resource quantity N
i
). Function d
i
models
such price reductions; the value it returns represents
the percentage of resources that the customer receives
for free. Finally, the total amount of resources re-
quested by the user is multiplied with the previous
figures. The total cost C is the sum of cost for all
resources.
σ
i
= [1 − d
i
(N
i
)] · f
i
(Q
i
1
, Q
i
2
, ..., Q
i
r
i
) (1a)
C
i
I
= N
i
· σ
i
·C
i
B
(1b)
C
i
= (1 + β
i
) ·C
i
I
+C
i
E
(1c)
C =
∑
i
C
i
f
i
(Q
i
1
, Q
i
2
, ..., Q
i
r
i
) ≥ 1 (1d)
0 ≤ d
i
(N
i
) ≤ 1 (1e)
The improved –in relation to baseline– quality
represented by function f
i
corresponds to increased
measures, such as committing additional resources to
improve availability, or have more people in the data
center. As such, it also reflects increased costs. In
general, each provider has its own methods to imple-
ment increased QoS for a specific service, therefore
the only generic modeling option is to use its effect
on the implementation cost. In Section we refer to
some relevant work for determining at design-time
such additional costs, in relation to the requested QoS
increase.
Variable β
i
is a quality multiplier that affects the
internal cost in Equation. It indicates the provider’s
dynamic policy with regard to the additional measures
to take, in order to safeguard the respective guaran-
teed quality of a certain specific SLA.
3.2 Profit
Function f
i
returns a cost result for some standard
failure probability per resource, e.g., 5%. Yet, a
provider may wish to diverge from typical contract
violation risks and further decrease this probability,
by setting β
i
to a value larger than 0. Overall, it is not
sensible to charge the customers for additional quality
(than what they originally requested), only because it
is in the provider’s best interest. Thus, the provider
will have to compress its originally targeted profit F,
by subtracting these extra costs:
F
i
= g
i
(C
i
I
,C
i
E
) − β
i
·C
i
I
(2a)
F =
∑
i
F
i
(2b)
In general, it is reasonable to model profit based
on the cost of implementation (e.g., as a percentage
of it), as it can be given by function g
i
. This function
also models other factors that affect profit, and which
do not have to do with the quality of the implemented
solution. For instance, in order to sign up a customer
in hope of additional future contracts, a provider may
actually make no profit, but rather sell at cost level.
Function g
i
would then return a value of 0. We con-
sider such decisions to be made on a business level,
by means different than the system described in this
work.
3.3 Failure Probability
We accept by default that a better solution is also a
more expensive solution; and that a more expensive
solution is at least as good as the cheaper ones. There-
fore, as β
i
increases, the cost of implementation also
increases (or, at the very least, does not decrease). If
reaching the requested QoS for a resource R
i
demands
–according to some model– a factor of β
i
1
, then using
SLA-BASED PLANNING FOR MULTI-DOMAIN INFRASTRUCTURE AS A SERVICE
345

any larger factor β
i
2
in the calculations would mean in-
creased cost, but also perhaps further increased qual-
ity. In other words, it would be less probable that
the requested QoS will not be met and that the SLA
will be violated. Thus, if P
i
V
is the probability that
a SLA will be violated due to R
i
failing to deliver
(Equations 3a), we have:
P
i
V
= h
i
(β
i
, T
i
) (3a)
T
i
=
(
0, if s = 0
1
s
·
∑
s
j=1
T
i
j
, if s > 0
(3b)
dP
i
V
dβ
i
≤ 0 (3c)
T
i
j
is a measure of reputation of subcontractor j in-
volved in the delivery of resource R
i
and the respec-
tive SLA. More specifically, it models the historical
failure rate (violated SLAs as a percentage of total
SLAs) for previous contracts established for this re-
source, with the specific subcontractor. As such, the
failure rate is always expected to take values between
0 and 1.
T
i
aggregates the failure rates of all subcontrac-
tors for the specific resource and the specific SLA cur-
rently under negotiation. If all resources are commit-
ted locally then T
i
equals zero, otherwise it is given
by Equation 3b, where s is the number of subcontrac-
tors chosen and involved in the new contract. Figure 2
illustrates Equation 3c in a more intuitive manner for
an example relation of reverse logarithmic nature.
P
β
v
P1
P2
P3
β
1
0
β
2
β
3
Figure 2: Relationship of failure probability and quality fac-
tor.
The graph never reaches the horizontal axis, as-
suming that there are events outside the control of the
provider (force majeure), hence the probability of fail-
ure will never equal zero. Nevertheless, with none or
small additional costs committed (low value for β) it
is more probable to diverge from the QoS level guar-
anteed by the SLA. The further we go to safeguard
the agreed QoS level (by providing more resources
via the β variable), the less probable it is to violate
the SLA.
A similar graph would represent the relationship
between failure probability and subcontractor reputa-
tion. The higher the reputation (i.e. the lower the past
failure ratio), the smaller would be the probability that
the SLA with the subcontractor –and hence, the orig-
inal SLA with the end customer– would fail.
3.4 Complete Problem Definition
Based on the previous sections, the problem we are
trying to solve is to minimize cost (Expression 4a)
while profit and the probability of failure remain
within acceptable limits as dictated by high-level
business rules (Equations 4b and 4c). F
∗
represents a
minimum acceptable profit, that depends on the cus-
tomer’s profile; and P
i∗
V
represents a maximum ac-
ceptable failure probability, which may also be asso-
ciated with specific customers or other business con-
ditions at the time of negotiation.
∑
i
(1 + β
i
) · N
i
· σ
i
·C
i
B
+C
i
E
(4a)
∑
i
g
i
(C
i
I
,C
i
E
) − β
i
·C
i
I
≥ F
∗
(4b)
h
i
(β
i
, T
i
) ≤ P
i∗
V
(4c)
0 ≤ β
i
, ∀i (4d)
Eventually, they all depend on the decision vari-
able vector b = (β
1
, β
2
, ..., β
n
). Especially for failure
probability, it is useful to underline that its minimiza-
tion is practically equivalent to optimizing long-term
reputation. As a side note, it should be mentioned that
changes in b do not affect the quality of outsourced
implementations (i.e. there is no compensation), al-
though they can improve the total failure probability
P
i
V
.
The increase or decrease of the quality multiplier
for the resources may affect profit and failure proba-
bility in converse ways. Higher quality means higher
costs, lower profits, and less chances to fail. What
we need to achieve is to find the lowest possible qual-
ity multipliers according to risk management policies,
the highest possible according to profitability policies,
and confirm they are not excluding each other. Then,
the lower values can be used to compute the cost of
implementing the solution with maximum profit and
within acceptable limits for failure probability.
We can also see that cost and failure probabil-
ity are affected by the costs for external resources
C
E
= (C
1
E
,C
2
E
, ...,C
n
E
) and the failure rates of the sub-
contractors for those resources, T = (T
1
, T
2
, ..., T
n
).
Because of the first assumption outlined in Section 2,
CLOSER 2011 - International Conference on Cloud Computing and Services Science
346
we can first solve the problem of optimized outsourc-
ing to subcontractors for excess resources, and then
proceed to solve Problem 4 taking into account the
solutions from the former. The fact that we have two
criteria for selecting the distribution of the resources
makes things more complex. We will apply a sim-
ple heuristic and try to also reduce the total number
of subcontractors (due to the second assumption of
Section 2), according to their resource availability. If
necessary according to business requirements, repu-
tation constraints will be applied to exclude providers
that do not meet certain thresholds.
Before continuing to discuss the proposed solu-
tions to the problems, it must be noted that the case
of an isolated cloud provider (i.e. a provider that does
not delegate resource provisioning to other providers,
rather is bound solely to the availability of its own re-
sources) can be modeled as above, with C
i
E
and T
i
always equal to 0. Additionally, as also mentioned
earlier in the text, the case of a resource reseller who
has no private infrastructure is sufficiently represented
as well. It only has to solve the bi-criterion resource
assignment problem and then add a profit to the price
according to business policies.
4 SUBCONTRACTING
The first step to execute is to see whether there is a
part (perhaps all) of the requested resources in the in-
coming SLA request that the provider cannot offer.
Let N
i
L
be the number of local resources of type R
i
,
characteristics H
i
1
, H
i
2
, ..., H
i
m
i
and quality properties
Q
i
1
, Q
i
2
, ..., Q
i
r
i
. We need to take into account the re-
source constraints of candidate subcontractors. Ac-
cording to the SLA templates they publish, we can
see whether they offer the resources we need, so that
we can contact them with a SLA request. As men-
tioned in Section 3.4, our eventual choice must take
into account their reputation (failure history) and the
price quotes they provide. These two competing crite-
ria constitute a multi-objective optimization problem,
which is oftentimes solved so that a set of equally
good (non-dominated) solutions are produced. Then,
a decision maker chooses one of those which is con-
sidered “best” according to her judgement. Con-
versely, we will employ the scalarization technique of
ideal point (Collette and Siarry, 2003), where we are
measuring a point’s distance from what would be an
ideal combination for cost and failure ratio. Clearly,
that would be the point (0, 0), i.e. perfect service
given for free. The reason we are scalarizing, instead
of searching for multiple candidate solutions in the
form of a Pareto front (Collette and Siarry, 2003), is
that we wish to implement this step in a completely
automated manner, without involving a human deci-
sion maker. Performance considerations also apply.
We start with the set S of all candidate subcontrac-
tors, according to the SLA templates they publish. If
needed, according to risk mitigation strategies and re-
spective business rules, we remove from the set all
candidates that do not meet a certainly low threshold
for failure history. Following, we submit a quote re-
quest for the full amount of N
i
L
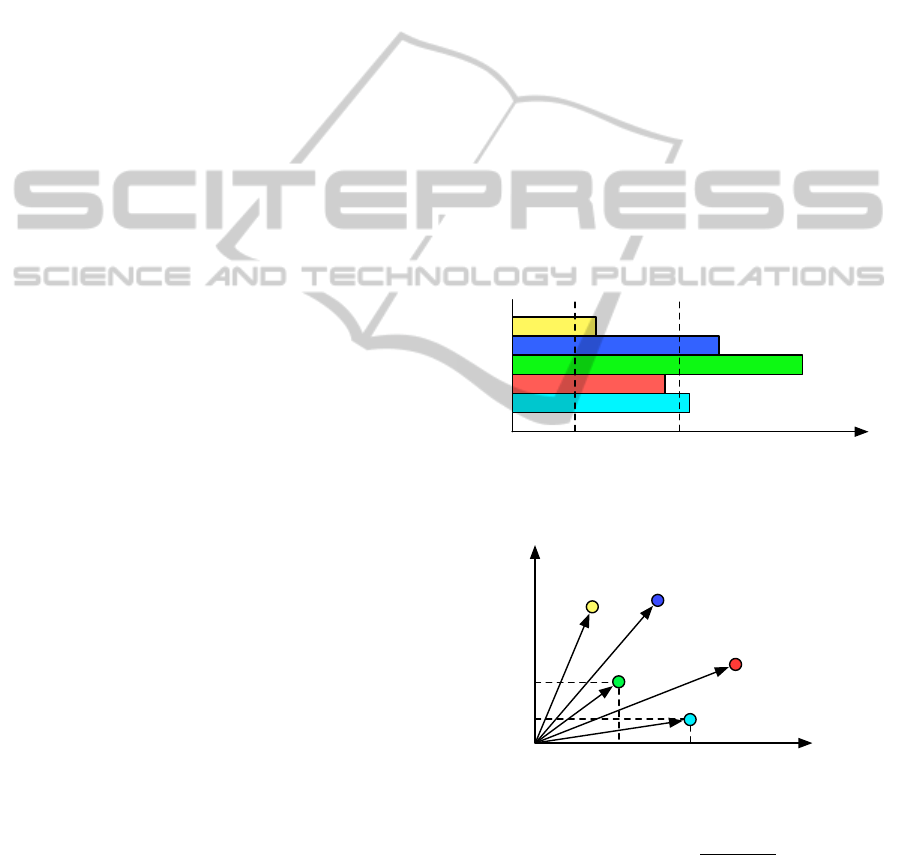
, to all members of S.
Some of them may be unable to satisfy the request for
the amount of requested resources, and respond with
the maximum capacity they can offer (e.g., as in Fig-
ure 3, for resource amount L2 and candidates A and
D). If this capacity is too small, under some prede-
fined threshold, the respective subcontractors are re-
moved from S and the process, in order to avoid trivial
contracts. If it is significant (although insufficient), a
second request is sent to them for the maximum possi-
ble amount of resources. Eventually, for all providers
we have a price that corresponds to bulk purchases but
respects their resource limitations.
Resource Quantity
Subcontractors
E
D
C
B
A
1
L
2
L
Figure 3: Resource request levels, and subcontractors with
different capacities.
Price
Failure Ratio
T T
C
C
1
1
2
2
i
i
i
i
Figure 4: Price per unit and failure rates for subcontractors.
For each provider in S we compute its distance
from the ideal point, as D =
q
C
i
j
2
+ T
i
j
2
, C
i
j
being the
price per resource unit from provider j, and T
i
j
being
its historical failure rate (Figure 4). After we choose
the closest one, we try to establish an agreement for a
quantity that respects its declared capacity. If there is
more than one with the same (smallest) distance, we
choose either the cheapest per unit or the one with the
SLA-BASED PLANNING FOR MULTI-DOMAIN INFRASTRUCTURE AS A SERVICE
347

largest capacity, depending on what is least expensive
for the total quantity. In the extreme case that costs
are the same, we choose one at random. If at the end
of this process there are still unassigned resources, we
remove currently utilized subcontractors from S, and
repeat with the new excess amount until there are no
unassigned resources. The process is executed for all
resource types for which we do not have enough local
capacity.
5 LOCAL RESOURCE
CONFIGURATION
In the previous section we addressed the issues of
outsourcing excess resources for large customer re-
quests (or requests for types of resources that we do
not own). After this process, we have the external
cost per resource C
i
E
, and the subcontractors failure
rate per resource T
i
. Using these values, we can
solve Equations 4b and 4c to come up with a deci-
sion space for vector b depending on the dynamic,
customer and/or request-specific thresholds for min-
imum acceptable profit F
∗
and maximum acceptable
failure probabilities P
i∗
V
. Apparently, for 4b we will
receive a maximum possible value of each β
i
, while
for 4c we will receive minimum values. If the lat-
ter are higher than the former, then this means that
the problem cannot be satisfied, and therefore the in-
coming SLA request must be rejected (or dealt with
according to the provider’s best understanding). Oth-
erwise, the lowest values can be chosen to be used in
Expression 4a, for computing the final price quote (as
the sum of implementation costs and total profit) to
return to the prospective customer.
Eventually, to apply the complete methodology, a
provider would need to have the following available
in advance: A function to provide price reductions for
bulk purchases; A baseline resource price, and a func-
tion to associate increased QoS to a price relevant to
standard prices; The expected profit as a function of
implementation and outsourcing costs; A minimum
acceptable profit depending on each request (e.g., cus-
tomer, class of service, etc); And the failure probabil-
ity as a function of such failure / violation precau-
tion measures. While the former four are business-
related and largely the result of respective high-level
decisions, the latter is a statistical property that can be
acquired by design-time models and monitoring data.
6 EXPERIMENTAL
VERIFICATION
6.1 Scenario
To evaluate the model with regard to its validity, we
established a simulation scenario with specific func-
tions for increased quality costs, profit, failure prob-
ability, etc. Resources under negotiation are CPU
cores and storage. CPU cores are offered in 4 dif-
ferent combinations of clock speed (1GHz or 2GHz)
and volatile memory (1Gb or 2Gb). Storage is offered
in arbitrary quantities, in increments of 1Gb. Their
negotiated qualitative characteristics are availability,
measured as a percentage of time, and isolation, indi-
cating that the customer’s virtual resources have ex-
clusive access to the physical infrastructure that im-
plements them (e.g., a blade server).
CPU core prices are given by Table 1 in the form
of normal distributions (identified by the mean value
and variance). Similarly, the price for storage is 2 ±
0.5 per Gb. In each simulation run, each provider is
assigned resource price values at random, from these
distributions.
Table 1: CPU core prices.
1GHz 2GHz
1Gb 50 ± 5 100 ± 10
2Gb 100 ± 10 150 ± 15
Price reductions are given as a stepwise function
ranging between 0% and 20%, in steps of 5% at re-
source quantities 15, 50, 150 and 500. We don’t dis-
tinguish between the type of resources, rather we ap-
ply the same function both to CPU cores and storage.
The increased costs for higher quality (i.e. function
f
i
) are a 50% additional cost for isolation (which can
only be true or false), and 10% for each additional
unit of availability. Baseline availability is 95%, and
maximum is 99%. Default value for isolation is false.
We use the same function for both resource types.
Profit function g
i
is given for both resource types as
g
i
= 0.3 · C
I
+ 0.05 · C
E
. That is, the provider also
makes a very small profit from outsourced resources.
Therefore, price quotes to the customer are provided
as g(C
I
,C
E
) +C
I
+C
E
, minus applicable price reduc-
tions.
An initial (artificial) SLA past failure rate is se-
lected to be 20%. Random SLA violations are in-
troduced, in a rate always in accordance with the
site’s failure rate for each resource. Failure frequency
is then further controlled by the selected values for
β; each time we choose such a value, we modify
CLOSER 2011 - International Conference on Cloud Computing and Services Science
348

the failure rate to reflect these extra measures we
take to safeguard the SLAs. The minimum profit
F
∗
depends on the customer. We have three cus-
tomer classes; namely, Gold, Silver and Bronze. For
Gold customers, F
∗
is 0.7 · g(C
I
,C
E
); for Silver it is
0.8 ·g(C
I
,C
E
); and for Bronze it is 0.9· g(C
I
,C
E
). We
are allowing additional resources (and hence, lower
profit) even for bronze customers, as we wish to im-
prove the reputation of the provider. Our target is to
reach a failure rate equal to 5% or less, given the small
gradual effect of β on the future violations.
h
0.2
i
β
i
Τ
i
self
10
-2
Figure 5: Function h
i
in relation to β
i
values.
Function h
i
takes values between the maximum
(statistical) failure rate T
i
sel f
and a very small value
(chosen to be 10
−2
), which becomes effective when
β
i
reaches a value of 0.2 (Figure 5). In other words,
values of β
i
larger than 0.2 (20% more than the nor-
mal implementation costs) make no difference to the
probability of failure. Finally, we examine the case of
four connected providers, one of which is the “main”
site, and the other three are subcontractors.
6.2 Results
Figure 6 illustrates the most important results of the
simulation. The top four plots show the available
resources over time, for the main site and the three
subcontractors. We can see that as soon as the main
site’s resources become depleted, it is mostly the 3rd
subcontractor that is being utilized, as it is the “best”
from a price and failure rate point of view. Following,
the 2nd and the 1st are utilized when the 3rd has no
more available resources. The bottom two graphs il-
lustrate the accumulated profit over time for the main
site, and the values for its failure rate. We can see
that the profit keeps increasing even when there are
few resources available and the site has to outsource.
Also, that the site’s reputation (failure rate) is improv-
ing significantly over time, starting with an artificial
failure rate of 20%, but eventually reaching and sur-
passing the target of 5%. This decrease of failures
was simulated by modifying the initial probability of
a failure event, according to the values β was taking
over the simulation time.
7 RELATED WORK
Many recent publications discuss the topic of SLA
management for Cloud computing, but most of them
are looking at it from a conceptual and architectural
point of view – e.g., (Brandic et al., 2009; Kertesz
et al., 2009; Stantchev and Schr
¨
opfer, 2009). To the
best of our knowledge, no prior work has provided
a consistent methodology for selecting infrastructure
subcontractors and generating requests to them.
Perhaps the closest to our work was presented by
(P
¨
uschel and Neumann, 2009). They adopt very sim-
ilar concepts, such as customer classes and price dis-
crimination, resource reservations and quality of ser-
vice, to integrate with policies (SLAs being a form
of those) and resulting in a job acceptance model
that maximizes the provider’s profit. The main dif-
ference to our work is that we assume the customer
to require the resources immediately, and if we do not
have enough, we try to find them from others and out-
source so that we sustain him. Conversely, the authors
of (P
¨
uschel and Neumann, 2009) are performing full
(local) resource scheduling.
(Malkowski et al., 2010) use a model of similar
economic aspects (cost-revenue-profit) for infrastruc-
ture, associated with Service Level Objectives. Their
work is focused on analyzing specific metrics such as
response time and throughput in a preparation phase,
and then using results to perform infrastructure plan-
ning and asses a static optimal workload that maxi-
mizes profit. Our work assumes such analyses exist
as prior work, and are used dynamically during run-
time.
(N. Paton et al., 2009) propose generic concepts
for optimization of a chosen “utility”, based on which
an autonomic broker (“workload mapper”) delegates
tasks to execution sites. As such, the paper is more
relevant to Platform as a Service (PaaS) and the Grid,
while we focus on application-agnostic infrastructure
providers.
(Van et al., 2009) use application-specific perfor-
mance models to achieve SLA compliance and opti-
mal resource allocation. Similarly, (Wada et al., 2009)
are exploring optimal application deployments so that
SLAs for the application are not violated, focusing
on service compositions and using a custom genetic
algorithm. Conversely, we do not assume any knowl-
edge about the executing application, and we concern
with SLAs for the infrastructure service (i.e. the re-
sources themselves). The customer already knows the
amount of resources necessary, and we use that infor-
mation to find the resources and satisfy the request.
(Hellerstein et al., 2005) propose to use inventory
control mechanisms to manage computing capacity of
SLA-BASED PLANNING FOR MULTI-DOMAIN INFRASTRUCTURE AS A SERVICE
349

!
0.02
0.04
0.06
0.08
0.1
0.12
0.14
0.16
0.18
0.2
0 2000 4000 6000 8000 10000 12000
Failure rate
Time
Failure rate for main site
500
550
600
650
700
750
800
850
900
950
0 2000 4000 6000 8000 10000 12000
Free resources
Time
Subcontractor 3: Free (CPU) resources
350
400
450
500
550
600
650
0 2000 4000 6000 8000 10000 12000
Free resources
Time
Subcontractor 2: Free (CPU) resources
520
530
540
550
560
570
580
590
600
610
0 2000 4000 6000 8000 10000 12000
Free resources
Time
Subcontractor 1: Free (CPU) resources
0
2e+06
4e+06
6e+06
8e+06
1e+07
1.2e+07
1.4e+07
1.6e+07
1.8e+07
2e+07
0 1000 2000 3000 4000 5000 6000 7000 8000 9000 10000 11000
Accumulated profit
Time
Accumulated profit for main site
0
100
200
300
400
500
600
0 2000 4000 6000 8000 10000 12000
Free resources
Time
Main site: Free (CPU) resources
Figure 6: Experiment results.
an application service provider (ASP). Their model
is restricted by a fixed upper bound of the available
resources at an ASP. In contrast, our model lever-
ages that bound by considering outsourcing to other
providers if the demand cannot be served locally.
(M. Armbrust et al., 2009) define a simple cri-
terion (cost balance) for letting a customer decide
whether to use in-house resources (e.g., in an enter-
prise’s data center) or external cloud resources. In
contrast, we present a model for letting cloud re-
source providers make sophisticated allocation deci-
sions. Particularly, we significantly extend the model
by considering multiple criteria, by enabling out-
sourcing to more than one provider and by supporting
provider cascading.
Finally, the RESERVOIR project (B. Rochwerger
et al., 2009) proposes an architecture for managing
infrastructure-level SLAs and for federating cloud re-
sources. The authors envision two modes for provider
internal capacity planning – based on explicit or im-
plicit requirements. For explicit requirements, so-
called elasticity rules shall govern on-demand re-
source scale-up or scale-down. In contrast, our work
provides a sound model for establishing SLAs includ-
ing subcontracting.
8 CONCLUSIONS AND FUTURE
DIRECTIONS
We have developed a model for IaaS providers, based
on which they can connect resource planning to high-
level business decisions, using SLAs as a formaliza-
CLOSER 2011 - International Conference on Cloud Computing and Services Science
350

tion tool. Our purpose was to compute minimum im-
plementation costs as part of price quotations towards
customers, in order to remain competitive. On the
same time, we used profit and SLA violation probabil-
ity constraints to decide whether the problem can be
satisfied at all, and what is the decision space based on
which implementation costs can be calculated. Out-
sourcing via subcontracts was included as part of the
decision process, to achieve additional profit but also
to sustain customers when local resources are not suf-
ficient. Our simulations prove that the approach is
feasible and works, yielding useful results given the
scenario that we chose to implement.
In the future we wish to extend the work to
include resource dependencies (therefore additional
constraints for making outsourcing decisions), ad-
vance reservations for complete resource scheduling,
and a penalty scheme connected to the business value
of each SLA guarantee.
ACKNOWLEDGEMENTS
The research leading to these results is supported by
the European Community’s Seventh Framework Pro-
gramme (FP7/2007-2013) and the SLA@SOI project
under grant agreement no.216556.
REFERENCES
B. Rochwerger et al. (2009). The RESERVOIR Model and
Architecture for Open Federated Cloud Computing.
IBM Journal of Research and Development, 53(4).
Brandic, I., Music, D., and Dustdar, S. (2009). Service me-
diation and negotiation bootstrapping as first achieve-
ments towards self-adaptable grid and cloud services.
In Proceedings of the 6th International Conference
on Autonomic Computing (industry session on Grids
Meets Autonomic Computing), pages 1–8. ACM.
Amazon EC2 Cloud (2010). http://aws.amazon.com/ec2/.
Collette, Y. and Siarry, P. (2003). Multiobjective optimiza-
tion: principles and case studies. Springer Verlag.
Dobson, G. and Sanchez-Macian, A. (2006). Towards Uni-
fied QoS/SLA Ontologies. IEEE Services Computing
Workshops, pages 169–174.
Google App Engines (2010). http://code.google.com/
appengine/.
Open Grid Forum. (1999). Open cloud computing interface.
http://www.occi-wg.org/ (Retrieved: Feb 2010).
Open Grid Forum. (2007). Web services agreement
specification (ws-agreement). http://www.ogf.org/
documents/GFD.107.pdf (Retrieved: Feb 2010).
Hellerstein, J. L., Katircioglu, K., and Surendra, M. (2005).
A framework for applying inventory control to capac-
ity management for utility computing. In Integrated
Network Management (IM 2005), pages 237–250.
Kertesz, A., Kecskemeti, G., and Brandic, I. (2009). An
SLA-based resource virtualization approach for on-
demand service provision. In VTDC ’09: Proceed-
ings of the 3rd international workshop on Virtualiza-
tion technologies in distributed computing, pages 27–
34. ACM.
M. Armbrust et al. (2009). Above the Clouds: A Berkeley
View of Cloud Computing.
Malkowski, S., Hedwig, M., Jayasinghe, D., Pu, C., and
Neumann, D. (2010). CloudXplor: A Tool for Con-
figuration Planning in Clouds Based on Empirical
Data. In Proc. 25th Symposium On Applied Comput-
ing (SAC’2010).
N. Paton et al. (2009). Optimizing Utility in Cloud Comput-
ing through Autonomic Workload Execution. IEEE
Data Eng. Bull., 32(1):51–58.
P
¨
uschel, T. and Neumann, D. (2009). Management of Cloud
Infrastructures: Policy-based revenue optimization.
In International Conference on Information Systems
(ICIS 2009).
Sotomayor, B., Montero, R. S., Llorente, I. M., and Foster,
I. (2008). Capacity Leasing in Cloud Systems using
the OpenNebula Engine.
Stantchev, V. and Schr
¨
opfer, C. (2009). Negotiating and
Enforcing QoS and SLAs in Grid and Cloud Comput-
ing. In Advances in Grid and Pervasive Computing,
volume 5529 of Lecture Notes in Computer Science,
pages 25–35. Springer Berlin / Heidelberg.
Van, H. N., Tran, F. D., and Menaud, J.-M. (2009). SLA-
Aware Virtual Resource Management for Cloud In-
frastructures. International Conference on Computer
and Information Technology, pages 357–362.
Wada, H., Suzuki, J., and Oba, K. (2009). Queuing
Theoretic and Evolutionary Deployment Optimization
with Probabilistic SLAs for Service Oriented Clouds.
In Proceedings of the 2009 Congress on Services-I-
Volume 00, pages 661–669. IEEE Computer Society.
Zhou, C., Chia, L.-T., and Lee, B.-S. (2004). DAML-QoS
Ontology for Web Services. IEEE International Con-
ference on Web Services, page 472.
SLA-BASED PLANNING FOR MULTI-DOMAIN INFRASTRUCTURE AS A SERVICE
351
