
A STATISTICAL APPROACH FOR IDENTIFYING MEMORY
LEAKS IN CLOUD APPLICATIONS
Vladimir
ˇ
Sor and Satish Narayana Srirama
Institute of Computer Science, University of Tartu, J. Liivi 2, Tartu, Estonia
Keywords:
Troubleshooting, Java
TM
Virtual Machine, Byte code instrumentation, Cloud computing, Tools.
Abstract:
This position paper describes the attempt to automate the statistical approach for memory leak detection in
Java
TM
applications. Proposed system extends the basic statistical memory leak detection method with further
intelligence to pinpoint the source of the memory leak in the source code. As the method adds only small
overhead in runtime it is designed to be used in production systems and will help detecting memory leaks in
production environments without constraint to the source of the leak. Architecture of the proposed approach
is intended to use in cloud applications.
1 INTRODUCTION
Memory leaks can be a major problem in distributed
applications, depleting their performance, even if they
run on platforms with automatic memory manage-
ment like Java Virtual Machine. Finding memory
leaks is coveredby many researches and there are sev-
eral tools and methodologies to find memory leaks.
However, these tools are incorporated in profilers and
are designed to use in the development phase. On one
hand, this is perfectly justified, as memory leaks are
bugs in software and finding bugs is a work for devel-
opers. For this to happen it is expected that such bugs
are found in test environment, or at least they can be
reproduced or simulated in test environment.
On the other hand, configuration of the production
environment (e.g. integrations with real systems), up-
time of the system is much longer, and the usage pat-
terns that real users generate are much more rich than
teams of Q/A and analysts could think of. All this
means that in production could happen more untested
situations that may result in memory leaks. And a
memory leak even in a modern JVM will inevitably
result in the need for a restart of the JVM.
Use of clustering and cloud computing (Armbrust
et al., 2009) reduce the impact of such restarts for
the end user, who may even not notice anything,
but for operations this still is a problem. Moreover,
cloud computing and virtualization brings in addi-
tional uncertainty of not knowing the configuration of
the physical hardware on which the application is ac-
tually running. Thus, a memory leak that only occurs
in production under very specific circumstances (of-
ten hardly specifiable) can be very hard to find and fix
in development and test environments.
This is the area we think we can improve by de-
veloping the solution that uses efficient statistical al-
gorithm to detect memory leaks in advance, imposes
low overhead in production system and would help
tracking down the source of the leak. The rest of the
paper is organized as follows. Section 2 address the
related work in detail. Section 3 describes the statisti-
cal method we propose along with preliminary analy-
sis. Section 4 discusses how cloud computing benefits
from such a method. Section 6 concludes the paper
with future research directions.
2 RELATED WORK
Memory leaks havebeen studied in the industryand in
research community extensively and currently there
are several approaches for finding memory leaks in
Java applications.
First option is the offline memory dump analy-
sis. Offline in this context means that the memory
dump is taken and then analyzed outside of the run-
ning JVM. Memory dump can be either requested
from the live JVM (during this procedure JVM ex-
ecution is stopped) or it can be generated automati-
cally by the JVM when out of memory condition oc-
curs. There are several algorithms to analyze memory
dumps to detect possible leaking objects. For exam-
ple (Maxwell, 2010) shows usage of graph mining al-
623
Šor V. and Narayana Srirama S..
A STATISTICAL APPROACH FOR IDENTIFYING MEMORY LEAKS IN CLOUD APPLICATIONS.
DOI: 10.5220/0003389906230628
In Proceedings of the 1st International Conference on Cloud Computing and Services Science (CLOSER-2011), pages 623-628
ISBN: 978-989-8425-52-2
Copyright
c
2011 SCITEPRESS (Science and Technology Publications, Lda.)

gorithms for this purpose. Eclipse Memory Analyzer
or MAT (The Eclipse Foundation, 2010) is an exam-
ple of production quality heap dump analysis software
which is freely available. However, such offline anal-
ysis has several problems: heap dumps can be expen-
sive to acquire in production environment (because
generating a dump file requires freezing the applica-
tion) and heap dump files can be very big (up to sev-
eral gigabytes, depending on the memory configura-
tion). Because of the file size it can be hard to run
analysis software on a regular development machine.
Another drawback is the static nature of the memory
dump – there is no information regarding the source
of allocation of the objects, so finding the code re-
sponsible for memory leak is a separate task from just
finding leaked objects.
Another approach is to monitor certain collection
classes for unlimited growth. This approach relies
on bytecode instrumentation and one possible solu-
tion is described in (Xu and Rountev, 2008). This
technique is also used in several Application Per-
formance Monitoring (APM) suites. For example,
CA Wily Introscope
R
LeakHunter
TM
(CA Wily In-
troscope, 2010) and AppDynamics (AppDynamics,
2010). Both APM suites add some intelligence to ease
finding the cause of the memory leak. Unfortunately
there is no information about exact algorithms used in
them. Also, mentioned APM suites are targeted to the
Java Enterprise application and are not applicable for
example for desktop GUI applications.
As alternative to direct bytecode instrumentation,
aspect-oriented instrumentation may be used to find
the metrics needed for memory leak detection. Find-
Leaks tool is using AspectJ pointcuts for this purpose
to analyze references between objects and find out
leaking objects together with the sites of allocation
(Chen and Chen, 2007). In that paper only GUI ap-
plications were used for testing.
Profilers are often used in development for find-
ing memory leaks. Different profilers allow gathering
different metrics that may help finding memory leaks.
For example, profiler of the NetBeans IDE can obtain
object age which can then be used by human opera-
tor to apply statistical method (Sedlacek, 2010). This
data can be collected during object allocation profil-
ing. Major disadvantage of the profilers is the need for
qualified and experienced operator who can find the
actual leaking code. Inexperienced developer, given
the profiler, fact of the memory leak and reasonably
big code base would be arguably successful in this
process.
In addition to different instrumentation and byte
code modification techniques there are several re-
search projects applying different statistical meth-
ods for analyzing unnecessary references between ob-
jects: Cork, (Jump and McKinley, 2007) and stale ob-
jects: SWAT, (Chilimbi and Hauswirth, 2004). Cork
implements statistical memory leak detection algo-
rithm directly in the Virtual Machine by integrating
the method in the garbage collector itself. Cork has
achieved significantly small performance penalty –
only 2% and good results in memory leak detection
(Jump and McKinley, 2007). The only problem is
that this project is implemented as a module in the Re-
search Virtual Machine (RVM) Jikes (The Jikes RVM
Project, 2010), which makes it usable mostly in the
research community, as the industry is not very keen
anticipating the research VM.
Biggest disadvantage of these methods is the need
for qualified human operation to analyze gathered
data to find real place in the source code responsi-
ble for the memory leak. We think that this manual
decision and search process can also be automated.
3 STATISTICAL APPROACH TO
MEMORY LEAK DETECTION
Based on the review of related work we noted that
there is still space for the automated end-to-end mem-
ory leak detection solution that would work on the
HotSpot or OpenJDK Java Virtual Machines, would
maximally assist the developer by pinpointing both
allocation and reference points of leaking objects and
would do that also in the distributed and cloud envi-
ronments with little performance penalty so it could
be usable in production systems. Similar idea about
memory leak detection with statistical method is de-
scribed in (Formanek and Sporar, 2006) as an ex-
ample of application of dynamic Java byte code in-
strumentation. However, so far it hasn’t been imple-
mented end-to-end in any knownprofilers or scientific
publications.
There are several challenges for implementation
of this approach using standard tools:
• Gathering the data with low overhead during run-
time. As the number of objects during application
is huge (for example, specJVM 2008 benchmark,
which we used to test performance impact, during
its 2 hour run created 877 958 317 objects).
• Actually applying statistical method in real time
to detect classes suspected to be leaking.
• Apply dynamic byte code instrumentation to find
spots of allocation and most importantly referenc-
ing objects (as actually objects referencing leak-
ing ones are sources of the leaks rather than those
instantiating leaking objects).
CLOSER 2011 - International Conference on Cloud Computing and Services Science
624
• Present findings in a user friendly way.
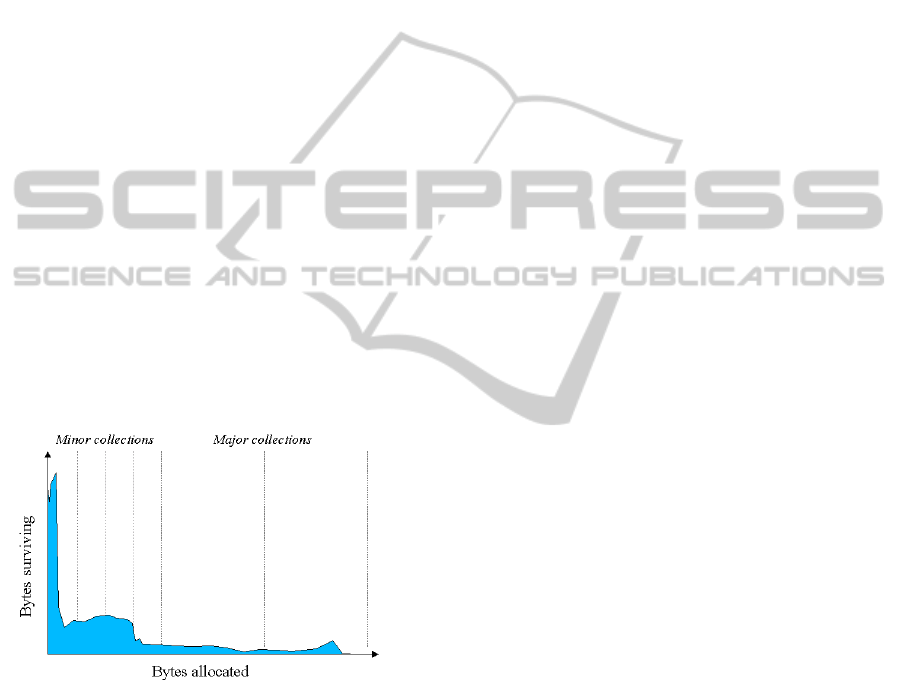
The basis of the statistical method is the genera-
tional hypothesis or infant mortality of objects and it
is described in (Sun Microsystems Inc., 2003). Gen-
erational hypothesis states that most of the objects
become unreachable very soon after creation, or in
other words – they ”die” young. This means that
the memory these objects occupy can be freed early
by garbage collector. Objects that stay reachable, or
alive, survive several garbage collection cycles.
On the other extreme there are number of objects
that were created during initialization and start up of
the application and they stay alive until the end of ex-
ecution (e.g., application main classes, static caches,
etc.). See figure 1. Leaking objects on the other hand
are being created time after time and not being freed
(thus the name – leak).
From these observations one can conclude that if
we measure the age of the object as the number of
garbage collection cycles (or generations) it has sur-
vived, then by analyzing how live instances of the
class are distributed over different generations we can
evaluate if objects follow the generational hypothesis.
If the number of generations, in which instances of a
class are present, keeps growing then this means that
application allocates objects of a particular type and
doesn’t free them, which suggests we have a memory
leak.
Figure 1: Distribution of survived bytes over generations,
(Sun Microsystems Inc., 2003).
Generational hypothesis is also a basis for mod-
ern generational garbage collectors that use it to di-
vide the heap into different regions to keep objects of
different age in different regions: eden, tenured and
permanent. Having different regions also yields to
different collections – minor (collection in eden space
only, takes place when there is no more space in eden
for new objects) and major (collection of both eden
and tenured spaces, takes place if collecting the eden
space haven’t freed enough space for the new alloca-
tion). Objects that have already survived some num-
ber of collections are moved from eden to tenured
space (Sun Microsystems Inc., 2003). So, as garbage
collector has to keep track of object ages anyway to
perform its work, the best place to collect the data
for the statistical method would be the garbage col-
lector itself. Unfortunately as of now it is not possible
as there is no interface in OpenJDK or HotSpot vir-
tual machines that would expose information about
the age of objects for external code.
In following sections we’ll describe our ideas and
tests we have conducted on how to gather required
data and implement the statistical method.
3.1 Automated Statistical Sampling
To implement the statistical method we have to mon-
itor object ages with small performance penalty.
As described in previous section we will designate
the time of creating of the object with the garbage
collector cycle counter. In section 2 we mentioned
that NetBeans profiler collects the garbage collection
cycle when profiling object allocations. Reasonable
question arises – why not use it somehow? As Net-
Beans are general purpose profiler it collects a lot
more information that is needed for our task and be-
cause of this much more overhead occurs both in
terms of memory and processor time.
So, to monitor the age of the object we need to
get information about garbage collector activity. As
garbage collector is an internal process of the JVM
and it doesn’t have any public API to access from Java
code, we have to utilize Java
TM
Virtual Machine Tool
Interface (JVMTI) functionality to get this data.
JVMTI provides native interface to add hooks for
the JVM’s internal events and functions to commu-
nicate with memory management, stack frames, and
many more. (Sun Microsystems Inc., 2006). The
functionality we require are the hooks for garbage
collection events:
void GarbageCollectionFinish(jvmtiEnv *env)
void GarbageCollectionStart(jvmtiEnv *env)
As the simplest solution, we created native agent
that uses JVMTI tagging to assign ages to objects.
In JVMTI tags are marker-values of type
long
that
can be attached using JVMTI functions to objects and
classes. Afterward, it is possible to iterate over heap
using JVMTI functions filtering objects by their tags.
Whether the tag will be used as a plain value or a
pointer to some richer data structure depends on the
usage. As tags are kept in the native memory rather
than on Java heap, their use would not introduce any
impact Java heap-wise, which is very desired effect
for the case we are addressing.
To set tags we used naive agent to instrument the
java.lang.Object
class to tag all created objects
A STATISTICAL APPROACH FOR IDENTIFYING MEMORY LEAKS IN CLOUD APPLICATIONS
625

with the value of current garbage collector genera-
tion, i.e. time of creation of an object. At the moment
of writing, the agent is also capable of outputting the
histogram of distribution of classes over generations
upon request.
As a next step of our research we’ll change the
agent in the way that for any given class it would
output number of different generations where live in-
stances of this class are present. Based on this output
statistical method will be applied to detect classes of
leaking objects. To define effective threshold value
for this number requires fair amount of testing on ap-
plications with different types of applications.
4 APPLICATION OF THE
METHOD IN CLOUD
COMPUTING
Troubleshooting applications, even on a single sys-
tem, can be a demanding task due to several factors
that must be considered and a lot of available mon-
itoring metrics from which correct conclusions have
to be made to fix the problem. Distributed computing
as such increases the complexity of troubleshooting,
because several machinescan now participate in a sin-
gle transaction. Cloud computing, with its elastic na-
ture and possibility of scaling to very large number of
virtual machines, further increases the troubleshoot-
ing complexity. Memory leak detection using statis-
tical method is only a part of our broader vision of
distributed troubleshooting tool. In the final picture,
memory leak detection will be one agent among dif-
ferent troubleshooting agents that could be dynami-
cally engaged or disengaged to detect different kinds
of problems.
The following subsections explain how the dis-
tributed troubleshooting tool method can be applied
in cloud computing domain and how cloud applica-
tions could benefit from it.
4.1 Deployment Scenario Architecture
Cloud computing is a style of computing in which,
typically, resources scalable on demand are provided
”as a service (aaS)” over the Internet to users who
need not have knowledge of, expertise in, or control
over the cloud infrastructure that supports them. The
provisioning of cloud services can be at the Infras-
tructural level (IaaS) or Platform level (PaaS) or at the
Software level (SaaS). A cloud computing platform
dynamically provisions, configures, reconfigures, and
de-provisions servers as requested. This ensures elas-
ticity of the systems deployed in the cloud. Our dis-
tributed troubleshooting solution will operate on the
IaaS level, meaning that the solution is aware of dif-
ferent virtual servers and will monitor separate JVM
instances.
To implement the automated statistical method, or
end-to-end memory leak troubleshooting solution for
the cloud computing domain, we propose monitoring
agents and analysis modules. The architecture of the
proposed solution is shown on Figure 2. Each JVM
under inspection will have one agent installed which
will perform sampling of object age distribution. Co-
ordinationserver, or dashboard, collects data from the
agents and applies the statistical method to find can-
didate classes, instances of which are suspected to be
leaking. After suspected classes are identified, adap-
tive introspection will take place. This means that the
agent will instrument only suspected classes and mon-
itor allocation sites and incoming references of the se-
lected instances. Collected data will be sent back to
the coordination server to be analyzed and presented
to the end user.
Figure 2: Proposed solution architecture.
Dashboard is an important part of the cloud de-
ployment as it aggregates the data from many cloud
instances. The coordination server and its activi-
ties can also be presented at the dashboard. Agents
and dashboard will use auto-discovery to automati-
cally configure new/shut down instances. Moreover,
as only the standard APIs are used in the approach,
it will be simple to deploy our solution with regular
shell scripts which belong the usual tool set for con-
figuring cloud instances.
4.2 Troubleshooting in Large Scale
Data Analysis Applications
Commercial APM suites are targeted to enterprise us-
age, mostly concentrating on web-based applications.
Our approach is also suitable for scientific comput-
ing and large scale data analysis applications, which
are getting more common on the cloud. One example
is MapReduce (Dean and Ghemawat, 2004), which
CLOSER 2011 - International Conference on Cloud Computing and Services Science
626
is a programming model and a distributed comput-
ing framework, which is widely used for large scale
data analysis on the cloud. It was first developed by
Google to process very large amounts of raw data that
it has to deal with on daily basis, e.g., indexed Inter-
net documents and web requests logs, which grows
every day. Google uses MapReduce to process data
across hundreds of thousands of commodity comput-
ers. However, Google’s implementation of MapRe-
duce is proprietary. Apache Hadoop is an open source
implementation of MapReduce written in Java. Apart
from MapReduce, Hadoop also providesHadoop Dis-
tributed File System (HDFS) to reliably store data
across hundreds of computers. Apache Hadoop is
in active development and is used both commercially
and in research community.
As part of other projects at our institute, we are
also interested in deporting several of our scientific
computing and enterprise applications to the cloud.
Especially we are interested in establishing private
clouds at the universities and deporting scientific
computing applications to the hybrid clouds. In the
Scicloud (Srirama et al., 2010) project we are mainly
studying how to reduce the scientific computing algo-
rithms to MapReduce framework so that they can effi-
ciently use the cloud computing resources. From this
analysis we observed that most of the scientific ap-
plications take huge amounts of resources and times
and observing the memory leaks in the algorithms is
very essential. We presume that statistical method for
detecting memory leaks will be applicable in the do-
main and our future research addresses this scope in
particular.
5 PRELIMINARY ANALYSIS OF
THE APPROACH
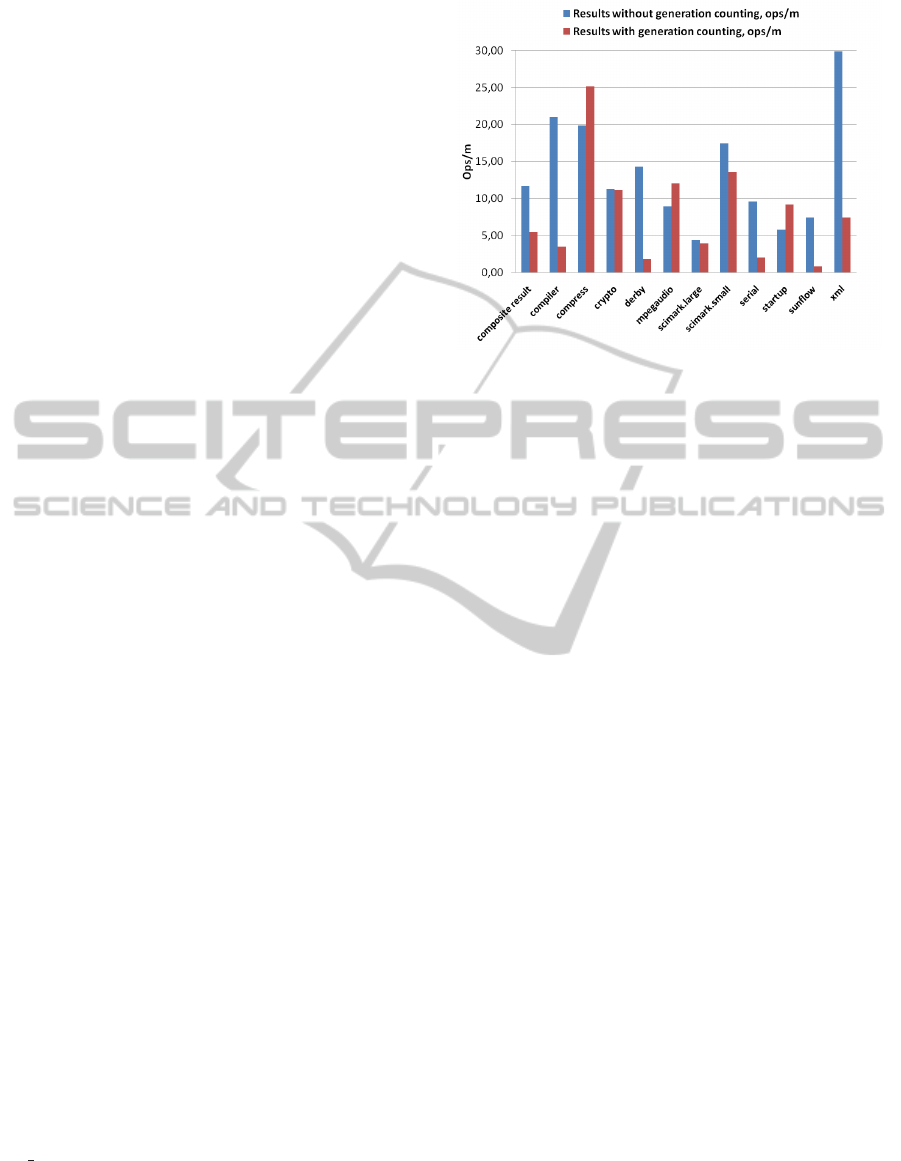
After implementing simple counting agent described
in section 3.1 we measured the performance impact
using SPECjvm2008 benchmark ((Standard Perfor-
mance Evaluation Corporation, 2008)) with and with-
out our age counting agent, which resulted in compos-
ite result of 11,72 ops/m and 5,48 ops/m respectively.
Detailed results of the benchmark are showed on fig-
ure 3.
Benchmarking was made on a laptop computer
with Java HotSpot
TM
Client VM (build 17.1-b03)
bundled with Java
TM
SE Runtime Environment (build
1.6.0 22-b04) on Intel
R
Core
TM
2 CPU at 1.83GHz
and 3GB ram under Windows XP, however actual
value of the benchmark result is not important while
we are interested only in the amount of performance
degradation, which is roughly 50%.
Figure 3: SPECjvm2008 results.
Current naive implementation of the sampling
method is a subject of further improvement and op-
timization.
To assess applicability of the method we used our
tool to find known memory leak in the HtmlUnit li-
brary. To find that leak manually we used to spend
one whole day. Our tool found the same leak in a
matter of minutes. We were successful in discover-
ing the type of leaking objects as well as the place of
adding leaking objects into the
HashMap
.
6 CONCLUSIONS AND FUTURE
WORK
Research and experiments done so far are show that
automating statistical method is promising both in
terms of memory leak detection and also in using
described method in cloud computing environments.
We are actively working on different aspects of cur-
rent proof of concept implementation.
Further work includes implementation of the
adaptive introspection i.e., collection additional data
like allocation and reference places in the source
code. Adaptive introspection will be achieved us-
ing dynamic byte code modification with the help of
JVMTI function
RetransformClasses
. Main ben-
efit on dynamic bytecode modification is that during
regular runtime code doesn’t have any overhead what-
soever. We only instrument classes that we are in-
terested in and after we got enough information to
present to the user we remove instrumentation. Work
done for JFluid (Dmitriev, 2003) shows that such lim-
iting of the profiling code yields in good results in
terms of performance overhead.
As described in section 3.1, the Java agent calcu-
A STATISTICAL APPROACH FOR IDENTIFYING MEMORY LEAKS IN CLOUD APPLICATIONS
627

lates the distribution of live instances of a class over
different generations and can provide gathered infor-
mation for analysis. Analysis will be performed out-
side of the JVM being under inspection. This de-
sign is made with distributed and cloud applications in
mind, to have one analysis dashboard which performs
analysis of several JVMs and gives an overview for
the end user. Performing analysis outside of the host
JVM will also use less computing resources of a host
JVM. Such cooperation of modules and their adapta-
tion will achieve what we call intelligence in terms of
profiling only what is needed and when it is needed.
When the class, instances of which are leaking, is
found, source of the leak is presented to the user then
the only thing left for him is to wait until JVM runs
out of heap memory. Collecting the data related to
the rate of creation of leaking objects, size of these
objects it is possible to forecast when out of memory
exception might occur. This information can be valu-
able for the operations team to know how to react and
when to be ready to react to out of memory error. In
case of web-applications the reaction might be adding
nodes (or cloud instances) to the cluster.
Finding the alarming ratio, or threshold, for the
count of live objects across different generations is
another topic for further testing and analysis.
ACKNOWLEDGEMENTS
This research is part of the EUREKA Project 4989
(SITIO) co-funded by the European Regional Devel-
opment Funds via Enterprise Estonia.
REFERENCES
AppDynamics (2010). Appdynamics home page. http://
www.appdynamics.com/.
Armbrust, M., Fox, A., Griffith, R., Joseph, A. D., Katz,
R. H., Konwinski, A., Lee, G., Patterson, D. A.,
Rabkin, A., Stoica, I., and Zaharia, M. (2009). Above
the clouds, a berkeley view of cloud computing. Tech-
nical report UCB/EECS-2009-28, University of Cali-
fornia.
CA Wily Introscope (2010). http://www.ca.com/us/
application-management.aspx.
Chen, K. and Chen, J.-B. (2007). Aspect-based instrumen-
tation for locating memory leaks in java programs.
In Computer Software and Applications Conference,
2007. COMPSAC 2007. 31st Annual International,
volume 2, pages 23 –28.
Chilimbi, T. M. and Hauswirth, M. (2004). Low-overhead
memory leak detection using adaptive statistical pro-
filing. In In Proceedings of the 11th International
Conference on Architectural Support for Program-
ming Languages and Operating Systems, pages 156–
164.
Dean, J. and Ghemawat, S. (2004). Mapreduce: Simplified
data processing on large clusters. In OSDI’04: Sixth
Symposium on Operating System Design and Imple-
mentation.
Dmitriev, M. (2003). Design of jfluid: A profiling technol-
ogy and tool based on dynamic bytecode instrumen-
tation. Technical report, Sun Microsystems Laborato-
ries.
Formanek, I. and Sporar, G. (2006). Dynamic bytecode in-
strumentation. Dr. Dobbs Journal, Online.
Jump, M. and McKinley, K. S. (2007). Cork: dy-
namic memory leak detection for garbage-collected
languages. In Proceedings of the 34th annual ACM
SIGPLAN-SIGACT symposium on Principles of pro-
gramming languages, POPL ’07, pages 31–38, New
York, NY, USA. ACM.
Maxwell, E. K. (2010). Graph mining algorithms for mem-
ory leak diagnosis and biological database cluster-
ing. Master’s thesis, Virginia Polytechnic Institute and
State University.
Sedlacek, J. (2010). Uncovering memory leaks using
netbeans profiler. http://netbeans.org/kb/articles/
nb-profiler-uncoveringleaks pt1.html.
Srirama, S. N., Batrashev, O., and Vainikko, E. (2010). Sci-
Cloud: Scientific Computing on the Cloud. In The
10th IEEE/ACM International Symposium on Cluster,
Cloud and Grid Computing(CCGrid 2010), page 579.
Standard Performance Evaluation Corporation (2008).
Specjvm2008. http://www.spec.org/jvm2008/. Veri-
fied in Nov. 2010.
Sun Microsystems Inc. (2003). Tuning Garbage Collection
with the 5.0 Java
TM
Virtual Machine.
Sun Microsystems Inc. (2006). Jvm
TM
tool interface. On-
line.
The Eclipse Foundation (2010). Memory analyzer. Online.
The Jikes RVM Project (2010). The jikes rvm project. On-
line.
Xu, G. and Rountev, A. (2008). Precise memory leak de-
tection for java software using container profiling. In
ICSE ’08. ACM/IEEE 30th International Conference
on Software Engineering, 2008., pages 151 –160.
CLOSER 2011 - International Conference on Cloud Computing and Services Science
628
