
A COMPREHENSIVE STUDY OF THE EFFECT OF CLASS
IMBALANCE ON THE PERFORMANCE OF CLASSIFIERS
Rodica Potolea and Camelia Lemnaru
Computer Science Department, Technical University of Cluj-Napoca, 26 Baritiu st., Cluj-Napoca, Romania
Keywords: Class imbalance, Metrics, Classifiers, Comprehensive study.
Abstract: Class imbalance is one of the significant issues which affect the performance of classifiers. In this paper we
systematically analyze the effect of class imbalance on some standard classification algorithms. The study is
performed on benchmark datasets, in relationship with concept complexity, size of the training set, and ratio
between number of instances and number of attributes of the training set data. In the evaluation we
considered six different metrics. The results indicate that the multilayer perceptron is the most robust to the
imbalance in training data, while the support vector machine’s performance is the most affected. Also, we
found that unpruned C4.5 models work better than the pruned versions.
1 INTRODUCTION
One of the current important issues in data mining
research, triggered by the rapid shift in status from
academic to applied science, is that of class
imbalance. It appears in areas where the classifier
has to identify a rare but important case (Barandela
et al, 2003), such as detecting fraudulent phone calls
(Barandela and Provost, 1996), intrusions (Cieslak et
al, 2006), failures in the manufacturing process
(Japkowicz et al, 1995), or in diagnosing rare
medical diseases (Cohen et al, 2006). In such
domains, the imbalance hinders the capability of
traditional classification algorithms to identify cases
of interest.
A problem is imbalanced if, in the available data,
a specific class is represented by a very small
number of instances compared to other classes
(Japkowicz and Stephen, 2002). It is common
practice to consider only binary problems when
dealing with imbalance (multi-class problems can be
converted to binary problems). The majority class is
usually referred to as the negative class and the
minority class as the positive class which is the one
of interest and possesses the same or (often) greater
importance than the negative class.
The first step in providing viable solutions for
imbalanced domains is to understand the problem:
what is the real issue with the imbalance? Recent
studies suggest that the nature of the imbalance
problems is actually manifold. In (Weiss, 2004), two
issues are considered as being crucial: (1)
insufficient data to build a model, in case the
minority class has only a few examples (similar to
dealing with small samples/small data sets), (2) too
many “special cases” in the minority class, so that in
the class itself, some kind of sub-clustering occurs,
which might lead again to insufficient examples for
correctly identifying such a sub-cluster.
An important theoretical result related to the
nature of class imbalance is presented in (Japkowicz
and Stephen, 2002), where it is concluded that the
imbalance problem is a relative problem, which
depends on: (1) the imbalance ratio, i.e. the ratio of
the majority to the minority instances, (2) the
complexity of the concept represented by the data,
(3) the overall size of the training set and (4) the
classifier involved. The experiments there were
conducted on artificially generated data, in the
attempt to simulate different imbalance ratios,
complexities and data set sizes. The results have
indicated that C5.0 is the most sensitive learner to
the imbalance problem, while the Multilayer
Perceptron showed a less categorical sensitivity
pattern and the Support Vector Machine seemed to
be insensitive to the problem.
In this paper we extend the analysis from
(Japkowicz and Stephen, 2002), by performing a set
of experiments on benchmark data sets, to study the
effect of the class imbalance problem on several
classes of algorithms: Decision Trees, instance based
learning, Bayesian methods, ensemble methods,
14
Potolea R. and Lemnaru C..
A COMPREHENSIVE STUDY OF THE EFFECT OF CLASS IMBALANCE ON THE PERFORMANCE OF CLASSIFIERS.
DOI: 10.5220/0003415800140021
In Proceedings of the 13th International Conference on Enterprise Information Systems (ICEIS-2011), pages 14-21
ISBN: 978-989-8425-53-9
Copyright
c
2011 SCITEPRESS (Science and Technology Publications, Lda.)

Artificial Neural Networks and Support Vector
Machines. Our initial analysis focuses on the factors
described in (Japkowicz and Stephen, 2002) – data
set size, imbalance ratio, complexity and learning
algorithm, in an attempt to address some of the open
questions presented in the above mentioned work,
related to the applicability of the conclusions drawn
on artificial data in real-world settings. We
conducted our experiments by evaluating various
performance metrics. The results of this first
investigation suggest that a more meaningful
analysis can be performed by considering the
imbalance ratio and the ratio between the total
number of instances and the number of attributes in
the entire data set, further referred to as IAR. We
show that the new grouping of problems, by this
meta-feature which combines data size and
complexity information, is more significant,
allowing for a faster and easier initial assessment of
a particular data set.
2 METRICS
Perhaps the most popular performance metric for
classification problems is the accuracy of the
induced model on a test sample. It provides a good
general estimation of the prediction capabilities of a
model, but it is widely accepted by the scientific
community as inadequate for imbalanced or cost-
sensitive problems (Chawla, 2006).
A classical example of why the accuracy is not
an appropriate metric in imbalanced problem is the
classification of pixels in mammogram images
(Woods et al, 1993).
Recent studies suggest using new approaches for
evaluating the performance in such problems. In
((Garcia and Herrera, 2009), (Batista et al, 2004),
(Chawla et al, 2002)), the area under the ROC curve
(AUC) is employed to assess the performance of
several sampling techniques. The ROC curve
measures the performance of a learner under all
possible trade-offs between the true positive rate
(TP
rate
) and the false positive rate (FP
rate
). It is
considered to be a consistent measure, even under
highly skewed class distributions. The AUC
provides a scalar summary performance assessment
for learning algorithms, based on the ROC curve.
However, it evaluates all possible decision
thresholds, while in imbalanced domains the focus
should be on the performance at a high decision
threshold.
In (Barandela et al, 2003) the geometric mean
(GM) is proposed as a metric for evaluating
classifiers in imbalanced domains. It is computed as
the geometric mean of TP
rate
and TN
rate
and it
provides a more objective estimation of the
prediction capabilities of a model than the accuracy.
It has been employed in several studies on
imbalanced problems ((Garcia and Herrera, 2009),
(Guo and Viktor, 2004)).
The average accuracy obtained on either/each
class also known as balanced accuracy
,
is another
symmetric measure which is more suited for
imbalanced problems (Brodersen et al, 2010). If a
classifier performs equally well on both classes, the
balanced accuracy reduces to its conventional
correspondent. If, on the other hand, the classifier
favours one class – the majority class – in an
imbalanced problem, and performs weakly on the
other, then the balanced accuracy will drop
accordingly, while the conventional accuracy will
still be high.
Another metric is the f-measure, or f-score ((Guo
and Viktor, 2004), (Chawla, 2006)), the harmonic
mean between the precision (Prec = TP /
(TP + FP)) and recall (Rec = TP
rate
). It provides a
trade-off between the correct identification of the
positive class and the cost (in number of FP errors)
of false alarms. A generalization of the metric – the
f
β
-measure – can be tuned to put more emphasis on
either the recall or precision: f
β
-measure = (1+β
2
) *
precision * recall / (β
2
* recall + precision); β>1
when we need to accentuate recall more. For a
specific problem, the goal is to identify the
appropriate β such that the right amount of
penalization for the false negatives is provided.
For an imbalanced problem, the TP
rate
is usually
the most important. In (Chawla, 2006), the strategy
to follow in imbalanced problems is to maximize
recall (i.e. TP
rate
) while keeping precision under
control. (Grzymala et al, 2005) suggests that in
imbalanced problems more attention should be given
to sensitivity (TP
rate
) than to specificity (TN
rate
). This
is rather natural, since usually the TN
rate
is high
while the TP
rate
is low in such problems. Therefore
the goal is to increase the sensitivity, without
degrading of specificity.
We argue that the careful and correct selection of
the metric in imbalanced problems is essential for
the success of a data mining effort in such domains.
The metric should also reflect the goal of the
classification process, not just focus on the data
imbalance. Thus, if we are also dealing with
imbalance at the level of the error costs, then a cost-
sensitive metric should be more appropriate (e.g.
associate a cost parameter to the balanced accuracy
or geometric mean). If, on the other hand, we have
A COMPREHENSIVE STUDY OF THE EFFECT OF CLASS IMBALANCE ON THE PERFORMANCE OF
CLASSIFIERS
15

the interest in identifying both classes correctly, then
an equidistant metric, such as the geometric mean,
or balanced accuracy provides a fair estimation.
3 EVALUATION STRATEGY AND
THE ANALYSIS OF RESULTS
As concluded in (Japkowicz and Stephen, 2002), the
nature of the imbalance problem resides in more
than just the imbalance ratio (IR). Our set of
experiments tries to validate the statement on
benchmark problems.
In order to study the nature of the imbalance
problem, we have considered 32 data sets from the
UCI machine learning data repository (Table 1). A
number of problems were modified to obtain binary
classification problems from multi-class data. Also,
three of the relatively large datasets were under-
sampled to generate higher IR values (contain _IR in
their name). The complexity of each data set was
approximated, as suggested in (Japkowicz and
Stephen, 2002), to C = log
2
L, where L is the number
of leaves generated by the C4.5 decision tree learner.
Also, the values for IR, IAR and C have been
rounded.
Learning algorithms belonging to 6 different
classes were considered: instance based learning –
kNN (k Nearest Neighbor), Decision Trees – C4.5,
Support Vector Machines – SVM, Artificial Neural
Networks – MLP (Multilayer Perceptron), Bayesian
learning – NB (Naïve Bayes) and ensemble learning
– AB (AdaBoost.M1). We have employed the
implementation in the Weka framework for the six
methods selected, and their default parameter values.
The evaluations were performed using a 10-fold
cross validation loop, and reporting the average
values obtained. The following metrics were
recorded: the accuracy (Acc), TP
rate
, and TN
rate
.
Also, the geometric mean (GM), the balanced
accuracy (BAcc) and the Fmeasure (Fmeas) have
been computed. The minority class in all problems is
the positive class.
An initial analysis was carried out on the data
grouped by size, IR and complexity (C), into the
categories presented in Table 2.
Not all combinations of the three categories can
be found in the data sets we have evaluated: for
Table 1: Benchmark data sets employed in the experiments.
Datase
t
N
o.
Att.
N
o.
Inst.
IR IAR C Datase
t
N
o.
Att.
N
o.
Inst.
IR IAR C
Bupa 6 345 1 58 3 Ecoli_im_r
m
8 336 3 42 2
Haberman
_
1 4 367 1 92 3 Glass
_
NW 11 214 3 19 4
Cleve 14 303 1 22 5 Vehicle_van 19 846 3 45 4
Monk3 7 554 1 79 4 Chess_IR5 37 2002 5 54 5
Monk1 7 556 1 79 5 Segment_1 20 1500 6 75 3
Australian 15 690 1 46 5 Ecoli_imu 8 336 9 42 4
Crx 16 690 1 43 5 Se
g
ment
_
1
_
IR10 20 1424 10 71 3
Chess 37 3196 1 86 5 Tic-tac-toe
_
IR10 10 689 10 69 6
Mushrooms 23 8124 1 353 4 German_IR10 21 769 10 37 7
Breas
t
-cance
r
10 286 2 29 2 Sic
k
-euthyroi
d
26 3163 10 122 5
Glass
_
BWNFP 11 214 2 19 3 Glass
_
VWFP 11 214 12 19 3
Glass_BWFP 11 214 2 19 4 Sic
k
30 3772 15 126 5
Vote 17 435 2 26 3 Ecoli_bin 8 336 16 42 3
Wisconsin 10 699 2 70 4 Caravan 86 5822 16 68 11
Pima 7 768 2 110 4 Ecoli_im_r
m
8 336 3 42 2
Tic-tac-toe 10 958 2 96 7 Glass_NW 11 214 3 19 4
German 21 1000 2 48 7 Vehicle_van 19 846 3 45 4
Table 2: Dataset grouping on size, IR, C.
Dimension Category Very small Small
M
edium Large Very large
Size (no. of instances) <400 400-1500 2000-5000 >5000 -
Rounded IR - <9 - >=9 -
Rounded C - <=2 [3,4] [5,9] >=10
ICEIS 2011 - 13th International Conference on Enterprise Information Systems
16
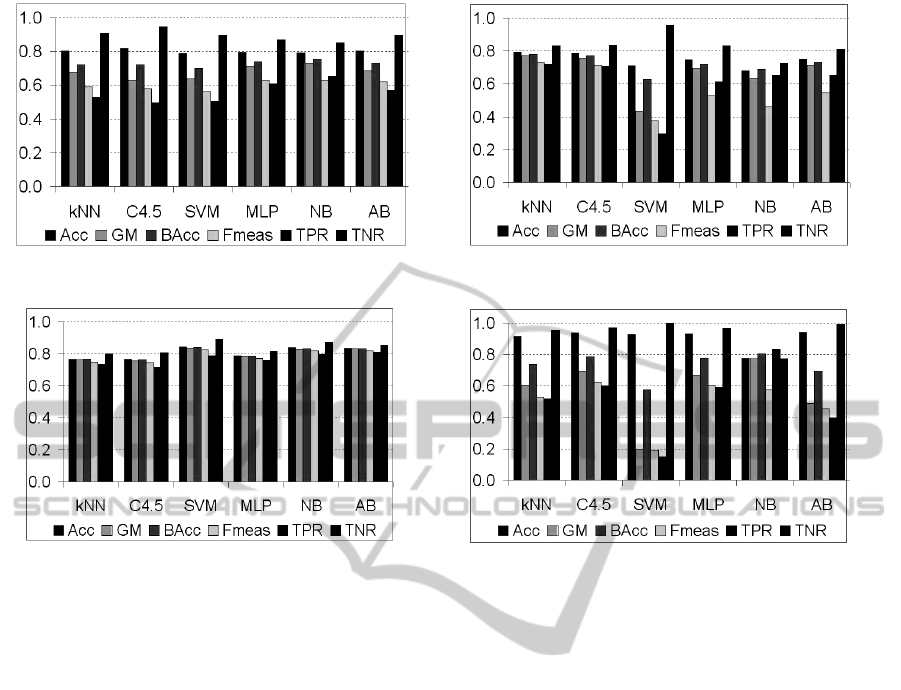
Figure 1: Size very small, IR<9, C small. Figure 2: Size very small, IR<9, C medium.
Figure 3: Size very small, IR<9, C large. Figure 4: Size very small, IR>=9, C medium.
example, a very large complexity is only represented
in the large data sets category. Table 3 presents a
summary of the results obtained by the learning
algorithms on the different categories of problems.
Shaded rows represent data categories sensitive to
imbalance, while non-shaded rows represent groups
of problems on which classifiers have a robust
behavior, under TP
rate
. We have selected this metric
to assess robustness since, as suggested in
(Japkowicz and Stephen, 2002), performance
degradation is related to a large drop in the TP
rate
.
Also, for each data set category we have marked the
best performance (bolded) and the worst
performance (underlined).
The results agree with the conclusions presented
in (Japkowicz and Stephen, 2002) that the value of
the IR plays an important role in the performance of
the classifiers. However, an increase in the
complexity does not necessarily lead to classifier
performance degradation: for very small datasets,
one would expect that a large complexity
significantly affects the capacity of classifiers to
achieve acceptable performance scores, even for
small IRs.
As it can be observed from Fig. 1 - 4, the
behavior of classifiers on large complexity data sets
is better than on categories of problems of smaller
complexity (in Fig. 3 almost all classifiers seem to
be robust to the imbalance problem). Still, for the
other set size categories (small, medium and large),
a large imbalance (IR>=9) associated with increased
complexity (large, large and very large, respectively)
always affects the learning process (Table 3).
The results suggest that neither data set size, nor
the complexity alone represent good (i.e. monotonic)
indicators of the IR's influence in the classification
process. We consider that poor concept
identification is related to the lack of information
caused by insufficient examples to learn from.
However, a relation between problem size,
complexity and classifier performance is revealed,
i.e. the larger the data set size, the higher the
complexity for which the performance degradation
becomes clear. This suggests the existence of
another meta-feature which better discriminates the
classifier robustness when faced with imbalanced
problems. Such a meta-feature, the instance per
attribute ratio (IAR), will be introduced shortly.
The diagrams in Fig. 5 - 7 present the
performance of the different classifiers, under
different metrics, on the problem categories which
affect their learning capacity. The accuracy alone is
not a good measure of performance. The analysis
should focus on the following criteria: high values
for TP
rate
, GM, BAcc and Fmeasure indicate a good
classification, while high TN
rate
values reveal a
A COMPREHENSIVE STUDY OF THE EFFECT OF CLASS IMBALANCE ON THE PERFORMANCE OF
CLASSIFIERS
17

Table 3: TPrates obtained by classifiers on the different categories of problems.
Set Size IR Complexit
y
kNN C4.5 SVM MLP
N
B AB
very small
<9
Small .53 .5 .5 .61 65 .57
M
edium .72 .71 .3 .61 .65 .65
Lar
g
e .73 .72 .79 .76 .8 .81
>=9
M
edium .52 .6 .15 .59 .83 .4
s
mall <9
M
edium .88 .89 .89 .9 .89 .83
Lar
g
e .81 .77 .85 .81 .62 .67
>=9
M
edium .98 .94 .98 .99 .98 .99
Large .24 .09 .47 .65 .09 .0
medium
<9 Lar
g
e .74 .97 .92 .98 .69 .85
>=9
M
edium .6 .91 .5 .86 .78 .89
Large .57 .88 .04 .73 .84 .82
large <9 Lar
g
e 111 1 .92 .98
>=9 Ver
y
Lar
g
e .06 .0 .01 .0 .39 .0
Figure 5: Size small, C large. Figure 6: Size medium, C large. Figure 7: Size large, C v. large.
classification which is biased towards the majority
class. Moreover, the larger the difference between
the TN
rate
and the TP
rate
, the more biased the
classification process is.
The results prove that the learning capabilities of
the classifiers considered are affected to some extent
by an increased imbalance in conjunction with the
other data-related particularities. It can be observed
that, like in (Japkowicz and Stephen, 2002), MLPs
are generally more robust than C4.5 to the imbalance
problem. Moreover, they are the least affected by the
imbalance-related factors, in most cases. As an
exception, C4.5 performs noticeably better than
MLP (and all the others, actually) on medium sized
datasets, with large IR and C (Fig. 6).
The analysis also reveals that the NB classifiers
have a good general behavior when dealing with a
very large imbalance. In some cases they even yield
the best performance (Fig. 1, 4, 7 – all with IR>=9).
However, they are not as robust as MLPs, since, in
some cases, they achieve a very poor performance
(Fig. 5). Although not always the best classifier,
MLPs yield at least the second best performance in
all cases, which makes them the most robust out of
all the classifiers evaluated. None of the kNN and
AB show remarkable results in any of the cases
studied, which makes them suitable only for baseline
problem assessment.
The above observations provide an affirmative
answer to one of the open questions in (Japkowicz
and Stephen, 2002), whether the conclusions
presented there can be applied to real-world
domains. However, our results also indicate that
SVM are the most sensitive to imbalance. This
means that, for the particular case of SVMs, the
conclusion drawn from experiments on artificial data
cannot be extended to real data sets. A justification
for this could be the following: in the case of
artificial data sets, even for large IRs, the examples
which represent reliable support vectors are present
in the data, due to the systematic data generation
process, while in the case of real problems, these
vital learning elements might be missing. This
makes SVMs the weakest classifiers in most real-
world imbalanced problems.
We have performed a second analysis for
studying the effect of imbalanced problems on the
performance of the classifiers, using another data set
grouping: by IR and by the ratio between the number
of instances and the number of attributes (IAR). We
consider this new meta-feature successfully
combines size and complexity information: a small
IAR should yield a higher classifier sensibility to the
ICEIS 2011 - 13th International Conference on Enterprise Information Systems
18
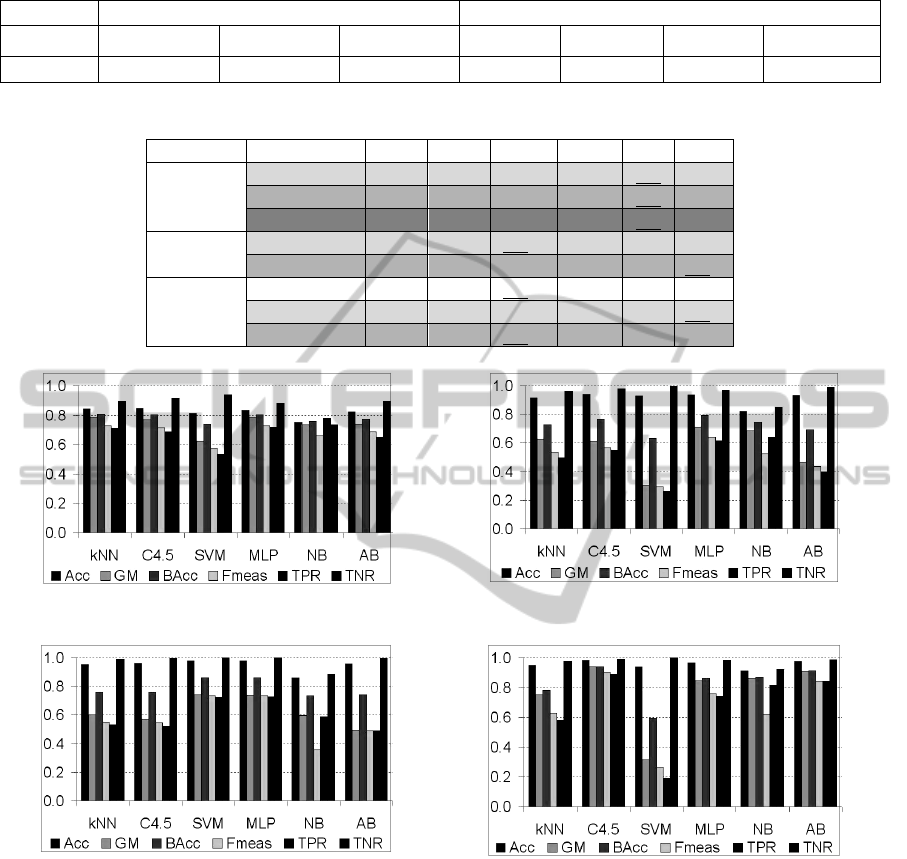
Table 4: Dataset grouping on IR, IAR.
Cate
g
or
y
Rounded IR Rounded IAR
T
y
pe Balanced IR Small IR Large IR Small Mediu
m
Large Very large
Value 1 [2,3] >=4 <=60 (60,110] (110,200] >200
Table 5: TPrates GM scores on IR and IAR grouping.
IR IAR kNN C4.5 SVM MLP
N
BAB
Balanced Small .68 .71 .72 .7 .58 .75
M
edium .94 .95 .8 .86 .78 .85
Ver
y
lar
g
e 1 1 1 1 .92 .98
Small Small .71 .69 .53 .72 .78 .65
M
edium .81 .77 .82 .83 .67 .63
Large
Small .5 .55 .27 .62 .64 .4
M
edium .53 .52 .72 .73 .59 .49
Lar
g
e .58 .89 .19 .74 .82 .84
Figure 8: IR small imbalance, IAR small. Figure 9: IR large, IAR small.
Figure 10: IR large, IAR medium. Figure 11: IR large, IAR large.
imbalance problem, while a very large IAR should
provide more robustness to the imbalance. The
categories for this second analysis are summarized
in Table 4.
By re-grouping the evaluations according to this
new criterion, we noticed a more clear separation
between the different categories and that classifiers
better learn with larger IARs. Indeed, as we can
observe from Table 5, the larger the IAR, the larger
the IR for which the TP
rate
value of the classifiers
decreases. Also, for the same IR, as IAR increases,
classifiers are more robust to the imbalance. The
different levels of shading used for the rows indicate
the performance level (more shading, better average
performance). Again, we have marked the highest
and lowest TP
rate
values for each problem category
(bolded and underlined, respectively).
Fig. 8 – 11 present the performance of the
classifiers under this second categorization, for all
metrics considered, on the relevant groups (problems
which are affected the most by the imbalance related
issues). The diagrams indicate again that SVM are
unstable classifiers for imbalanced problems
(strongly biased towards the majority class). Out of
all classifiers, MLP are the most robust, yielding
either the best or second best performance. The NB
A COMPREHENSIVE STUDY OF THE EFFECT OF CLASS IMBALANCE ON THE PERFORMANCE OF
CLASSIFIERS
19
0
0.2
0.4
0.6
0.8
1
110100
log (IR )
BAcc
C4.5 pruned, C =0.25 C4.5unpruned
0
0.2
0.4
0.6
0.8
1
110100
log (IR)
GM
C4.5 pruned,C =0.25 C4.5unpruned
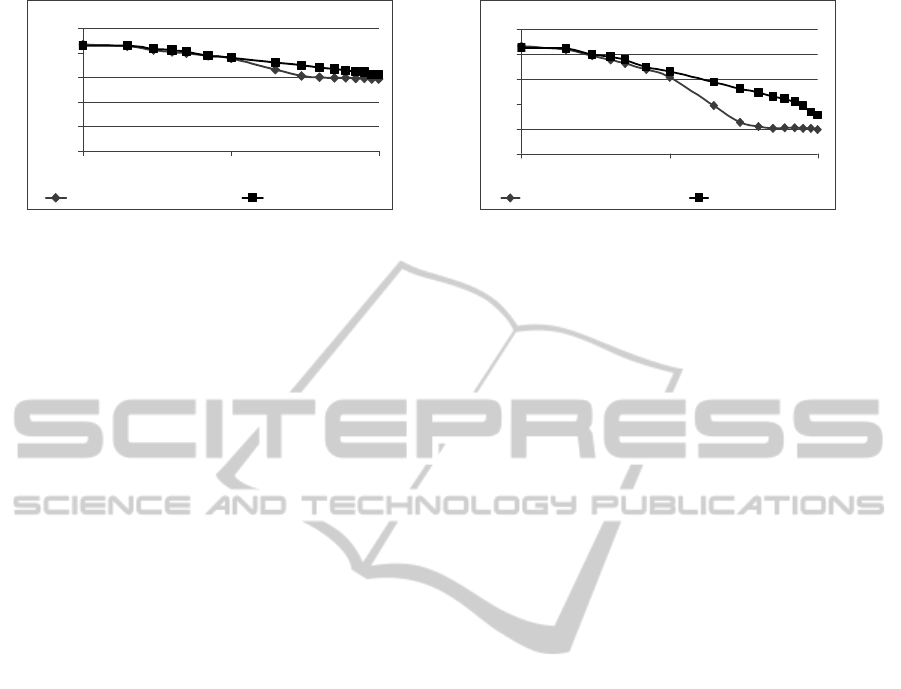
Figure 12: Performance degradation for C4.5 on mushrooms data set, under the balanced accuracy (BAcc) and the
geometric mean (GM).
classifier generally achieves the best recognition of
the minority class (maximum TP
rate
).
However, it is not the best classifier due to poor
recognition of the majority class (lowest TN
rate
in all
cases). This makes the NB classifier the most
appropriate for imbalanced problems in which the
minority class possesses a significantly larger
importance than the majority class. Similar to the
previous analysis, kNN and AB have a variable
behavior, which hinders the identification of a
situation in which they could guarantee quality
results. If we have found that a large IAR improves
the behavior of classifiers for the same IR, it appears
that C4.5 is the most responsive to a large IAR, as it
can be observed from Fig. 11. All the above
measurements refer to pruned versions of C4.5.
In (Japkowicz and Stephen, 2002), it is argued
that, for large IRs, unpruned C4.5 models are better
than the pruned versions. We have performed an
evaluation to validate this statement, using the
mushrooms problem – large size, balanced data set –
by varying the IR up to 100. The evaluation was
performed in a 10-fold cross validation loop. The
results are presented in the diagrams from Fig. 12.
We have employed the logarithmic scale for the x
axis (IR), to better differentiate between the two
curves at smaller IRs. By comparing the two
diagrams we notice that GM is more fitted for this
situation, as it is more realistic in estimating the
performance (BAcc being overoptimistic), and it
better differentiates between the pruned/unpruned
versions. This is due to the fact that a larger
difference between two variables is more visible in
the product than the sum of their values. This makes
GM a better metric than BAcc in imbalanced
problems.
Also, as IR increases, pruning deteriorates the
performance of the decision tree model. This result
supports the statement in (Weiss, 2004), that pruning
might eliminate rare and important cases, thus
affecting the correct identification of the minority
class. However, no pruning at all results in an
increase of complexity for the majority class as well,
which might lead to overfitting in that area. A more
sophisticated approach is therefore required for
imbalanced domains, an intelligent pruning
mechanism, which adjusts the level of pruning for
branches according to the number of minority cases
they contain.
4 ONGOING WORK
We are currently focusing on three approaches for
dealing with the class imbalance problem. A first
approach is an intelligent pruning mechanism which
allows the reduction of the branches which predict
the majority class(es), while branches corresponding
to the minority class are pruned proportionally with
the number of examples they cover (i.e. less
examples imply less pruning). This could be done in
correlation with the change of the threshold which
identifies a class in favour of the minority class. This
method is currently under development.
A second approach, which is currently under
experimental validation, is a general method for
improving the performance of classifiers in
imbalanced problems. It involves the identification
of an optimal cost matrix for the given problem and
the selected evaluation metric. The matrix is then
employed in conjunction with a cost-sensitive
classifier in order to build a more efficient
classification model, focused on better identifying
the underrepresented/interest cases. The experiments
performed so far have shown that the method indeed
improves the behavior of the classifiers, reducing
their bias towards the majority class. Comparative
evaluations with sampling methods are currently
under development.
Another focal point of our current research
efforts is to identify the optimal distribution for
learning and employ sampling and ensemble
ICEIS 2011 - 13th International Conference on Enterprise Information Systems
20

learning mechanisms to generate several classifiers
which employ voting to provide a classification.
5 CONCLUSIONS
Starting from the observation that when dealing with
IDS there is no winner strategy for all data sets
(neither in terms of sampling, nor algorithm), special
attention should be paid to the particularities of the
data in hand. In doing so, one should focus on a
wider context, taking into account several factors
simultaneously: the imbalance rate, together with
other data-related meta-features, the algorithms and
their associated parameters.
Our experiments show that, in an imbalanced
problem, the IR can be used in conjunction with the
data set dimensionality and the IAR factor, to
evaluate the appropriate classifier that best fits the
situation. Moreover, a good metric to assess the
performance of the model built is important; again, it
should be chosen based on the particularities of the
problem and of the goal established for it.
When starting an evaluation, we should begin with
the imbalanced data set and the MLP, as it proved to
be the best classifier on every category we have
evaluated on imbalanced data sets. In case the
training time with MLP is too large, the second best
choice is either the decision tree with C4.5 (without
pruning would be better as IR increases), or NB. In
terms of evaluation metrics, the choice should be
based on the data particularities (i.e. imbalance), but
also on the goal of the classification process (are we
dealing with a cost-sensitive classification or are all
errors equally serious?).
ACKNOWLEDGEMENTS
The work for this paper has been supported by
research grant no. 12080/2008 – SEArCH, founded
by the Ministry of Education, Research and
Innovation.
REFERENCES
Barandela, R., Sanchez, J. S., Garcia, V., Rangel, E.
(2003). Strategies for Learning in Class Imbalance
Problems. Pattern Recognition. 36(3). 849--851
Batista, G.E.A.P.A., Prati, R. C. Monard, M. C. (2004). A
Study of the Behavior of Several Methods for
Balancing Machine Learning Training Data, 20—29
Brodersen, K.H., Ong, C.S. ,Stephen, K.E. and Buhmann,
J.M. (2010). The balanced accuracy and its posterior
distribution. Proc. of the 20th Int. Conf. on Pattern
Recognition. pp. 3121–3124
Cieslak, D. A., Chawla, N. V., Striegel, A. (2006).
Combating Imbalance in Network Intrusion Datasets.
In: Proceedings of the IEEE International Conference
on Granular Computing. 732--737
Chawla, N. V., Bowyer, K. W., Hall, L. O., Kegelmeyer,
W. P. (2002). SMOTE: Synthetic Minority Over-
Sampling Technique. Journal of Artificial Intelligence
Research, 16:321--357
Chawla, N. V. (2006). Data Mining from Imbalanced Data
Sets, Data Mining and Knowledge Discovery
Handbook, chapter 40, Springer US, 853--867
Cohen, G., Hilario, M., Sax, H., Hugonnet, S.,
Geissbuhler, A. (2006). Learning from Imbalanced
Data in Surveillance of Nosocomial Infection.
Artificial Intelligence in Medicine, 37(1):7--18
Garcia, S., Herrera, F. (2009). Evolutionary
Undersampling for Classification with Imbalanced
Datasets: Proposals and Taxonomy, Evolutionary
Computation 17(3): 275--306
Grzymala-Busse, J. W., Stefanowski, J., Wilk, S. (2005).
A Comparison of Two Approaches to Data Mining
from Imbalanced Data. Journal of Intelligent
Manufacturing, 16, Springer Science+Business Media,
65--573
Guo, H., Viktor, H.L. (2004). Learning from Imbalanced
Data Sets with Boosting and Data Generation: The
DataBoost-IM Approach, Sigkdd Explorations.
Volume 6, 30—39
Huang, K., Yang, H., King, I., and Lyu, M. R. (2006).
Imbalanced Learning with a Biased Minimax
Probability Machine. IEEE Transactions on Systems,
Man, and Cybernetics, Part B: Cybernetics, 36(4):
913--923
Japkowicz, N., Myers, C. and Gluck, M. A. (1995). A
Novelty Detection Approach to Classification. IJCAI :
518--523
Japkowicz, N., and Stephen, S. (2002). The Class
Imbalance Problem: A Systematic Study. Intelligent
Data Analysis Journal. Volume 6: 429--449
Weiss, G., and Provost, F. (2003). Learning when Training
Data are Costly: The Effect of Class Distribution on
Tree Induction. Journal of Artificial Intelligence
Research 19, 315--354
Weiss, G. (2004). Mining with Rarity: A Unifying
Framework, SIGKDD Explorations 6(1), 7--19
Woods, K., Doss, C., Bowyer, K., Solka, J., Priebe, C.,
Kegelmeyer, P. (1993). Comparative Evaluation of
Pattern Recognition Techniques for Detection of
Microcalcifications in Mammography. Int. Journal of
Pattern Rec. and AI, 7(6), 1417--1436
A COMPREHENSIVE STUDY OF THE EFFECT OF CLASS IMBALANCE ON THE PERFORMANCE OF
CLASSIFIERS
21
