
INTELLIGENT TRANSPORTATION SYSTEMS DATA
WAREHOUSES AND THEIR APPLICATIONS
Yunjie Zhao
1
, Madhubabu Sandara
2
, Shan Huang
1
, Adel Sadek
1
1
Department of Civil, Structural, and Environmental Engineering, University at Buffalo, SUNY, Buffalo, NY, U.S.A.
2
Department of Computer Science and Engineering, University at Buffalo, SUNY, Buffalo, NY, U.S.A.
Tom George, Athena M. Hutchins
Niagara International Transportation Technology Coalition (NITTEC), NY, U.S.A.
Keywords: ADMS, ITS data warehouse, Applications.
Abstract: Archived Data Management Systems (ADMS) offers an opportunity to take full advantage of the data
collected by Intelligent Transportation Systems (ITS) devices in improving transportation operations and
planning at a minimal additional cost. This paper develops an ITS data warehouse, or an ADMS, which can
be used to a wide range of applications, such as more effective transportation planning, decision-making and
performance measurement, extreme traffic event study, traveller information subscriber system, data
support for model development, calibration and validation and so forth. In short, the development of such a
data warehouse is going to be beneficial for both traffic management and research purposes.
1 INTRODUCTION
On a worldwide scale, transportation accounts for
about 21% of CO
2
emissions, with surface
transportation representing the largest source
accounting for more than 90% of the CO
2
emissions
produced from all transportation modes (Gorham,
2002; EEA, 2003).
Among the strategies being explored for
improving traffic conditions, and hence reducing
energy consumption and harmful emissions, are
those falling under the umbrella of Intelligent
Transportation Systems (ITS) technologies. The
basic philosophy behind ITS is to take advantage of
recent advances in information technology,
communications, and advanced computing to
improve efficiency, safety and environmental
compatibility. The focus of this paper is on one
specific ITS application, namely Archived Data
Management Systems (ADMS).
Our data warehouse mainly focuses on the
Niagara Frontier Corridor, the border region that
encompasses the Niagara River border crossings. In
Western New York, it represents a strategic
international gateway or corridor of critical
importance to trade and tourism flow between the
United States and Canada. According to the
Canadian Consulate General of Buffalo,
approximately 30% of the total Canada-US trade
crosses at the Niagara border, along with millions of
immigrants and tourists every year. A report by the
Ontario Chamber of Commerce (OCC) in 2005 puts
the value of the annual land-borne merchandise
crossing the Buffalo-Niagara Frontier border at
$60.3 billion dollars (OCC, 2005).
An archived data warehouse is an invaluable
asset for the transportation systems in Niagara
Frontier corridor, not only for research purposes, but
also for traffic management. It supports several
applications for improving mobility, sustaining
economic development, reducing fuel consumption
and minimizing emissions.
Archived Data Management Systems (ADMS)
offer an opportunity of take full advantage of the
travel-related data collected by Intelligent
Transportation Systems (ITS) devices in improving
transportation operations, planning and decision-
making at a minimal additional cost. ADMS are
designed to archive, fuse, organize and analyze ITS
data and can therefore support a wide range of multi-
layer applications. Examples of such applications
include:
343
Zhao Y., Sandara M., Huang S., Sadek A., George T. and M. Hutchins A..
INTELLIGENT TRANSPORTATION SYSTEMS DATA WAREHOUSES AND THEIR APPLICATIONS.
DOI: 10.5220/0003431503430347
In Proceedings of the 13th International Conference on Enterprise Information Systems (ICEIS-2011), pages 343-347
ISBN: 978-989-8425-53-9
Copyright
c
2011 SCITEPRESS (Science and Technology Publications, Lda.)

(1) Developing more effective operational
strategies (e.g. optimizing traffic signal);
(2) Planning for operations and special events
(e.g. inclement weather and snow storms);
(3) Enhancing traveller information systems by
providing the added capability of forecasting
future conditions, e.g. border crossing delay
estimation;
(4) Long-term planning and transportation
investment decision-making;
(5) Performance measurement benchmarking and
reporting.
Given this, an ITS data warehouse is a key
component of any integrated corridor management
(ICM) approach.
2 LITERATURE REVIEW
The idea of developing ADMS or ITS data
warehouse have been officially proposed since 1996
(ADUS Program, 2000; Liu et al, 2002), though the
concept itself has been existing for even longer time.
Initially, research studies were conducted, aiming at
developing standards and guidelines for developing
such system. These studies resulted in suggesting
best practices for: (1) data archiving and fusion; (2)
data screening and imputation techniques; (3) data
modelling and mining methods; (4) archived data
functions and applications; and (5) data presentation
and dissemination techniques, among many other
aspects (FHWA, 2009).
Following these research initiatives, several
states in the United States took leading roles in
implementing ITS data warehouses. For instance, in
Maryland, one major objective of the University of
Maryland’s Center for Advanced Transportation
Technology Laboratory (CATT Lab) is to serve as
an AMDS system to meet different data needs from
national, state, and local levels (CATT Lab, 2009).
In Kentucky, an ADMS has been developed to
archive and disseminate the data collected by two
ITS deployment, i.e. ARTIMIS and TRIMARC
(Chen and Xia, 2007).
With respect to the development and applications
of ADMS or ITS data warehousing systems, the
State of New York has lagged behind other states
around the country.
For example, in the Greater Buffalo‐Niagara
area, key traffic data such as traffic counts, travel
time, accidents, and border crossing delays are
separately collected and maintained by different
transportation organizations, and no formal data
integration and archiving mechanism currently exists
due to institutional, technical or budget barriers. This
situation hinders the full realization of the utility of
ITS data for transportation operations, management
and evaluation.
3 ITS DATA WAREHOUSE
3.1 Architecture
Figure 1: Data warehouse structure.
Figure 1 above shows an overview of the ITS data
warehouse for the Niagara Frontier Corridor. As can
be seen, the data warehouse is envisioned to serve as
a data repository for a wide range of useful
traffic‐related data streams. Those data are
transferred, processed and archived in the data
warehouse, where the end users are able to perform
a one-stop data query to retrieve the data they are
interested in. So far, the ITS data warehouse system
has archived or is planning to archive the following
data and data sources soon:
Traffic volume on major arterial and freeway
with hourly interval;
Incident data maintained by NITTEC, namely
Incident log and help log which contain
information about the incident location, start
time, end time and so forth;
Weather data (e.g. temperature, Hourly
precipitation, visibility, etc.);
Turning movement counts at major
intersections;
Travel Time Data from the TRANSMIT
ICEIS 2011 - 13th International Conference on Enterprise Information Systems
344
system, which uses roadside readers to
identify EZ pass or toll tags;
Border crossing delay (delay time of US-
Canada border);
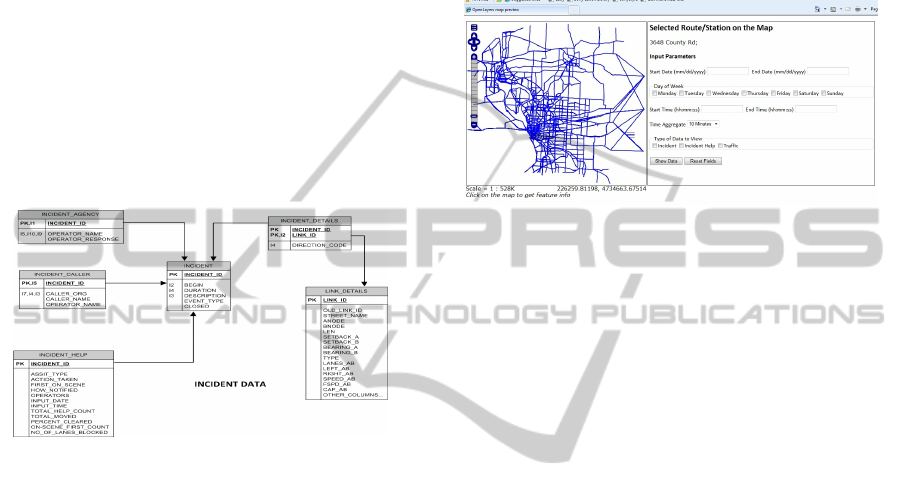
3.2 Star Schema
Most of the data are stored as the classic STAR
Schema. This is because the primary referencing
system used within the data warehouse is link based,
which means that most of the data, except some
node–based data like intersection turning
movements, could be related to a certain link. For
instance, when an accident happens, the incident log
and help log would record its location and this
location is joined to the specific link in the data
warehouse as Figure 2 shows.
Figure 2: Star Schema for incident log.
3.3 Data Import
Since the data warehouse is archiving a wide range
of data resources, each using a different kind of
format (e.g. XML, spreadsheets and so forth), a
standard procedure for importing and archiving all
of these data streams into the database was needed.
The import process was designed to
automatically extract raw data into the archived
format on a regular basis. For example, NITTEC
would dump the incident XML files onto the server
everyday via a scheduled script; our program detects
the new files, process them and archive all the
information into the data warehouse. All of these
processes can be done via the scheduled batch files.
3.4 User Interface
The user interface of the data warehouse connects
the database and the end user. So far, a simple web
interface, implemented using GeoServer in order to
provide for a geographic map for users to select
graphically the route segment they are interested in,
if provided. (Figure 3) The interface supports the
following services: historical data query, traffic data
on selected roads (Travel times, volume), real-time
travel time and incident mapping and so forth. Other
functionality will be developed according to the
demand of the users. End users could click the query
routes they are interested in, and select the specific
type of data they are looking for as well as favourite
time slot.
Figure 3: the user interface window.
4 APPLICATIONS
4.1 Transportation System
Performance Measurement &
Management
First of all, a comprehensive network performance
measurement system could be developed based on
the travel time, border delay and other traffic data
archived in the data warehouse. In other words,
transportation agencies like NITTEC could use the
measurement system to better communicate the
“state” of the transportation system to the public and
policy makers. Moreover, these performance
measures indices can be used to identify potential
issues in the current system, and thus help the
transportation agencies to develop effective
operational and management strategies to improve
mobility and reliability of the transportation system.
Secondly, traffic signal optimization could be
conducted with the data archived in the systems.
Several recent studies of signal optimization and
coordination show reductions in the number of
vehicle stops, as a result, ranging from 6 to 74%,
with the magnitude varying depending upon the
congestion level (Sunkari, 2004). Studies also show
that reducing the number of vehicle stops could have
significant positive environmental impacts.
In addition, the archived data could be mined to
gain useful insight into the transportation system
performance and its problems. For example, a report
could be generated to provide a summary of the
frequency and time slots of the incidents on a certain
INTELLIGENT TRANSPORTATION SYSTEMS DATA WAREHOUSES AND THEIR APPLICATIONS
345

routes, and to study whether there is any common
factor among them. Besides, one could study the
impact that incidents have on the transportation
system performance, and how long it typically takes
to clear incidents, and bring operations back to
normal.
Other than the applications aforementioned, we
are currently performing a research study to develop
predictive models for border crossing delays.
4.2 Extreme Traffic Events
The Greater Buffalo Niagara region is well known
for its winter weather which is characterized by
numerous and sometimes severe ‘lake-effect’ snow
storms. These events result in significant delay and
increase the frequency of accidents. The data stored
within the data warehouse can provide an
opportunity to better understand the impact of such
events on the transportation network, and hence can
help in devising emergency plans for dealing with
such disrupting events.
The Transportation Analysis and Simulation
System (TRANSIMS) is an integrated, open-source
set of transportation planning models designed to
provide a number of capabilities that go beyond the
traditional “four-step” modelling process. The
TRANSIMS framework has four components: a
population synthesizer, an activity generator, a route
planner, and a micro-simulator. Also, the area has
recently been selected as one among a handful sites
nationwide for the test deployment of the
TRANSIMS model, focusing on freight border-
crossing issues.
On Dec 2nd, 2010, for example, a severe snow
storm hit the south Buffalo area, which forced the
New York State Thruway Authority to shut down
the Thruway (I-90) for several hours.
The data stored can thus be used to study how
traffic flow behaviour and patterns change during
such events, and then to devise effective
management strategies for dealing with such
situations. We are currently in the process of
correlating the archived weather data to TRANSMIT
travel time information to perhaps develop models
that show us how travel time or traffic speed
changes with the different weather and road
conditions
4.3 Traveller Information System
In a related effort, we developed a system called
MYNITTEC, which is a personalized subscriber
traveller information system that allows users to
receive customized real-time traveller information in
Western New York and Southern Ontario via text
messaging and/or email. Subscribers have the ability
to select specific expressways, days of the week and
times of day to correspond with your travels.
The way MYNITTEC works is simple. Users
choose their favourite routes and time spots as their
unique travel profiles. Each travel profile allows the
user to receive personalized notifications from the
system. The data warehouse could help enhance the
traveller information system by providing both
predictive information and more detailed route
performance measurement. On the other hand,
MYNITTEC collects some useful information about
travellers in the Western New York region (e.g. their
preferred routes, times of travel). This information
will also be stored within the data warehouse and
can be mined to understand certain aspects of travel
behaviour in the region.
4.4 Model Development, Calibration
& Validation
4.4.1 Model Development
Aside from the traffic data archived in the data
warehouse (i.e. traffic volumes, travel times,
accidents, etc.), the data warehouse also includes
very useful static information about the attributes of
the transportation network. For example, the system
has stored very detailed link attributes, like the
number of lanes, pocket lane, length of the links and
so forth, which provides an opportunity to automate
and facilitate the process of developing traffic
simulation models to support the different traffic
studies in the region.
As we know, there are all kinds of simulation
models, such as AIMSUN, CORSIM, PARAMICS,
VISSIM and so forth. Although some of them are
macroscopic model, some are mesoscopic or
microscopic model. One thing they have in common
is that they all require a network to build the model
on, although they all have their own network file
format. Therefore, another direct application of data
warehouse is the model development based on the
network information we’ve already archived. In
other words, if we are able to transfer the network
information into the format a simulation software
could read, it could make model development a lot
easier instead of an extremely time consuming
process especially for large-scale networks.
ICEIS 2011 - 13th International Conference on Enterprise Information Systems
346

4.4.2 Model Calibration & Validation
After a simulation model is built, large volumes of
data are required to calibrate and validate the
simulation results. In that regard, the ITS data
warehouse plays a significant role as a data provider.
We are actually currently doing exactly this in a
research project to develop and calibrate a large-
scale TRANSIMS model, an agent-based model
originally developed by Los Alamos National Lab,
of the Buffalo-Niagara region. Within the subarea
we are modelling in TRANSIMS Micro-simulator in
TRANSIMS, there are 193 count stations. The
following example is to just give a simple idea how
the data warehouse could benefit us. We
summarized the 24-hr trip distribution based on all
of those count stations between the model and
reality (Figure 4).
After the calibration
Figure 4: Trip Distribution of TRANSIMS model and field
counts after the calibration.
5 CONCLUSIONS
The archived ITS data warehouse for the Niagara
Frontier Corridor supports a wide range of
applications designed to improve mobility, sustain
economic development and reduce fuel consumption
and emissions. The benefits associated with the
different applications of the data are detailed below:
The data archived in the system support the
development of a comprehensive
performance measurement framework for the
area, especially for the international border
crossings, and their associated delays. The
data warehouse could also support signal
optimization, which not only improves the
transportation system, but also reduces the
tail-pipe emission as well as fuel consumed ;
The data warehouse provides traffic data and
weather information to better understand the
impact of the extreme events like inclement
weather on the traffic and driving behaviour;
The data can also enhance traveller
information systems in the region by adding a
predictive component to the traffic data
provided;
The warehouse can also support the
development and calibration of traffic
simulation models; and The Niagara Frontier
ITS data warehouse could serve as a model
deployment for other regions around the State
of New York, which would benefit from the
lessons learnt from this study.
REFERENCES
CATT Lab (2009). CATT Laboratory, A Research Center
at the University of Maryland, College Park. http://
www.cattlab.umd.edu/index.php?page=about. Last
access: September 15, 2009.
Chen, M., and J. Xia (2007) “Archived Data Management
System in Kentucky.” Kentucky Transportation
Center; Kentucky Transportation Cabinet; and Federal
Highway Administration. 39p.
Data mining, http://en.wikipedia.org/wiki/Data_mining
Eng-Wong Taub Associates, MRC, Bergmann Associates,
and TranSystems (2009) NITTEC Transportation
Operations: System Operational Concept, Draft
Technical Memorandum #6. 50p.
European Environment Agency (EEA). (2003).
Greenhouse gas emission trends and projections in
Europe 2003, Tracking progress by the EU and
acceding and candidate countries towards achieving
their Kyoto Protocol targets. Environmental issue
report no. 36, ISBN 92-9167-632-2, EEA,
Copenhagen.
Federal Highway Administration (FHWA) (2009).
Archived Data User Service (ADUS) Program
Activities. http://www.fhwa.dot.gov/policy/ohpi/tra
vel/adus.cfm. Last access: September 15, 2009.
Gorham, R. (2002). Air pollution from ground
transportation an assessment of causes, strategies and
tactics, and proposed actions for the international
community. The Global Initiative on Transport
Emissions. A Partnership of the United Nations and
the World Bank, United Nations.
Liu, H., R. He, Y. Tao, and B. Ran (2002). A Literature
and Best Practices Scan: ITS Data Management and
Archiving. Wisconsin Department of Transportation.
Sunkari, Srinivasa. “The Benefits of Retiming Traffic
Signals,” ITE Journal. April 2004. Costs ID: 2007-001
16
INTELLIGENT TRANSPORTATION SYSTEMS DATA WAREHOUSES AND THEIR APPLICATIONS
347
