
INTERACTIVE COMPONENT VISUALIZATION
Visual Representation of Component-based Applications
using the ENT Meta-model
Jaroslav
ˇ
Snajberk and P
ˇ
remek Brada
Department of Computer Science and Engineering, Faculty of Applied Sciences, University of West Bohemia
Pilsen, Czech Republic
Keywords:
Component, Visualization, UML, Meta-model, Views, Content-aware.
Abstract:
UML is considered to be a universal solution for diagramming any application, but UML also has its short-
comings. It needs several diagrams to describe one problem, it cannot create different views on one diagram
and it is not interactive. This leads to hours spent drawing the same thing from different views, any change
has to be applied several times and the author of a UML diagram has to balance between good readability
and providing a sufficient amount of information. In particular, the UML component diagram has insufficient
expressive power to capture all the facts of even today’s component models and architectures. In this paper, we
propose a visualization aimed at modular and composed architecture that is content-aware, so it can present
the model of component-based architecture in different ways, depending on user needs. By default, it presents
minimum information to reduce cognitive load and keep the diagrams comprehensible, while making the ad-
ditional information available when the user needs it. This paper thus suggests a possible substitute for UML
in the domain of component-based applications.
1 INTRODUCTION
Many component-based applications are developed
on rather different component frameworks. Compo-
nent models like EJB (Sun Microsystems, Inc., 2001),
CORBA (Object Management Group, 2006a), OSGi
(OSGi Alliance, 2009) and more can be found in com-
mercial applications and even more component mod-
els – for example, SOFA (Bures et al., 2006), Fractal
(Merle and Stefani, 2008) and CoSi (Brada, 2008) –
are the subject of research.
The diversity of component models and even un-
derstandings of what actually is a component lead to a
very broad definition of component itself (Szyperski,
2002):
“A software component is a unit of compo-
sition with contractually specified interfaces
and explicit context dependencies only. A
software component can be deployed indepen-
dently and is subject to composition by third
parties.”
In such an environment, where component mod-
els have so little in common and can have so many
different characteristic features, component architects
and assemblers stand before these choices of how to
visualize the structure of their component-based ap-
plications:
1. Create a component model-specific visualization;
2. Use a general “boxes-and-arrows” visualization.
A component model’s specific visualization has to
introduce its own graphic notation to be able to vi-
sualize the specifics of the component model (only
a few component models already have one like, e.g.,
SaveCCM (Hansson et al., 2004)). This results in the
need to learn this notation by every developer in order
to use it and this approach complicates the exchange
of diagrams between different domain experts.
A general “boxes-and-arrows” visualization is, on
the other hand, useful for exchange of diagrams be-
tween domain experts, but it provides only a few spe-
cific details about components and thus it can only
provide a shallow understanding of the component-
based application. UML 2.0 (Object Management
Group, 2009) is a common example of this general
visualization.
218
Šnajberk J. and Brada P..
INTERACTIVE COMPONENT VISUALIZATION - Visual Representation of Component-based Applications using the ENT Meta-model.
DOI: 10.5220/0003436902180225
In Proceedings of the 6th International Conference on Evaluation of Novel Approaches to Software Engineering (ENASE-2011), pages 218-225
ISBN: 978-989-8425-57-7
Copyright
c
2011 SCITEPRESS (Science and Technology Publications, Lda.)

1.1 Problem Definition
For better usability, UML 2.0 supports extensions in
the form of profiles which can offer a customiza-
tion of the general “boxes-and-arrows” able to capture
enough details about the structure of the application
on a general level. This customization is adequate for
most of the needs present in component models and
has been verified on several component models.
The problem is that UML doesn’t fulfill some of
the needs of component-based development, which
would speed up and improve the orientation and uder-
standing of the structure of the component-based ap-
plication. These needs can be summarized as follows:
• In component-based development, there are roles
with very different interests and needs (developer,
assembler, etc.). UML uses a diagram for every
role in order to provide the exact amount of detail
for each of them.
• Stereotypes, which are the power of the UML ex-
tension mechanism, behave more like tags – they
only say that the attribute or method belongs to
some group. But component-based development,
because of its diversity, needs a mechanism to
model new types of elements apart from attributes
and methods. Ideally, the model should provide
some meta-information to improve orientation in
the elements of the component.
• UML was designed to be static, to show all infor-
mation at once and provide the same output both
on screen and paper. However, when component
assembler works with hundreds of components,
he needs to keep orientated in a complex “boxes-
and-arrows” diagram, accessing levels of detail on
demand interactively.
• Similar to the previous point, but closer to im-
plementation, when component architect looks on
the components, he may be interested in the exis-
tence of all the elements, but he doesn’t want to
be bothered with the details about these elements.
1.2 Proposed Solution and Paper
Structure
In order to address these needs, we propose an ap-
proach alternative to UML that will be built on a new
meta-model of component-based applications. We
chose to use new meta-model, instead of modifying
the UML meta-model, because it enables us to create
a clean solution just for the purpose of visualizing the
structure of a component-based application interac-
tively. The reasons for and details of the meta-model
are discussed in (Snajberk and Brada, 2011).
This new meta-model will help us to address the
first two problems discussed in the previous section,
because it allows one to model any kind of component
interface element and introduces user-defined groups
of elements, so-called Traits. More about the clas-
sification and the ENT meta-model can be found in
Section 3.
The key to understanding complex systems is sim-
plicity and cleanness, because then the user can eas-
ily see a whole picture. This simplicity has to be bal-
anced with sufficient information provided by a single
component. We achieve this balance by visualizing
all elements but hiding all supplementary information
until the user requests it by interaction with the di-
agram. We call this an interactive visualization and
describe its details in Section 4, with a discussion of
its usage in Subsection 4.7.
The paper is concluded with an overview of fu-
ture research and a summary of the contributions pre-
sented.
2 RELATED WORK
Jean-Marie Favre describes the needs of visualization
of component-based systems in (Favre and Cervantes,
2002); in his previous work (Favre et al., 2001), he
covered the topic of reverse engineering of huge soft-
ware systems. In these articles, he also mentions two
visualization tools: Generic Software Exploration En-
vironment (GSEE) and Object Modeler Visualization
Tool (OMVT). However, these tools are out of date
and there is no sequel to this research.
The research group around Alex Telea at the Uni-
versity of Eindhoven is working on advanced visu-
alization styles that help to understand and analyze
software. As examples of their work, we can mention
(Telea and Voinea, 2004) which provides a new way
to differently look on extensive component-based sys-
tems and (Byelas and Telea, 2006), which describes
the extension of UML by using metrics and highlight-
ing areas of interest. While the first work is highly
abstract and far from well-arranged diagrams, the sec-
ond work is very interesting for future development of
our visualization.
Concerning UML and profiles for component-
based development, (Petricic et al., 2009) describe
how to create a UML profile for the SaveCCM com-
ponent model and (Object Management Group, 2007)
is the official UML profile for the CORBA compo-
nent model. Extending UML through profiles is not
the only way it can be extended. There is also the
possibility to extend the core meta-model of UML
as described in (Perez-Martinez, 2003). The author
INTERACTIVE COMPONENT VISUALIZATION - Visual Representation of Component-based Applications using the
ENT Meta-model
219

used this “heavyweight” approach to provide a better
description of the C3 architectural style described in
(Shaw and Garlan, 1996). Our work could similarly
modify the UML meta-model to back the visual nota-
tion, but we rather chose a new and clean meta-model
without legacy problems.
In (Dumoulin and Gerard, 2010), the authors
present a very innovative extension of UML by
adding multiple layers. This is a big step for UML
diagrams because by using layers or, more precise,
change-sets, the information presented in a diagram
can be modified. This solution removes the problem
with multiple diagrams of the same application cre-
ated for different roles, but it doesn’t address the in-
teractivity issues.
3 ENT META-MODEL
The ENT meta-model is a MOF (Meta Object Facility
(Object Management Group, 2006b)) model, defining
the structures of component models and component-
based applications; see (Brada, 2004) and (Snajberk
and Brada, 2011) for details about the model. It is
supposed to be able to describe any component-based
application in any component model.
Its main characteristic is the use of the faceted
classification approach (Prieto-Diaz and Freeman,
1987) to represent components in a way which is flex-
ible enough for users with different interests. A key
structure used in the meta-model is the ENT classifier,
which is a tuple of identifiers which characterise any
component interface element from several orthogonal
aspects related to user perception.
3.1 Overview of the Meta-model
The ENT meta-model is structured into two levels:
on the component model level the main characteristic
features of a given component model are defined; on
the application level the concrete components, their
interface elements and their bindings in an application
are captured.
The structural hierarchy of the meta-model starts
with a component model as a set of component types.
A component type is defined by a complete minimal
set of definitions of traits which describe the possible
kinds of interface elements which the component type
can support. The traits declare the language meta-type
and ENT classifier of these elements, capturing their
commonalities like the users do. To allow usage of
details on the lower level, we have to formally define
them as definitions of tags.
As an example, there is only one component type
in OSGi called a “bundle”, with traits listed in Ta-
ble 1. The ENT meta-model enforces this structuring
of component interface (as opposed to a flat collec-
tion of items, cf. Figure 3) because it is quite natu-
ral for developers to think of, e.g., all components’
provided services as a group, regardless of their con-
crete interface types and location in the specification
source. In Enterprise JavaBeans, on the other hand,
several different component types can be identified
– SessionBeans (with traits listed in Table 1), Mes-
sageDrivenBeans or Entities. The component types,
as well as the trait’s characteristic meta-type and clas-
sifier, are therefore based on a human analysis of the
concrete component model and its component speci-
fication language(s).
Table 1: Traits of Bundle and SessionBean.
Bundle (OSGi) SessionBean (EJB)
Exported packages Business interfaces
Imported packages Business references
Provided services Event publishers
Required services Resources
Required bundles Web services
Used packages Web service references
... ...
At the level of a concrete application, a component
implementation then conforms to one of the compo-
nent types defined by its component model. Each
component has a set of concrete interface elements
manifest on the visible surface of its black box. These
elements populate some or all of its actual traits,
which again conform to the corresponding trait def-
initions. Details about components and interface ele-
ments are created in the form of tags that conform to
their tag definitions.
The component also holds the connections of its
elements to the counterpart elements in client and/or
supplier components, and – in the case of hierarchical
component models – may list the sub-components it
is composed from.
The list of interface elements present in the com-
ponent will look, written in the simple XML notation,
as below:
<component name="Server" ref="Bundle">
<trait ref="Import packages">
<element name="cz.zcu.client"
type="package">
</element>
<element name="cz.zcu.connector"
type="package">
</element>
</trait>
<trait ref="Required services">
ENASE 2011 - 6th International Conference on Evaluation of Novel Software Approaches to Software Engineering
220

<element name="cz.zcu.client.ifaces.
IMessages" type="service">
<tag name="version" value="1.2.0." />
</element>
<element name="cz.zcu.client.ifaces.
ICalculator" type="service">
<tag name="version" value="1.0.0." />
</element>
...
</trait>
...
</component>
In many component models, several run-time in-
stances of a concrete component can be created, each
with a unique identity. The ENT meta-model does not
deal with component instances because its domain is
the level of component models and component appli-
cation design, rather than the run-time instantiation
level.
3.2 Classification System
A key structure used in trait definition is the ENT
classifier, which is a tuple of identifiers which char-
acterize any component interface element from sev-
eral orthogonal aspects related to user perception. The
ENT classification system has eight facets called “di-
mensions” and for every trait one value is chosen from
every dimension. However, there is one exception,
because in Lifecycle dimension, multiple values can
be chosen marking in which life cycle phases the ele-
ment is important.
• Nature = {syntax, semantics, nonfunctional}
• Kind = {operational, data}
• Role = {provided, required, neutral, ties}
• Granularity = {item, structure, compound}
• Construct = {constant, instance, type}
• Presence = {mandatory, permanent, optional}
• Arity = {single, multiple}
• Lifecycle = {development, assembly, deploy-
ment, setup, runtime}
These classifiers are the key structure for category
sets which say how to group and filter traits. By filter-
ing traits one can produce for every situation, a subset
of traits emphasizing the significant ones. Category
sets are defined by selector operators in the trait clas-
sification and can be created by any user if another
point of view is needed.
The key category set for component applications
is the E-N-T (Brada, 2004), which has three groups
(see Figure 1). The first group contains traits with
E-N-T (Exports-Needs-Ties)
f
E
= λC.(C.role =
{
provided
}
)
f
N
= λC.(C.role =
{
required
}
)
f
T
= λC.(C.role =
{
provided, required
}
)
Figure 1: ENT category set.
dimension {role = provided}; this means those ele-
ments which the component exports. Required ele-
ments are similarly grouped as needs and elements
that can be both provided and required are called ties.
4 INTERACTIVE
VISUALIZATION
In this section we will introduce a visualization tech-
nique that is based on the ENT meta-model described
earlier. This visualization should provide an alterna-
tive to the UML component diagrams – describing the
structure of any component-based application. It is
aimed to help understand the application faster and
more easily and to help in any situation where it is
important to keep the scope of the application under
control, while having access to the details. The sec-
ond goal is to remove the necessity of creating mul-
tiple diagrams for the same structure, just to differ in
the number of details.
We decided to address these problems because we
find it alarming that UML component diagrams of
component-based applications are over-complicated,
by either complexity or number of diagrams. When
any institution is supposed to take over a component
project, it takes dozens of man-hours to understand
the application. When anyone is added to the team
working on a component project, it each time takes
the same high amount of time. This is mainly due to
the time needed to understand the diagrams, because
UML diagrams are not scalable. Since several dia-
grams are commonly created, the time for their cre-
ation and maintenance needs to be counted as well.
These problems are related to problems formal-
ized in Section 1.1 because a well thought-out group-
ing of elements improves the orientation in the com-
ponent application. Information hiding and working
with level of details are also mechanisms that speed
up understanding.
4.1 Underlying Principles
We built our interactive visualization on several prin-
ciples that help us to achieve these goals. They are
adapted from (Holt, 2002) (Meyer et al., 2010), where
INTERACTIVE COMPONENT VISUALIZATION - Visual Representation of Component-based Applications using the
ENT Meta-model
221
even more ideas on how to increase cognitive capabil-
ities for information visualization can be found.
First of all, we didn’t want to create a new visual
notation when it is not needed, so we reused sev-
eral principles of how the components should look
and how they should be connected from UML, and
added several improvements or novel features that
UML does not offer. Another thing that is different
from UML is information hiding that is bound to how
the components are presented. The key idea is to show
only what is important at the current level of abstrac-
tion. These principles are behind the notation core
described in Section 4.2.
To eliminate the need for multiple diagrams, we
keep all information stored in one model and we
present only information that is required by the user
depending on his role. To enable these requirement-
based views, we created Category sets that enable
rule-based filtering based on the trait characteristics.
Use of category sets is described in Section 4.3.
In diagrams of complex applications, the com-
plexity of connection lines can completely overwhelm
users’ cognitive capacity. We propose their reduction
to only one connection between two components and
we discuss it in Section 4.4, where we also describe
how the details about these connections can be ac-
cessed. Similarly, we propose how to optimize orien-
tation in complex hierarchical applications, by sim-
ply collapsing them to hide details and expanding on
demand, thus also working on different levels of de-
tails. These principles are discussed in Section 4.5.
The last principle that addresses the needs of com-
ponent assemblers is “Structure mode”. It is designed
to help working with the whole structure while not
losing all the advantages of our proposed visualiza-
tion technique. This is briefly described in Section
4.6.
4.2 Visual Notation of Components
The visual representation of a single component is de-
scribed here. The header of a component has two
lines: the type of component is enclosed by guillemets
on the first line and the name of the component is
present on the second line. The header and connec-
tions between components are the only things that do
not change; the body of the component can be altered
as the user needs. The component is highlighted when
the user clicks on it and all tags related to the compo-
nent itself are shown in an info box, which appears
next to the component.
The body of the component is quite different from
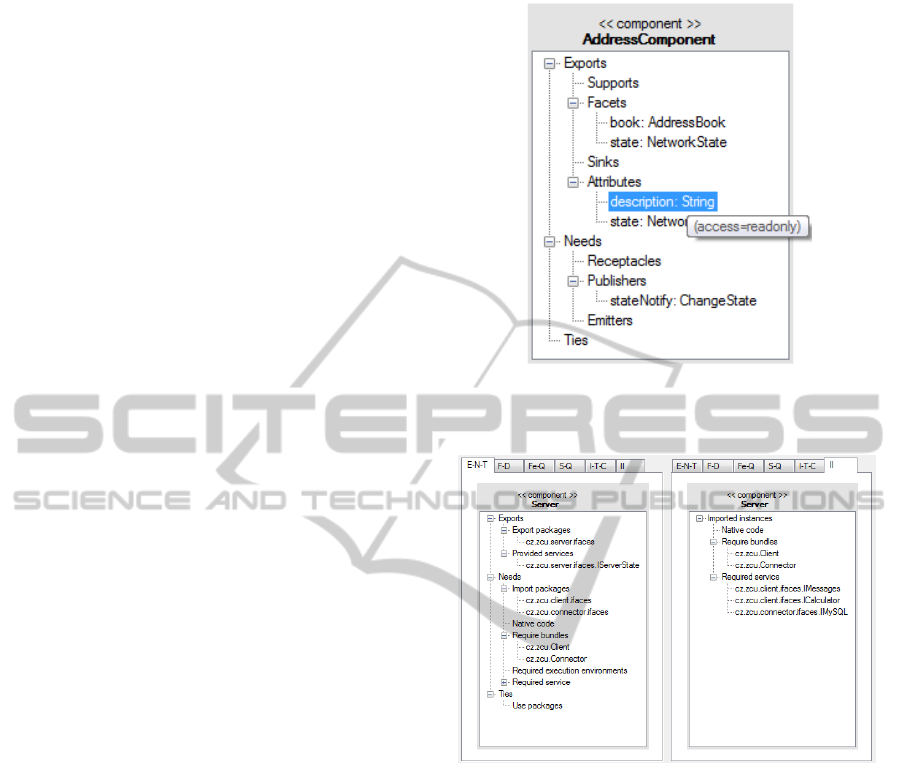
UML (see Figure 2). It presents elements in a tree
structure. The highest level are categories that group
Figure 2: Sample CORBA component in ENT visualiza-
tion.
Figure 3: Filtering ENT visualization by category sets.
traits which match specified rules (see Section 4.3);
the elements are then leaves of this structure.
A single element is displayed in the classical way
as nameOfElement: type. If it doesn’t have any type
defined (and also when the type isn’t important or
is always the same), it is displayed only as name-
OfElement. Types of elements are used, e.g., with
CORBA components (e.g. Figure 2), unlike for OSGi,
where elements are the names of interfaces, classes
and packages (e.g. Figure 4).
If the user is interested in a concrete element, he
can hover over it and all tags will be displayed in info
box. This info box is apparent in Figure 2, where ele-
ment description is readonly.
In Figures 2 and 3, it can be seen that different
components from different component models are dis-
played similarly, so it is easy to read components
from any component model.
ENASE 2011 - 6th International Conference on Evaluation of Novel Software Approaches to Software Engineering
222
4.3 Diagram Filtering by Category Sets
Different users and roles need, in different situations,
to emphasize and/or hide some traits and elements.
For example, component architects are interested in
other information than component developers. By
displaying all information contained in the model, on
the other hand, there could be a danger of confusion
when representing big and complex applications.
These problems are solved by using category sets
described in Section 3.2. These category sets can filter
and group traits and then be used to provide the tree
structure described in the previous section.
For example, there are two different views of the
same OSGi bundle in Figure 3. The ENT category set
shows all traits of the bundle component type, while
the second set (II) is very selective and shows only
imported instances. The possibilities of grouping and
filtering are very rich, as they can use more than one
condition.
Additional category sets can be defined by a user
and used in the visualization. The visualization of
an application can thus be parametrized (modified) to
suit individual unforeseen needs or to specific roles.
For example, an OSGi system architect would benefit
most from the view consisting of two categories for
provided and required instances (Construct=Instance)
to concentrate on service-based communication.
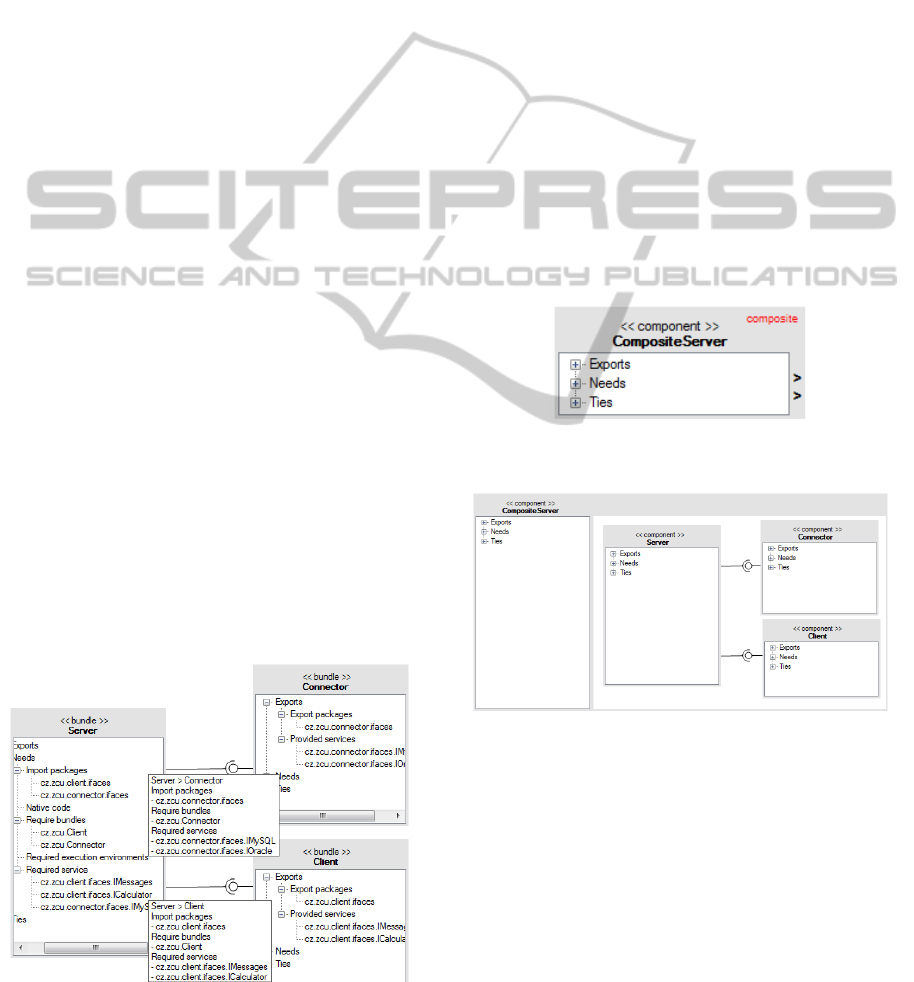
4.4 Inter-component Bindings
Bindings between two components are represented by
a “lollipop” notation. This style was chosen as it is a
standard way introduced by UML. In real world com-
ponent applications, it is usual that there are multiple
bindings between two components. With dozens of
components this would result in a cluttered diagram.
Figure 4: Simple OSGi application in ENT.
To reduce the complexity of such diagrams, we hide
all relations between two components under one line.
The user can still study how the components are re-
lated together, but the number of connection lines is
significantly reduced.
If the user wants to know which elements are cre-
ating a connection, he can click on the given line and
an information box will appear near the line. In Fig-
ure 4, one can see the Server bundle that requires
several elements from Connector and Client bundles.
In this figure, the user already required information
about connections and because of that the info boxes
on both connection lines are active.
4.5 Composite Components
The structure of component-based applications be-
comes complicated when higher-level components
use other composite (sub)components. The level of
recursion can be rather high, thus making the dia-
gram, where all these composite components show
their internal structure, hard to read and understand.
Figure 5: Sample composite component.
Figure 6: Extended composite component.
Our notation therefore displays composite compo-
nents similarly to atomic components, without reveal-
ing their internal structure, but informing that inner
architecture is present by the key word composite in
the upper right corner of the component.
The user can study a diagram and when he wishes
to display how the internal architecture of a composite
component looks, he just expands its box using the
expansion arrows along the edge of the component
box to unveil the detailed view (see Figures 5 and 6).
INTERACTIVE COMPONENT VISUALIZATION - Visual Representation of Component-based Applications using the
ENT Meta-model
223
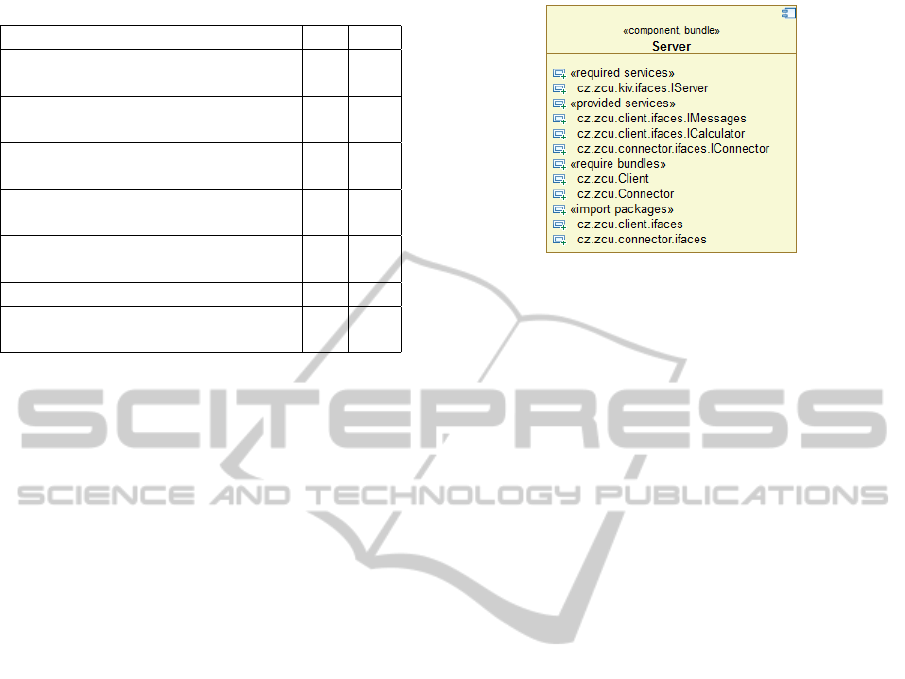
Table 2: Comparison of visualizations.
Situation ENT UML
User needs to create a high-level X
mental model from the diagram(s)
Application has to be described X
on several levels of details
User needs to work on several X
levels of details seamlessly
Dynamic aspects of the application X
need to be modeled
Application with many X
components and connections
Diagram is presented on paper X
User needs to present a diagram in a X
generally known format
This feature also keeps the diagram of the hierarchical
application simple and doesn’t require the creation of
any other separate diagrams to study the structure of
composite components.
4.6 Structure Mode
Component assemblers need most of the time to see
only the overall structure of the whole application, but
they might need to study the details of the component
to check the compatibility and substitutability.
Therefore, the structure mode presents all compo-
nents with the body part of the box hidden, so all that
remains from the component representation are the
names of the components and their types in guillemets
plus the connection lines. This results in a clean and
simple “boxes-and-arrows” diagram. The component
sets are still active, so clicking on the component will
reveal the body with a selected component set dis-
played in full detail as usual.
4.7 Comparison with UML
Let us conclude this section with a brief discussion
of the situations where it is better to use UML com-
ponent diagrams and when it is better to use our in-
teractive visualization, because each of them is best
for different kinds of things. The situations in which
the two visualization alternatives were compared are
presented in Table 2.
This comparison assumes that we use UML with
a profile and visual design styled to look similar to
our representation, so these two approaches are com-
parable. We found similar representation in (Eriks-
son et al., 2004), where elements are grouped by their
stereotype. The OSGi sample Server bundle in Figure
3 can be represented in UML as shown in Figure 7.
Figure 7: UML extended to look similar to ENT.
5 FUTURE WORK
In our research about interactive visualization, we
have everything prepared for the implementation
phase. We are currently working on a tool that im-
plements the described visualization approach. This
tool is written as Eclipse RCP (Rich Client Platform).
Analyzers of component implementations for OSGi,
EJB and SOFA component models are also part of
the construction. These loaders are written as plug-
ins and thus support for more component models can
be easily added to the finished tool. The completed
implementation of this tool will, furthermore, provide
extension points where new visualization styles could
be added.
The proposed interactive visualization has to be
tested on realistic case studies and real component
applications, involving users (programmers and ar-
chitects) to improve quality and usability and also to
provide empirical evaluation. Different kinds of high-
lighting and coloring based on classification, cluster-
ing of components and other enhancements will be
the subject of further research to improve the usabil-
ity in component-based development.
6 CONCLUSIONS
This paper presented a new approach in visualization
of existing component-based applications. This ap-
proach is based on the ENT meta-model, which en-
hances data on component interface elements with
semantic information. The model data based on the
ENT meta-model is content aware and thus can be in-
terpreted in various ways based on user needs. This
meta-model also offers the back end for different vi-
sualization styles.
The proposed visualization uses a notation based
on UML, but offers interactivity with the user and pro-
ENASE 2011 - 6th International Conference on Evaluation of Novel Software Approaches to Software Engineering
224

vides different views of the same model. One of its
contributions is generality, meaning it can visualize
any application from any component model. The ar-
guments for using this new visualization compared to
UML are: saving of time due to easier understanding,
working with several levels of details, cognitive prin-
ciples adapted to improve work with complex appli-
cations, easy scalability and future extendibility. We
expect this visualization will be further improved as
the research progresses.
ACKNOWLEDGEMENTS
The work was supported by the UWB grant SGS-
2010-028 Advanced Computer and Information Sys-
tems.
REFERENCES
Brada, P. (2004). The ENT Meta-Model of Component In-
terface, version 2. Technical report DCSE/TR-2004-
14, Department of Computer Science and Engineer-
ing, University of West Bohemia.
Brada, P. (2008). The CoSi Component Model: Reviving
the Black-box Nature of Components. In Proceedings
of the 11th International Symposium on Component-
Based Software Engineering, CBSE ’08, pages 318–
333, Berlin, Heidelberg. Springer-Verlag.
Bures, T., Hnetynka, P., and Plasil, F. (2006). SOFA 2.0:
Balancing Advanced Features in a Hierarchical Com-
ponent Model. In SERA, pages 40–48. IEEE Com-
puter Society.
Byelas, H. and Telea, A. (2006). Visualization of Areas of
Interest in Software Architecture Diagrams. In Pro-
ceedings of the 2006 ACM symposium on Software vi-
sualization, SoftVis ’06, pages 105–114, New York,
NY, USA. ACM.
Dumoulin, C. and Gerard, S. (2010). Have Multiple Views
with one Single Diagram! A Layer Based Approach
of UML Diagrams. research report inria-00527850,
Institut National de Recherche en Informatique et en
Automatique, Universite des Sciences et Technologies
de Lille.
Eriksson, H.-E., Penker, M., Lyons, B., and Fado, D.
(2004). UML 2 Toolkit. Wiley Publishing, Inc.
Favre, J.-M. and Cervantes, H. (2002). Visualization of
component-based software. In Proceedings. First In-
ternational Workshop on Visualizing Software for Un-
derstanding and Analysis, 2002., pages 51 – 60.
Favre, J.-M., Duclos, F., Estublier, J., Sanlaville, R.,
and Auffret, J.-J. (2001). Reverse engineering a
large component-based software product. In Software
Maintenance and Reengineering, 2001. Fifth Euro-
pean Conference on, pages 95 –104.
Hansson, H., Akerholm, M., Crnkovic, I., and Tarngren, M.
(2004). SaveCCM - A Component Model for Safety-
Critical Real-Time Systems. In EUROMICRO, pages
627–635. IEEE Computer Society.
Holt, R. (2002). Software Architecture as a Shared Mental
Model.
Merle, P. and Stefani, J.-B. (2008). A formal specification
of the Fractal component model in Alloy. Research
Report RR-6721, INRIA.
Meyer, J., Thomas, J., Diehl, S., Fisher, B., and Keim, D. A.
(2010). From Visualization to Visually Enabled Rea-
soning. In Hagen, H., editor, Scientific Visualization:
Advanced Concepts, volume 1 of Dagstuhl Follow-
Ups, pages 227–245. Schloss Dagstuhl–Leibniz-
Zentrum fuer Informatik, Dagstuhl, Germany.
Object Management Group (2006a). CORBA Components.
Object Management Group (2006b). Meta Object Facility
(MOF) Core Specification.
Object Management Group (2007). UML Profile for
CORBA and CORBA Components Specification.
Object Management Group (2009). UML Superstructure
Specification.
OSGi Alliance (2009). OSGi Servise Platform Core Speci-
fication.
Perez-Martinez, J. E. (2003). Heavyweight extensions to
the UML metamodel to describe the C3 architectural
style. ACM SIGSOFT Software Engineering Notes,
28(3):5.
Petricic, A., Lednicki, L., and Crnkovic, I. (2009). Using
UML for Domain-Specific Component Models. In
Proceedings of the 14th International Workshop on
Component-Oriented Programming.
Prieto-Diaz, R. and Freeman, P. (1987). Classifying soft-
ware for reusability. IEEE Software, 4(1):6–16.
Shaw, M. and Garlan, D. (1996). Software architecture.
Perspectives on an emerging discipline. Prentice Hall
Publishing.
Snajberk, J. and Brada, P. (2011). ENT: A Generic Meta-
Model for the Description of Component-Based Ap-
plications. In 8th International Workshop on Formal
Engineering approaches to Software Components and
Architectures.
Sun Microsystems, Inc. (2001). Enterprise JavaBeans(TM)
Specification.
Szyperski, C. (2002). Component Software: Beyond
Object-Oriented Programming. Addison-Wesley /
ACM Press, 3rd edition.
Telea, A. and Voinea, L. (2004). A Framework for Interac-
tive Visualization of Component-Based Software. In
EUROMICRO, pages 567–574. IEEE Computer Soci-
ety.
INTERACTIVE COMPONENT VISUALIZATION - Visual Representation of Component-based Applications using the
ENT Meta-model
225
