
MULTIPLE VECTOR CLASSIFICATION FOR P2P
TRAFFIC IDENTIFICATION
F. J. Salcedo-Campos, J. E. D´ıaz-Verdejo and P. Garc´ıa-Teodoro
CITIC, Dpt. of Signal Theory, Telematics and Communications, University of Granada, Granada, Spain
Keywords:
P2P identification, Feature extraction, Flow parameterization, Multiple vector classification.
Abstract:
The identification of P2P traffic has become a principal concern for the research community in the last years.
Although several P2P traffic identification proposals can be found in the specialized literature, the problem
still persists mainly due to obfuscation and privacy matters. This paper presents a flow-based P2P traffic
identification scheme which is based on a multiple classification procedure. First, every traffic flow monitored
is parameterized by using three different groups of features: time related features, data transfer features and
signalling features. After that, a flow identification process is performed for each group of features. Finally,
a global identification procedure is carried out by combining the three individual classifications. Promising
experimental results have been obtained by using a basic KNN scheme as the classifier. These results provide
some insights on the relevance of the group of features considered and demonstrate the validity of our approach
to identify P2P traffic in a reliable way, while content inspection is avoided.
1 INTRODUCTION
The wide expansion and increasing popularity of P2P
networks and applications gives way to the apparition
of some relevant concerns both in traffic engineering
and network security. On the one hand, tackling the
intensive use of network resources commonly associ-
ated to P2P activities represents a challenge for ISPs,
that must handle this high volume of traffic with min-
imal impact on the normal behaviour of the network,
while keeping costs under control. On the other hand,
the ability to communicate and exchange any kind of
information between the so called peers, most of them
being anonymous, represents a security risk. This
risk first comes from the perspective of the content
of the exchanged information or files, which consti-
tutes a security hazard for users through the propa-
gation and execution of viruses, worms, and malware
in general. Second, from the networks’ infrastructure
perspective, as P2P applications are an attack vector
that can be used to support other harmful activities as
DoS attacks, botnets, and so on.
In this context, it is clear the necessity of differ-
entiating P2P traffic from any other kind of traffic.
This is the so called P2P trafficidentification problem,
which is a specific topic in the more general one of
network traffic identification (Callado, 2009). Three
main issues arise at this respect:
• Traffic Parameterization. Several features have
been proposed in the literature to represent net-
work traffic in order to subsequently classify the
observed events as belonging to different classes.
This way, the data used ranges from the reports
of SNMP routers concerning session (connection)
statistics (Sen, 2004a) (lower granularity) to TCP
headers including the signaling bits and the first
bytes of the payload (higher granularity) (Mad-
hukar, 2006). Most approaches just make use
of the headers corresponding to RST, SYN and
ACK TCP related packets, as there is an under-
lying assumption about the relevance of the sig-
naling phase for P2P protocols. However, cur-
rent research is evolving to the use of the over-
all transport headers for every communication. In
some cases, a multiple characterization is pro-
posed. For example, (Chen, 2010) considers the
number of ARP packets, the average speed, the
average packet size, the proportion of TCP/UDP
traffic (IP mode) and the duration (IP-port mode)
for a communication.
• Identification Level. Once the traffic is param-
eterized, three different levels are considered in
the literature to carry out the identification pro-
cess (Keralapura, 2010) (Callado, 2009): node-
based identification, flow-based identification and
packet-based identification. In the first case, the
5
J. Salcedo-Campos F., E. Díaz-Verdejo J. and García-Teodoro P..
MULTIPLE VECTOR CLASSIFICATION FOR P2P TRAFFIC IDENTIFICATION.
DOI: 10.5220/0003457800050013
In Proceedings of the International Conference on Data Communication Networking and Optical Communication System (DCNET-2011), pages 5-13
ISBN: 978-989-8425-69-0
Copyright
c
2011 SCITEPRESS (Science and Technology Publications, Lda.)

objective is to detect those nodes generating P2P
traffic (Xuan-min, 2010). In the flow-based case
the goal is to classify each flow as P2P or other-
wise. Finally, in packet-based the objective is to
classify each individual packet. It is interesting to
remark that it is usual to mix those identification
levels in different ways. For example, the detec-
tion of nodes generating P2P traffic can be dealt
with by detecting at least one P2P packet gener-
ated by this node. Other approaches like (Kerala-
pura, 2010) use a layered methodology by first de-
tecting nodes and then refining the results to clas-
sify the generated flows and, consequently, the as-
sociated packets.
• Identification Process. Finally, the schemes used
to perform the identification itself cover a broad
range of techniques. From simple heuristics or
indicators (Liu, 2010) (Callado, 2009) (JinSong,
2007) to complex data mining or pattern learn-
ing algorithms (Soysal, 2010) (Keralapura, 2010)
(Fontenelle, 2007) (Erman, 2007). Moreover,
some papers propose to combine several classi-
fiers in a multilayer structure (Yiran, 2010) or in
an independent way (Callado, 2010).
Regarding the aforementioned aspects, this paper
presents a novel approach for P2P traffic identifica-
tion, with the following characteristics:
1. A flow-based approach is considered at the identi-
fication level. For that, the source and destination
ports as well as the source and destination IP ad-
dresses, together with transport layer protocol, are
used to group individual packets into flows.
2. After that, three main groups of features are ob-
tained for representing every flow at the traffic
parameterization stage: transfer related parame-
ters (e.g., packet size), signalling parameters (e.g.,
number of SYN and ACK TCP packets), and time
related parameters (e.g. packet inter-arrival time).
This way, a flow is represented by a tuple of three
vectors, each one corresponding to a group of fea-
tures, and some additional parameters related to
the flow as the ports or the direction of the first
packet. It is important to highlight that none of
the features are payload-based.
3. Finally, a triple classification procedure is per-
formed to identify a flow as P2P or otherwise, one
for each feature vector. By combining the results
of the three classifiers, a final decision is taken to
identify a flow as P2P or otherwise. This approach
is named as MVC, from Multiple Vector Classifi-
cation.
The items 2) and 3) constitute the specific con-
tributions of this work, they being exposed along the
paper as follows. Section 2 describes the general eval-
uation framework used in experimentation. Section 3
details the feature extraction process in order to de-
tect and represent each traffic flow. After that, a sim-
ple KNN-based classifier is used in Section 4 to im-
plement the MVC identification process, from which
some experimental results are obtained. Despite the
simplicity of the detector used, the results obtained
clearly demonstrate the goodness of our approach to
identify P2P traffic in a reliable way, and on top of
all without requiring payload inspection. Finally, the
main contributions of this work and some future re-
search lines are discussed in Section 5.
2 TESTBED
The assessment of identification methods requires the
availability of a database of traffic properly classified.
This database should be used as the reference to de-
termine the correctness of the results obtained, thus
being the ”ground truth”, and should contain enough
data so as to be representative. Nevertheless, obtain-
ing a big enough database of labeled traffic is not an
easy task, as a manual labeling process is not afford-
able. Furthermore, the data should be captured in a
real network without introducing any artifact, which
voids other approaches as injecting known traffic.
Therefore, to evaluate the proposed system we
have developed an experimental setup built from two
main components: a database of real traffic captured
in an academic network, and a tool to automatically
classify packets and flows according to their payloads
by using Deep Packet Inspection (DPI). This way, the
”ground truth” is built by analyzing and identifying
each flow and packet according to this tool under the
assumption that DPI is the best currently available
method for this and that the number of errors is negli-
gible. This is a common approach in the traffic iden-
tification field, the number of packets and flows that
DPI is not able to classify being its major limitation.
2.1 DPI Tool
The tool of choice for the classification of traffic is
openDPI (OpenDPI, 2011), which is derived from the
commercial PACE product from ipoque. The core
of openDPI is a software library designed to clas-
sify internet traffic according to application proto-
cols. In (Mochalski, 2009) the authors explain that
the DPI-based protocol and application classification
is achieved using a number of different techniques:
• Pattern matching, by scanning for strings or
generic bit and byte patterns anywhere in the
DCNET 2011 - International Conference on Data Communication Networking
6
packet, including the payload portion. This way,
DPI searches for signatures of known protocols.
• Behavioral analysis, by searching for known be-
havioral patterns of an application in the moni-
tored traffic. The data used include absolute a rel-
ative packet sizes, per-flow data and packet rates,
number of flows and new flow rate per applica-
tion.
• Statistical analysis, by calculating some statistical
indicators that can be used to identify transmis-
sion types, as mean, median and variation of val-
ues used in behavioral analysis and the entropy of
a flow.
Therefore, openDPI is not a pure-DPI product as
it is not only signature-based but also incorporates in-
formation from other sources. This way, the classi-
fication accuracy is improved (no false classification
according to ipoque’s claims), although some pack-
ets and flows still remains unclassified. This, to-
gether with the availability and quality of the signa-
tures, made us to select openDPI instead of any other
similar product.
For the purposes of our work, we have built a tool
based on the openDPI library which is able not only
to identify the application protocols but also to follow
and differentiate the packets in each flow
1
. This way,
two classifications are provided: flow-based (each
flow is labeled) and packet-based (each packet is also
labeled). The tool operates in batch mode and, once
the protocol of a flow is known, all the unknown pack-
ets in that flow are relabeled as belonging to the iden-
tified protocol.
2.2 Traffic Datasets and ”Ground
Truth”
The traffic database contains data captured during 3
working days for various nodes in a university net-
work. The data acquisition was carried out at a border
router in order to be able to monitor all incoming and
outcoming traffic for those nodes. Therefore, apart
from the boundaries of the caption, flows are captured
complete and in both directions. Two datasets S1 and
S2 with different groups of nodes are considered to
1
To be able to handle UPD packets, we have generalized
the concept of flow through the use of sessions. Sessions are
considered as defined by the exchange of information asso-
ciated to a tuple (IP addresses, ports and transport protocol).
If the traffic is TCP, a session can be identified as a TCP flow
under the assumption that the number of ephemeral ports
used by a given IP entity is not greater than 65535 during
the observed period. Nevertheless, throughout this paper,
we will use the term flow to refer to a session.
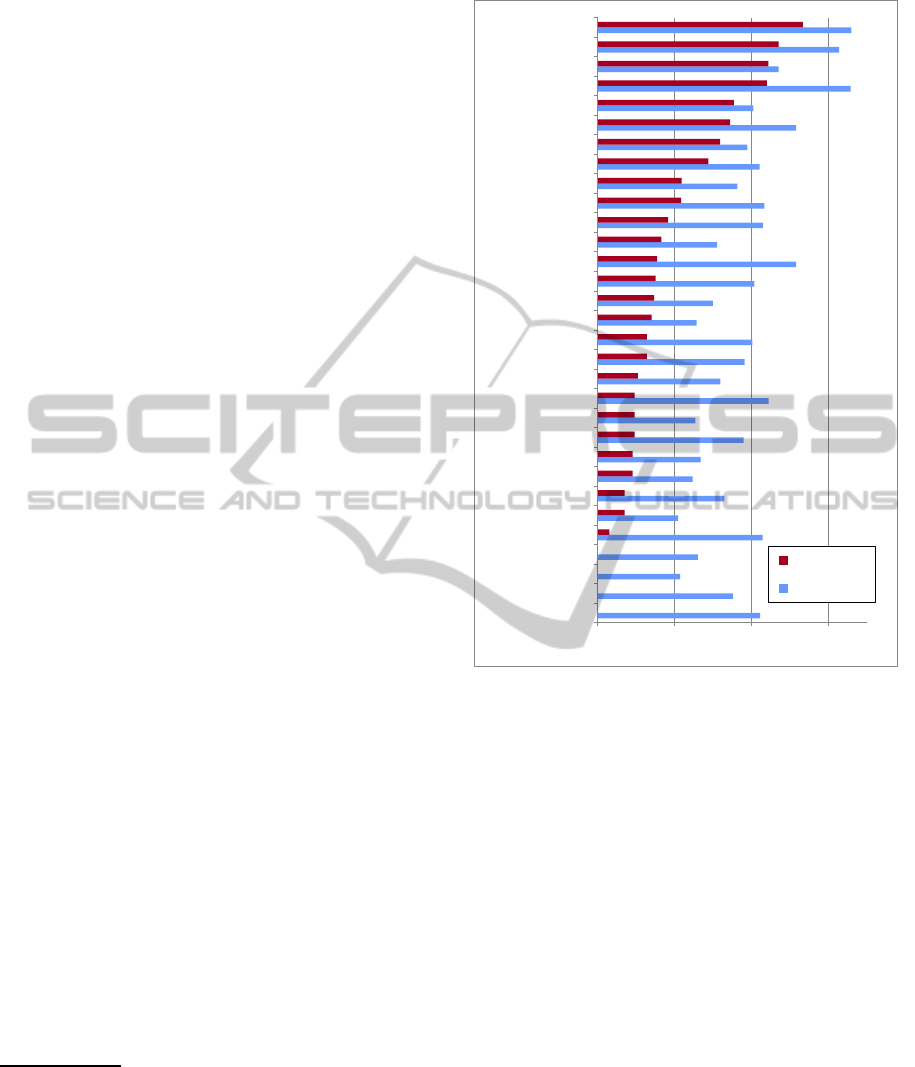
1 100 10000 1000000
MMS
QuickTime
RealMedia
SNMP
RTP
Oscar
SSH
NTP
SIP
iMESH
IRC
Windowsmedia
Yahoo
MPEG
MySQL
STUN
SMB
DirectDownloadLi…
Flash
NETBIOS
FTP
MSN
Mail_POP
Gnutella
Mail_SMTP
SSL
ICMP
Bi orrent
DNS
HTTP
unknown
FLOWS
PACKETS_FL
Figure 1: Relative number of instances (flows and packets)
of protocols identified in the traffic database.
be able to test and validate the method. Table 1 high-
lights some figures of the database.
The results provided by openDPI tool for the
database detected a total of 30 different protocols
(plus ’unknown’) as shown in Fig. 1. The results
show that HTTP is the most used protocol while the
relative proportion of P2P protocols is lower than ex-
pected (only 5-12% of flows). A more detailed anal-
ysis of the data shows that only a small number of
nodes generate P2P traffic, being videostreaming an
important contributor to HTTP traffic (e.g. Youtube
traffic).
Most of P2P flows from these nodes are BitTor-
rent, while Gnutella and others are present in a lower
proportion. The rest of the flows (non-P2P) includes
mostly usual protocols such as HTTP, DNS, SSL, and
mail protocols. The P2P/non-P2P traffic ratio is simi-
lar between both sets (see Table 1).
The set S1 will be used to evaluate and tune the
system, and S2 to validate the results. In order to
increase the confidence of the testing stage, 10-fold
stratified cross-validation are used, that is, the ob-
MULTIPLE VECTOR CLASSIFICATION FOR P2P TRAFFIC IDENTIFICATION
7

Table 1: Traffic used for classification experiments.
Flows
Set Total Labeled P2P flows Non-P2P flows Unknown
S1 70797 33524 8091 25433 37273
S2 107860 22645 16005 6640 85215
Total 178657 56169 24096 76475 122488
served flows of S1 were partitioned into 10 random
parts with the same number of flows, each present-
ing the same P2P/non-P2P ratio (Kohavi, 1995). A
leave-one-out procedure is applied, taking 9 partitions
with correctly labeled examples to train the system
and the remaining partition to evaluate it. Thus, 10
different configurations of the partitions for the ex-
periments are used and the results are averaged over
the whole set of experiments. The flows were ran-
domly assigned to partitions, in order to enhance the
confidence in the results.
2.3 Performance Indicators
In order to compare the results, three well-known
measures in the field of classification systems are con-
sidered (Gomez, 2002): percentage of true positives
(TP), percentage of false positives (FP) and classifi-
cation accuracy (CA).
Let N
p2p
and N
other
denote the total number of P2P
and non-P2P messages, respectively. Consider n
X→Y
as the number of flows in category X –non-P2P,other,
or P2P, p2p– being classified as belonging to category
Y (other or p2p). The previous measures can be de-
fined in our environment as follows:
1. TP, True Positives. The percentage of P2P flows
correctly classified as P2P in relation to the total
number of P2P flows.
TP =
n
p2p→p2p
N
p2p
· 100 (1)
2. FP, False Positives. The percentage of non-P2P
flows mistakenly classified as P2P in relation to
the total number of non-P2P flows.
FP =
n
other→p2p
N
other
· 100 (2)
3. CA, Classification Accuracy. The percentage of
flows correctly classified in relation to the total
number of flows.
CA =
n
p2p→p2p
+ n
other→other
N
p2p
+ N
other
· 100 (3)
The ideal system should achieve 100% CA with
100% TP and 0% FP. In order to facilitate the data rep-
resentation and analysis we use True Negatives (TN),
which is an equivalent measure to FP errors. It repre-
sents the percentage of non-P2P flows correctly clas-
sified as non-P2P in relation to the total number of
non-P2P flows. It can be calculated directly from FP
rate as TN = (100− FP).
3 FLOW PARAMETERIZATION
The output of the openDPI tool is a list of the found
flows along with their classifications, a list of pack-
ets also with their classifications and a pairing list re-
lating flows and packets in each flow. From this in-
formation, a parametrization process is applied to ob-
tain a feature vector for each flow, as shown in Table
2, with 61 components. The vectors contain all the
information required for their further processing, in-
cluding an identification label (FLOW ID), the proto-
col as detected by openDPI and some basic informa-
tion regarding the flow (flow tuple). IP addresses in a
flow are ordered considering them as integers (using
network representation) and, therefore, two directions
for the packets are considered in the parametrization:
UP, for packets traveling from IP LOW to IP UPPER,
and DOWN for the opposite direction.
The values considered in a parameter vector are
basic statistical measures and flow properties, most of
them split in total, up and downcontributions. Among
the parameters are the usual ones included in most
netflow-like flow analysis as average packet size, flow
duration and number of packets, while at the same
time we have included a more detailed description at
temporary and signaling level (e.g. interarrival times
and number of URG packets).
By analyzing the nature of the parameters, we can
consider a feature vector as composed by four parts:
• An identification vector (10 components), which
includes all the information required to univocally
differentiate each flow and its identification ac-
cording to openDPI (used just to verify the cor-
rectness of the classification provided by the pro-
posed system).
• A transfer related vector (24 components), which
considers all the parameters related to the number
of packets and their sizes.
DCNET 2011 - International Conference on Data Communication Networking
8

• A time related vector (10 components), including
parameters related to temporary characteristics of
the flow, as duration and time between consecu-
tive packets.
• A signaling vector (17 components), that accounts
for the number of packets with signaling informa-
tion and the associated signals.
The values for the parameters are obtained from
the list of packets in a flow by analyzing just their
sizes, timestamps, TCP flags if any, and the direction
of the packets. This way, no inspection of the pay-
load beyond TCP/UDP headers is made, thus preserv-
ing the privacy of the users at the application layer.
The complexity of the evaluation is low, as only max-
imum, minimum, count and average values for each
parameter are considered.
From the point of view of the classification prob-
lem addressed in this work, flow identification param-
eters, except port numbers, are dismissed, thus result-
ing in a parameter vector with, at most, 53 parameters.
4 EXPERIMENTAL RESULTS
The classification of the flows is made by using a
KNN classifier and considering different groups of
features as previously stated. Therefore, some basics
on the use of KNN are described next along with a
preliminary analysis on their applicability to the fea-
ture vectors considered in this work. From this, the
experimental results obtained will be described and
analyzed.
4.1 KNN-based Classification
The K-Nearest Neighbors algorithm, or KNN, is a
method for classifying objects based on closest train-
ing examples in a feature space (Duda, 2001). It is
among the simplest machine learning algorithms: an
object is classified by a majority vote of its neighbors,
with the object being assigned to the most common
class among its K nearest neighbors.
Let us suppose that we want to classify the gray
triangle as a circle or a square in the space shown
in Fig. 2. If K = 1, it will be classified as a cir-
cle because its most close object is a circle. How-
ever, it will be classified as a square if K = 3, as two
of the three most close objects are squares. The best
choice of K depends upon the data. Larger values of
K generally reduce the effect of noise on the classifi-
cation, but make boundaries between classes less dis-
tinct. A good K can be selected by various heuristic
techniques, for example, cross-validation. The spe-
cial case where the class is predicted to be the class of
Table 2: Components of the parameter vector for each flow.
Name Description
Flow identification
FLOW ID Number of the flow (in the file)
ID PROT Detected protocol
IP
LOW Minor IP address in the session tuple
IP
UPPER Greater IP address in the session tuple
PORT1 Port associated to minor IP (IP
LOW)
PORT2 Port associated to greater IP (IP
UPPER)
PROT Transport protocol (TCP/UDP)
DIR Direction of the first observed packet
FIRST
TIME Timestamp for the first packet (µs)
LAST
TIME Timestamp for the last packet (µs)
Transfer related
NPACKETS Number of packets in the flow
NPACKETS
UP Idem UP direction
NPACKETS DOWN Idem DOWN direction
PACKETS
SIZE Total size of the exchanged packets
PACKETS
SIZE UP Idem UP
PACKETS
SIZE DOWN Idem DOWN
PAYLOAD
SIZE Total size of payloads
PAYLOAD
SIZE UP Idem UP
PAYLOAD
SIZE DOWN Idem DOWN
MEAN
PACK SIZE Mean size of the packets
MEAN
PACK SIZE UP Idem UP
MEAN
PACK SIZE DOWN Idem DOWN
SHORT
PACKETS Number of short packets
SHORT
PACKETS UP Idem UP
SHORT
PACKETS DOWN Idem DOWN
LONG
PACKETS Number of long packets
LONG
PACKETS UP Idem UP
LONG
PACKETS DOWN Idem DOWN
MAXLEN Maximum packet size
MAXLEN
UP Idem UP
MAXLEN DOWN Idem DOWN
MINLEN Minimum packet size
MINLEN
UP Idem UP
MINLEN
DOWN Idem DOWN
Time related
DURATION Duration of the flow (µs)
MEAN
INTERAR Mean time among consecutive packets
MEAN
INTERAR UP Idem only for UP packets
MEAN
INTERAR DOWN Idem only for DOWN packets
MAX
INTERAR Max. time among consecutive packets
MAX
INTERAR UP Idem only for UP packets
MAX
INTERAR DOWN Idem only for DOWN packets
MIN
INTERAR Min. time among consecutive packets
MIN
INTERAR UP Idem only for UP packets
MIN
INTERAR DOWN Idem only for DOWN packets
Signaling
N SIGNALING Number of packets with flags
N
SIGNALING UP Idem UP
N
SIGNALING DOWN Idem DOWN
NACKS N. of packets with ACK flag active
NFIN Idem FIN
NSYN Idem SYN
NRST Idem RST
NPUSH Idem PSH
NURG Idem URG
NECE Idem ECE
NCWD Idem CWD
NACK
UP N. of packets with ACK flag (UP)
NACK
DOWN Idem DOWN
NFIN
UP Idem FIN & UP
NFIN
DOWN Idem FIN & DOWN
NRST
UP Idem RST & UP
NRST
DOWN Idem RST & DOWN
the closest training sample (i.e. when K = 1) is called
the ”nearest neighbor” algorithm, or simply NN.
The training examples are vectors in a multidi-
mensional feature space, each with a class label.
Thus, the training phase of the algorithm consists
only of storing the feature vectors and class labels of
MULTIPLE VECTOR CLASSIFICATION FOR P2P TRAFFIC IDENTIFICATION
9

Figure 2: Example of KNN classification: K = 1, (big circle
in dashed line), K = 3 (biggest circle in solid line).
the training samples. For our purposes, as evident,
each vector in the feature space is a data transfer re-
lated vector, a signaling vector, a time related vector
or an overall vector.
In the classification phase, K is a user-defined
constant, and an observed vector is classified by as-
signing the most frequent label among the K train-
ing samples nearest to that query event. Usually Eu-
clidean distance is used as the distance metric to de-
termine the proximity of two objects in the space.
However, other different distance measures are suit-
able to be applied. In our case, four metrics are
used: euclidean, cityblock, cosine and correlation.
Thus, the distance between two M-dimensional vec-
tors X = (x
1
, x
2
, ..., x
M
) and Y = (y
1
, y
2
, ..., y
M
) is al-
ternatively calculated as follows:
• Euclidean:
d
euc
(X, Y) =
s
M
∑
i=1
(x
2
i
− y
2
i
)
• Cityblock:
d
cit
(X, Y) =
M
∑
i=1
|x
i
− y
i
|
• Cosine:
d
cos
(X, Y) = 1 −
M
∑
i=1
x
i
y
i
s
M
∑
i=1
x
2
i
s
M
∑
i=1
y
2
i
• Correlation:
d
cor
(X, Y) = 1−
1
M
M
∑
i=1
x
i
− ¯x
σ
x
y
i
− ¯y
σ
y
where ¯x and ¯y are the average components of X and
Y, and σ
x
and σ
y
their standard deviations. The last
factor can be calculated through the next expression:
σ
x
=
s
1
M − 1
M
∑
i=1
(x
i
− ¯x)
2
4.2 Preliminary Analysis
The parameters list in Table 2 includes different mea-
sures over flows: ports used, duration, time between
packets, number and length of packets, etc. This vari-
ety of parameters implies many statistical differences
in terms of average, range or distribution between
all of them, especially between parameters from dis-
tinct nature. An extreme example is to compare sig-
nalization parameters with timing ones. As we can
see on Table 3, DURATION and N SYN mean val-
ues differs in eight or nine orders of magnitude, de-
pending on the traffic type (P2P or non-P2P). Simi-
lar differences –O(6) to O(8)– can be observed be-
tween the statistics of the number of packets per flow
(N PACKETS) and DURATION. At the same time,
the parameter ranges are also very different –from
O(9) between DURATION and N SYN to O(3) be-
tween N PACKETS and N SYN–. These wide differ-
ences in ranges and means between parameters types
poses a drawback to classification algorithms, espe-
cially those based on distance measures as in the KNN
case.
One solution could be to re-scale the parameters
using a logarithm function (Yuan, 2010), so all of
them were distributed in the same value range be-
tween 0 and 1. This option has the disadvantage that
all the parameters are treated in a similar way, but this
is not realistic. We cannot ignore that there are some
parameters with a continuous nature, for example all
those related with time, and some others with an ev-
ident discrete nature, like signaling parameters. This
fact suggests us to treat them separately, in order to
empower classification techniques.
On the other hand, it is likely that some param-
eters provide more information than others and even
that some parameters do not provide any evidence at
all for classification purposes. If all the parameters
are treated in a homogeneous way, that is, if all the
ranges are somehow normalized, the classification ac-
curacy can be diminished (features without discrimi-
native information will behave as noise for the classi-
fier). Therefore, an approach in which only selected
features are evaluated in order to determine their dis-
criminative capabilities when compared against the
others becomes very interesting. Therefore, the clas-
sifier to evaluate will be composed of a set of classi-
fiers, one per group of features, and the final decision
will be made by combining the outputs provided by
each individual classifier. This approach, named Mul-
tiple Vector Classification is similar to that of MVQ
that has been successfully applied in speech recogni-
tion (Segura, 1994).
The experiments will be designed to address the
DCNET 2011 - International Conference on Data Communication Networking
10

improvement of the classification that can be achieved
by using this method when compared to a single clas-
sifier whose inputs are vectors composed of all the
features in Table 2. Therefore, a preliminary exper-
iment with the full feature vector over S1 has been
made to be used as the reference system. The results
are shown in Fig. 3, where a KNN classifier is used
as indicated in Section 4.1 with four different distance
metrics: euclidean, cityblock, cosine and correlation.
The number of nearest neighbors used in the classi-
fication test ranged from K = 1 to K = 10. The best
results were obtained for K = 4, which are similar to
other reported in the literature. The results do not dif-
fer significatively between the considered distances
in terms of classification accuracy (CA), because all
of them achieve the same true negatives (TN) results.
Thus, the differences are mainly based on the TP mea-
sure.
4.3 MVC: Identification Results and
Analysis
As previously explained, the 53 parameters obtained
for representing flows have been split in three sets ac-
cording to its nature (Table 2):
1. Time Related. There exists 10 parameters related
to time in the feature vector like the duration of
the flows, arrival intervals between packets, etc.
2. Data Transfer Related. Include all the parame-
ters indicating volume, like the number of packets
of the flow, number of bytes of the packets, etc.
There are 24 parameters belonging to this cate-
gory.
3. Signaling Related. There are 19 parameters re-
lated to signalization, like the whole number of
signaling packets exchanged in the flow, and the
number of each kind of signaling packet (ACK,
FIN, SYN, URG, etc.).
According to some works in traffic identification
–e.g. (Sen, 2004b)–, and despite the use of ephemeral
ports on many protocols, port numbers can still be in-
formative to differentiate some protocols. Neverthe-
less, they are not included in any of the considered
set of features. Due to the lack of relationship of port
numbers with time or volume parameters and taking
into account that they could be considered as signal-
ization at the application layer, we have included port
numbers in the signaling category.
Three different MVC schemes have been evalu-
ated with the same distance metrics and values for K
as in the reference system in Fig. 4. They all rely on a
first triple KNN classification, one for each group of
features or vector, and are as follows:
0,97
0,97
0,95
0,95
0,93
0,93
0,90
0,90
0,98
0,98
0,98
0,98
88%
89%
90%
91%
92%
93%
94%
95%
96%
97%
98%
Euclidean
Cityblock
Cosine
Correlaon
% CA
% TP
% TN
Figure 3: KNN classification results over S1 flows using all
the features in a single vector.
• Voting. The flow is assigned to the class provided
by the majority of the KNN for each of the three
groups of features. This way, a flow will be iden-
tified as P2P if at least two of the KNNs classify
it as P2P.
• Nearest KNN. The flow is assigned to the cate-
gory given by the KNN providing the lowest dis-
tance, independentlyof the fact that it corresponds
to the time related vector, the signaling vector or
the data vector.
• Lowest Aggregate Distance. The flow is as-
signed to the category for which the addition of
the distances for each vector provided by the cor-
responding KNN is the lowest one.
Prior to the evaluation of the above MVC
schemes, it is necessary to determine again the best
K value and distance for classification purposes, as
we are now considering the overall features grouped
into vectors with different nature. As before, CA, TP
or TN can be used to estimate the best K and distance.
Taking into account Figure 3, it seems reasonable to
select the distance that provides the better TP results
because it is the weaker aspect in the four cases. Thus,
cityblock is the best distance for time related and sig-
naling vectors, while correlation distance is the best
one for the data transfer vector. The number of nearest
neighbors is K = 4, the same value that was obtained
in Section 4.2.
Taking into account these results for the individ-
ual KNNs, the evaluation of the three alternate MVC
schemes for definitively identifying an observed flow
as P2P or otherwise is performed. Figure 4 shows
the identification results obtained in comparison with
those corresponding to the reference system when a
single 53-dimensional vector-based KNN is used.
It is remarkable the TP improvement achieved
with the three MVC schemes. Furthermore, both
MVC voting and MVC nearest KNN schemes im-
MULTIPLE VECTOR CLASSIFICATION FOR P2P TRAFFIC IDENTIFICATION
11
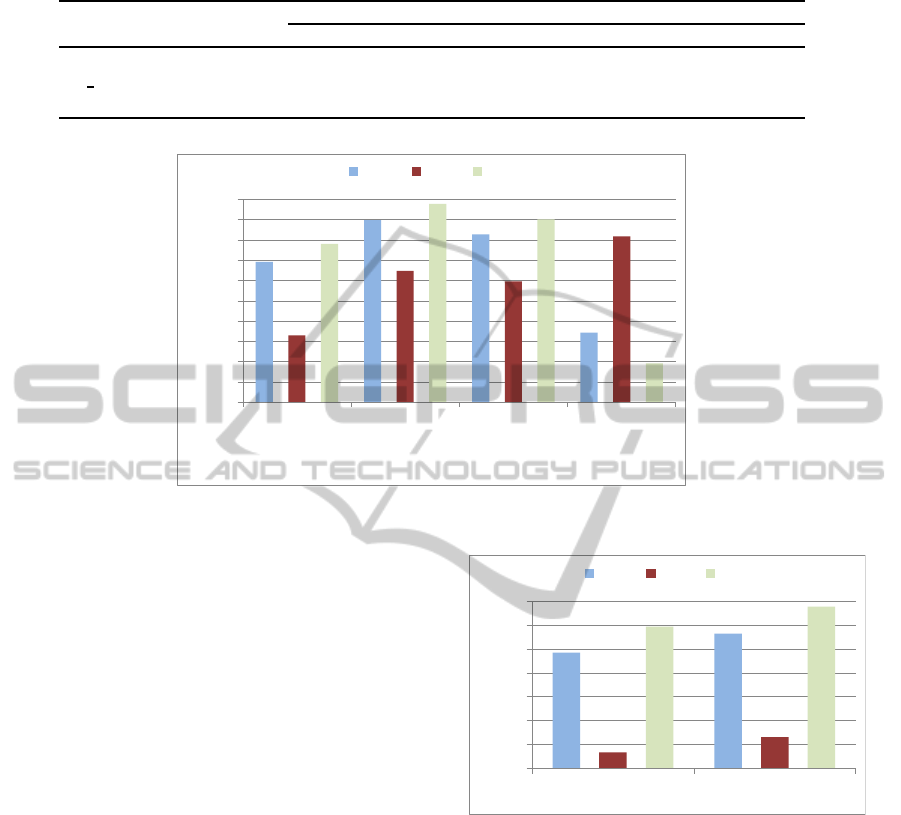
Table 3: Basic statistics of some different flow parameters for S1.
P2P non-P2P
Parameter Type Mean Min Max Mean Min Max
DURATION time 5.58x10
8
0 1.69x10
11
5.04x10
9
0 1.72x10
11
N PACKETS volume 124.85 1 229507 46.80 1 243444
NSYN signaling 2.38 0 673 1.67 0 524
0,97
0,99
0,98
0,93
0,93
0,96
0,96
0,98
0,98
1,00
0,99
0,92
90%
91%
92%
93%
94%
95%
96%
97%
98%
99%
100%
KNN all
parameters
MVC vo!ng
MVC nearest
KNN
MVC lowest
aggregate
distance
% CA
% TP
% TN
Figure 4: KNN classification results over S1 node flows using different MVC schemes.
prove CA and TN. These figures demonstrate that it is
possible to detect more than 96% of P2P traffic with a
very low false positives (FP) rate, less than 0.25%. In
summary, the MVC schemes outperforms the results
obtained by the single KNN classifier with mixed pa-
rameters in all the considered measures (CA, TP and
TN), with the only exception of MVC with lowest ag-
gregate distance, which just improves the true posi-
tives rate.
In order to validate the method, we have tested the
best MVC scheme over dataset S2. It is compared
with the results obtained by the single KNN classifier
with mixed parameters (cityblock distance). Figure 5
shows that the MVC method is still better than using
a single KNN with all the parameters together. There-
fore, the results over S1 and S2 datasets have shown
that the MVC schemes combined with a similarity
grouping of parameters is an appropriate method to
discriminate between P2P and no-P2P flows.
5 CONCLUSIONS
A multiple vector classification approach to identify
P2P traffic is presented in this paper. It is flow-
based, each flow being represented by a tuple of three
vectors regarding, respectively, data transfer features,
signalling features and time features. A triple classi-
fication is subsequently made per flow, one for each
0,78
0,86
0,37
0,43
0,89
0,98
30%
40%
50%
60%
70%
80%
90%
100%
KNN all parameters
MVC vo!ng
% CA
% TP
% TN
Figure 5: KNN classification results over dataset S2.
feature vector. From this multiple vector classifica-
tion, a global decision is taken for the flow identifica-
tion as P2P traffic or not. Although a simple KNN-
based classifier is used for implementing the system,
the experimental results achieved show the promis-
ing nature of our approach in reliably identifying P2P
traffic. Furthermore, the identification scheme does
not require to access sensible information in packet
payloads.
The proposed approach can be improved in some
ways. As an example, let us say three. First, a better
classifier can be used; for example, SVM has demon-
strated to have very good performance in this kind of
tasks. Second, each feature vector could be analyzed
more in detail in order to reduce its dimensionality
DCNET 2011 - International Conference on Data Communication Networking
12

to those more representative characteristics. Third,
some alternative combination schemes can be consid-
ered in the global identification process.
ACKNOWLEDGEMENTS
This work has been partially supported by Spanish
MICINN under project TEC2008-06663-C03-02.
REFERENCES
Callado, A., Kamienski, C., Szabo, G., Gero, B.P., Kelner,
J., 2009. ”A Survey on Internet Traffic Identification”.
In IEEE Communications Surveys & Tutorials, vol.
11, n. 3, pp. 37-52.
Callado, A., Kelner, J., Sadok, D., Kamienski, C.A., Fer-
nandes, S., 2010. ”Better network traffic identification
through the independent combination of techniques”.
In Journal of Network and Computer Applications,
vol. 33, pp. 433-446.
Chen, H., Zhou, X., You, F., Wang, C., 2010. ”Study of
Double-Characteristics-Based SVM Method for P2P
Traffic Identification”. In Int. Conference on Net-
works Security Wireless Communications and Trusted
Computing, pp. 202-205.
Duda, R.O., Hart, P.E., Stork, D.G., 2001. ”Pattern Classfi-
cation”. John Wiley & Sons.
Erman, J., Mahanti, A., Arlitt, M., Cohen, I., Williamson,
C., 2007. ”Offline/RealtimeTtraffic Classification Us-
ing Semi-Supervised Learning”. In Performance Eval-
uation, vol. 64, pp. 1194-1213.
Fontenelle, M., Bessa, J., Siqueira, G., Holanda, R., Sousa,
J., 2007. ”Using Statistical Discriminators and Clus-
ter Analysis to P2P and Attack Traffic Monitoring”,
In Latin American Network Operations and Manage-
ment Symposium, pp. 67-76.
Gomez, J.M., Puertas, E., Maa, M.J., 2002. Evaluating
cost-sensitive unsolicited bulk email categorization; in
Proc. of the ACM Symposium and Applied Comput-
ing, ACM Press, pp. 615-620.
JinSong, W., Yan, Z., Qing, W., Gong, W., 2007. ”Con-
nection Pattern-based P2P Application Identification
Characteristic”. In Proc. of Int. Conference on Net-
work and Parallel Computing Workshops, pp. 437-
441.
Karagiannis, T., Papagiannaki, K., Foloutsos, M., 2005.
”BLINC: Multilevel Traffic Classification in the
Dark”. In Proc. of the Conference on Applications,
Technologies, Architectures, and Protocols for Com-
puter Communications, pp. 229-240.
Keralapura, R. Nucci, A., Chuah, C., 2010. ”A Novel Self-
Learning Architecture for P2P Traffic Classification in
High Speed Networks”. In Computer Networks, vol.
54, pp. 1055-1068.
Kohavi, R.: A Study of Cross-Validation and Bootstrap for
Accuracy Estimation and Model Selection; in Proc.
of the 14th International Joint Conference on Artifcial
Intelligence, Montreal, Canada, (1995)
Li, X., Liu, Y., 2010. ”A P2P Network Traffic Identification
Model Based on Heuristic Rules”. In Int. Conference
on Computer Application and System Modeling, vol.
5, pp. 177-179.
Madhukar, A., Williamson, C., 2006. ”A Longitudinal
Study of P2P Traffic Classification”. In Proc. of Int.
Symposium on Modeling, Analysis and Simulation,
pp. 179-188.
Mochalski, K., Schulze, H., 2009. ”Deep Packet
Inspection. Technology, applications &
net neutrality”. White Paper. Available at
http://www.ipoque.com/resources/white-papers.
OpenDPI, 2011. http://www.opendpi.org
Segura, J.C, Rubio, A.J., Peinado, A.M., Garc´ıa, P., Rom´an,
R., 1994. ”Multiple VQ Hidden Markov Modelling
for Speech Recognition”. In Speech Communication,
vol. 14, no. 2, pp. 163-170.
Sen, S., Spatscheck, O., Wang, D., 2004. ”Accurate, Scal-
able In-Network Identification of P2P Traffic Using
Application Signatures”. In Proc. of the Int. Confer-
ence on World Wide Web, pp. 512-521.
Sen, S., Wang, J., 2004. ”Analyzing Peer-to-Peer Traffic
Across Large Networks”. In IEEE/ACM Transactions
on Networking, vol. 12, n. 2, pp. 219-232
Soysal, M., Schmidt, E.G., 2010. ”Machine Learning Al-
gorithms for Accurate Flow-Based Network Traffic
Classification: Evaluation and Comparison”. In Per-
formance Evaluation, vol. 67, n. 6, pp. 451-467.
Xuan-min, L., Jiang, P., Ya-jian, Z., 2010. ”A New P2P
Traffic Identification Model Based on Node Status”.
In Int. Conference on Management and Service Sci-
ence, pp. 1-4.
Yiran, G., Suoping, W., 2010. ”Traffic Identification
Method for Specific P2P Based on Multilayer
Tree Combination Classification by BP-LVQ Neural-
Network”. In Int. Forum on Information Technology
and Applications, pp. 34-38.
Yuan, R., Li, Z., Guan, X., Xu, L., 2010. An SVM-
based machine learning method for accurate internet
traffic classification. Information Systems Frontiers,
Springer-Verlag, V. 12, n. 2, pp. 149-156.
MULTIPLE VECTOR CLASSIFICATION FOR P2P TRAFFIC IDENTIFICATION
13
