
TEAM RADAR
Visualizing Team Memories
Cong Chen and Kang Zhang
Department of Computer Science, University of Texas at Dallas, 800 West Campbell Road, Richardson, U.S.A.
Keywords: Collaboration, Workspace Awareness, Visualization, Software Configuration Management.
Abstract: In distributed software teams, awareness information is often lost due to communication restrictions.
Researchers have attempted to retain team awareness by sharing change information across workspaces.
The major challenge is how to convey information to readers effectively while avoiding information
overload. In this paper, we address the benefit of delivering fine-grained awareness information, and present
a new technique and prototype implementation for its capture and visualization. We also discuss how visual
techniques and metaphors could promote user collaboration.
1 INTRODUCTION
Software development is in general a collaborative
activity. The complexity of the code itself and the
complexity of the activities and process of producing
it make such collaboration difficult (Herbsleb and
Grinter, 1999). One of the causes of these problems
is the lack of awareness, which is typically defined
as “an understanding of the activities of the others,
which provides a context for one’s own activities”
(Dourish and Bellotti, 1992).
In co-located teams, such information is
maintained either through informal interactions
among developers, such as monitoring each other's
activities, informal conversations, pair programming
sessions, and expert assistance (Hattori, 2010), or
through inspecting documents and source code,
shared in software configuration management
(SCM) systems.
When direct communication is restricted, e.g.,
the team is geographically distributed; people often
struggle with coordination and collaboration because
awareness information is lost. Moreover, studies
show that loss of awareness even affects developers’
willingness to collaborate and enthusiasm of work
(Herbsleb et al., 2000). In such a setting, people
have to take various alternative approaches to obtain
awareness. One of the most common sources of
awareness information is software repository, such
as SCM repository. Developers traditionally used an
SCM system to track and control changes of artifacts
by imposing concurrency control and version control
regulations. As it stores all relevant changes and
events in the project, researchers now find SCM
repository valuable to work as an organizational
memory that can be accessed to find out what other
developers have done (Herbsleb et al., 2000).
However, in terms of awareness, prevalent SCM
systems fail to offer sufficient level of awareness,
because their asynchronized propagating strategy
isolates local changes until developers manually
submit them. In order to alleviate this problem, and
“break bad isolation while retaining good isolation”
(Sarma et al., 2003), a number of researchers have
argued that the key to promote coordination among
de-located teams is increasing the level of awareness
and providing real-time information of ongoing
changes (Lanza et al., 2010).
We claim that awareness in SCM could be
enhanced with additional communication
mechanism that continuously exchanges information
between workspaces. Through this way, we could
also enrich the team memory by supplying the
existing software repository with additional
awareness information, and promote mining
software repositories (MSR) research to a fine-
grained level.
The main challenge we are facing now is how to
effectively convey sufficient amount of information
to readers while avoiding information overload. Our
solution is more intuitive visualization that shows
the most useful information to developers, and
appeals to them as much as possible. We developed
Team Radar, a workspace awareness supporting tool
based on Qt Creator (Nokia, 2008), an open source
114
Chen C. and Zhang K..
TEAM RADAR - Visualizing Team Memories.
DOI: 10.5220/0003464201140120
In Proceedings of the 6th International Conference on Evaluation of Novel Approaches to Software Engineering (ENASE-2011), pages 114-120
ISBN: 978-989-8425-57-7
Copyright
c
2011 SCITEPRESS (Science and Technology Publications, Lda.)

C++ IDE from Nokia. Team Radar monitors and
captures changes in local workspace and in SCM
repository, extracts and analyzes the embedded
awareness information, distributes it to other
workspaces, and finally presents it in a visually
attractive way.
The major innovation of our approach is that by
applying afterimage technique and radar metaphor,
we create a continuous and coherent team memory,
which blends past with present, and more efficiently
promote user collaboration.
2 RELATED WORK
There are a number of approaches in the community
attempting to improve workspace awareness by
enhancing existing SCM systems.
Palantir is an SCM enhancement that takes
awareness into account. Palantir informs a developer
of which other developers change which other
artifacts, calculates a severity measure of potential
conflict, and graphically displays the information.
Palantir does not intend to solve conflict problem by
itself. It simply makes developers aware of potential
conflict and relies on them to avoid it before it
happens. In CASI (Servant et al., 2010), the authors
propose an improved measuring model, called
Spheres of Influence, which shows developers which
source code entities are influenced by their changes.
The overlap of two developers’ Spheres of Influence
measures potential conflict.
An important aspect of software project is its
evolution. Gource (Caudwell, 2010) is a recent
project on evolution visualization, which differs
from previous work by clearly showing the structure
of the code and the relationships between artifacts
and authors. Gource takes a qualitative approach and
uses animation to visualize the flowing history of a
project. It renders the project structure as a dynamic
tree, generated with a force-directed tree layout
algorithm (Hadany and Harel, 1999). Nodes
represent files, and are connected to the tree by
edges. Currently contributing authors fly close to the
files, sending out beams to indicate their relations.
Socio-technical researchers have attempted to
unify artifacts and activities in their research, and
highlight the importance of identifying and tracking
the dynamic relationships between social and
technical dependencies. Augur (Froehlich and
Dourish, 2004) is one of the tools that combine
information about both artifacts and activities, and
explore their interdependency. Visually, Augur is
based on the line-oriented approach (Eick et al.,
1992), where each line of source code is presented
as a line of pixels colored to indicate some attributes
of the line, such as its author or revision history.
This line-oriented display provides a thumbnail view
(DeLine et al., 2006) of the code. The authors
studied how artifacts and activities intertwined in
open source projects, and discovered that software
artifacts could reveal the relationships between
technical and social structure.
Recent researches (Fitzpatrick et al., 2006)
reflect a move away from managing activities and
workflow per se to providing visualizations of
information that already exists in tools. Syde
(Hattori, 2010) follows this trend by integrating
awareness information visualization tightly into
existing IDEs. The author claims that despite of
prolific applications of supporting workspace
awareness, there is still no such a tool that provides
enough fine-grained change information, and
maintains a non-intrusive approach. Scamp (Lanza
et al., 2010), built upon the communication
infrastructure offered by Syde, extends Syde by
delivering awareness information with three
lightweight visualizations.
Our work is more or less inspired by previous
work. We use a similar architecture of Plantir. The
tree presentation of project structure comes from
Gource. We employ an informal approach as Gource
and Syde do. However, our approach differs from
them in the following ways: our visualization is
based on several new visual effects and metaphors,
which stimulate users’ imagination and engagement.
We support both real-time monitoring and offline
review, which is beneficial to development and
management.
3 TEAM RADAR
Team Radar is our infrastructure to enhance
workspace awareness. It is a client-server
application. The client is a set of Qt Creator plug-
ins, which monitors local changing events,
distributes them to all other workspaces, and finally
renders them on a virtual radar screen. The server
side acts as a communication center and a
standalone team memory, which complements
conventional SCM system’s function of supporting
awareness information.
3.1 Design Rationale
There are some important decisions we have made
in designing Team Radar, which reflect the rationale
TEAM RADAR - Visualizing Team Memories
115
and philosophy of our understanding of awareness
support. When facing difficulties in software
development, some previous work tends to offer all-
in-one solutions. That is why their tools
automatically inform users of their inference and
give exact instructions. While our philosophy is that
since most mistakes and failures are made by human
(Sandom, 2007), it is more appropriate to let human
make the final judgment. We believe that informal
awareness information helps formal processes to
work (Grinter, 1995). Hence, Team Radar takes an
informal and qualitative approach, and simply
visualizes extracted awareness information without
distracting developers from their main work.
Another important issue of designing awareness
supporting systems is whether the system is intended
for retrospective analysis of historical data, or it is
used to analyze a project currently in progress. Of
course, each approach has its own advantages. Most
previous work, however, focuses more on either
aspect of the project over the other. In our solution,
we attempt to offer users a consistent and coherent
team memory by unifying both past and present
information in one visualization. Developers can use
Team Radar to monitor coworkers’ activities and
coordinate collaboration, while managers may
review and analyze the project by replaying the
event scripts stored in Team Rader.
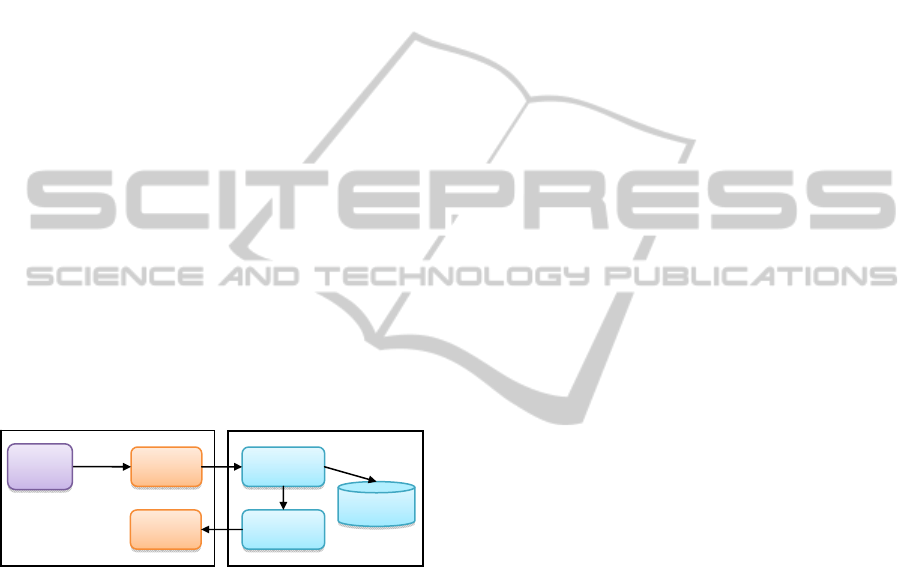
Figure 1: Team Radar Architecture.
3.2 Architecture
Figure 1 shows the architecture of Team Radar,
which adopts the design of previous work (Sarma
and van der Hoek, 2002). The system is an extension
of Qt Creator. The client is a collection of Qt Creator
plug-ins. Qt Creator relies on signals to propagate
events. The collector is such a plug-in that connects
to its interested signals, and is notified when these
signals are emitted. The viewer is the visualization
component that presents awareness information to
users with animations. On the server side, which
resides on a separated site, the receiver listens and
accepts events from clients’ collectors, stores them
into an extra repository, and then asks the distributor
to broadcast them to other clients’ viewers. The
viewer can also retrieve the event scripts in the
repository and replay them offline. Offline playback
enables managers to inspect daily activities, review
the process and analyze collaboration issues.
3.3 Capturing Local Events
Based on Gutwin’s knowledge elements of
awareness (Gutwin, 1998), workspace should track
several types of awareness information, categorized
by “how, when, who, where, and what” questions. In
addition, a survey conducted in Microsoft shows that
the majority of information needs are about
discovering, meeting, and keeping track of people,
not just code (Begel et al., 2010). Hence, our work
focuses more on tracing what developers are
working or have worked on, rather than what
specific changes they have made. In more detail, we
address these aspects of collaboration:
Working mode. As a typical software development
scenario, developers switch back and forth
among several activities, or working modes in Qt
Creator, including designing, coding, testing,
debugging, reading documents, etc. Working
mode could also label current progress of the
project. No matter what process model the
project follows, in different phases of the project,
developers carry out each type of activity with
various emphasis and intensity. In earlier phases,
developers take more time in designing and
coding mode, while in later phases, more effort
will be put to testing and debugging.
Current changes. It is important that developers
have the notion of who else is working on the
same artifacts or those artifacts closely related.
Failing to acquire such information may lead to
duplicated work, merge conflicts, and perhaps
build failure (Hattori, 2010). Showing developers
what artifacts others are changing gives them an
early warning of potential conflict.
Past changes. In a software project, knowledge of
others' activities, both past and present, has equal
value for assisting the overall cohesion and
effectiveness of the team. Observation of the
evolution of a project helps to understand the
history and rationale behind the code. Knowing
who has worked most often or most recently on a
particular file aids to identify members’
contribution and locate expert assistance
(Schneider et al., 2004).
Though the significance of fine-grained information
in tracing and coordinating activities is largely
accepted, the granularity still needs to be tuned
based on its particular application. In our case, we
Collector
Viewer
Receiver
Distributor
Repository
signals
Client
Server
Qt
Creator
ENASE 2011 - 6th International Conference on Evaluation of Novel Software Approaches to Software Engineering
116
take an informal and qualitative approach, which do
not require highly detailed information. Thus, Team
Radar does not capture atomic changes, such as what
character the developer has inputted, which line of
code was edited, or any changes to the abstract
syntax tree (Neamtiu et al., 2005). It simply captures
some basic events in local workspaces, including
client logging in and out, opening and closing
project, editing file, and changing working mode.
Editing file refers to any write operations to artifacts,
because usually developers are not interested in
others’ read-only activities.
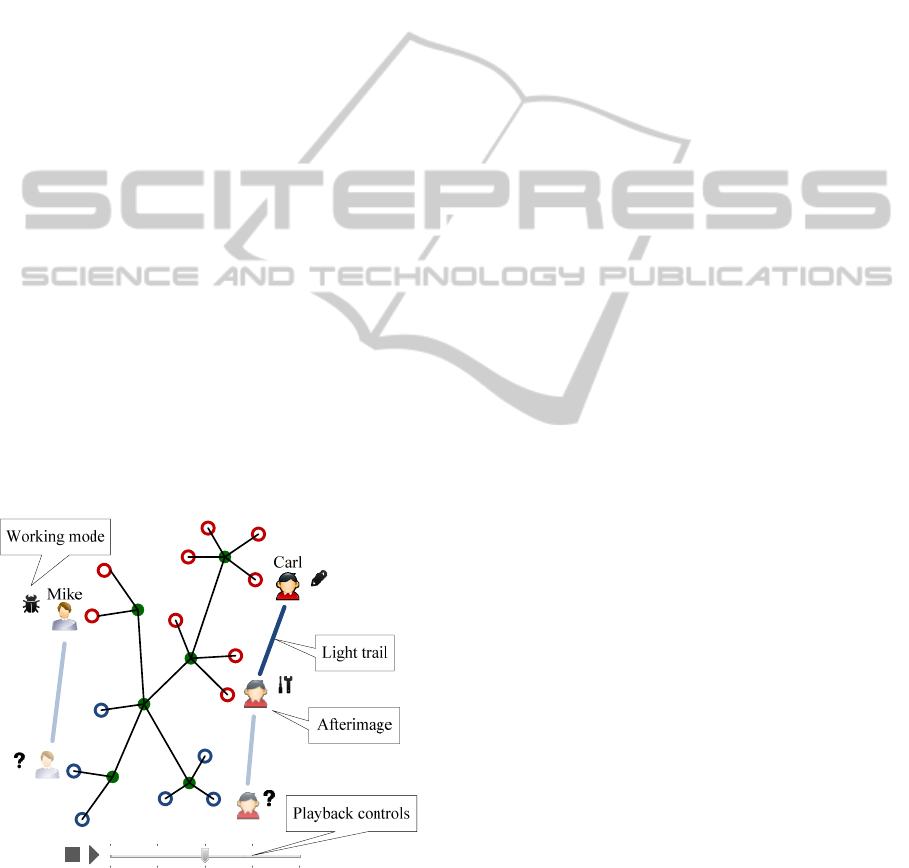
3.4 Visualization
Figure 2 illustrates the conceptual model of our
animated visualization. Team Radar adopts a similar
tree structure used by Gource to present the structure
of a project. The tree is dynamically generated by a
force-directed layout algorithm (Hadany and Harel,
1999). Non-leaf nodes represent directories and are
connected to the tree by edges. Leaf nodes denote
files colored by their types. Each online developer is
shown as an icon. When a developer is making
changes to a file, his icon flies close to the
corresponding tree node and indicates the artifact he
is working on. When an icon moves, its afterimage
stays, and a light trail shows its track. The tag beside
developer’s icon shows current working mode he is
in. All local events are stored in the central
repository as event scripts, which drive the
animation and allow user to retrieve and replay.
Figure 2: Team Radar visualization. The icon represents
the location a developer is working on. Afterimages and
light trials show the path he has gone through.
3.5 Metaphors
We believe that metaphor is a key factor to
successful software visualization. In order to create a
virtual environment that promotes user’s perception
and engagement, as well as to increase information
density, Team Radar adopts two metaphors in its
visualization based on afterimage technique.
Afterimage, or visual aftereffect, is an optical
illusion that refers to an image continuing to stay in
one's vision after the original image is removed.
Neural biologists now generally agree that
aftereffects are not mere by-products of “fatiguing
neurons”, but reflect neural strategies for optimizing
perception (Thompson and Burr, 2009). There is
also evidence that afterimage stimulates eyes to
track motion smoothly (Heywood and Churcher,
1971). Afterimage is a critical technique to
implement our metaphors. We argue that afterimage
technique, which embodies past and present
information in our visualization, helps to stimulate
user’s interests and engagement.
Radar is an important component of battlefield
awareness, a similar problem to workspace
awareness, which refers to knowledge of everything
occurring on the battlefield (Fennell and Wishner,
1998). On a typical radar screen, positions of targets
are displayed as moving blips, sometimes with light
trails showing their courses and directions.
Similarly, Team Radar alerts developers where
others were and are working on. We use radar
metaphor to create a notion that monitoring software
team is just like observing a radar screen. In Team
Radar, the tree layout mimics the polar coordinates
of a radar system, icons simulate the blips of radar
targets, and more interestingly, when an icon moves,
its light trail shows the afterimage of the course.
Memory metaphor refers to a common sense that
“the older the memory is, the vaguer the image
appears in the mind”. As mentioned above, when the
icon flies to a new position, the afterimage of the
icon and the light trail remains on the screen and
fades out through time, mimicking a passing
memory. The afterimage eventually disappears, and
how long this process takes is configurable,
depending on how much past information the user
intends to observe. Memory metaphor produces an
illusory environment that allows users to traverse
between past and present.
4 DISCUSSION
There are still some challenges we are facing now
TEAM RADAR - Visualizing Team Memories
117
when implementing Team Radar. Major issues we
concern are performance, scalability, and privacy.
Performance concern stems from the layout
algorithm we choose. Though aesthetically
appealing and flexible, the classic force-directed
layout algorithm does not scale well. Most variants
of it has the worse running time of O(|V|
3
), |V| being
the number of vertices (Hadany and Harel, 1999). In
our application, however, since the graph is a
hierarchical tree, we utilize the local nature of the
sub-trees and develop a simplified multi-scale force-
directed layout algorithm (Hadany and Harel, 1999),
which takes into account only siblings in the same
sub-tree and the ancestors when relocating a node.
Furthermore, Team Radar can save the layout of the
tree and load it the next time, which means the
layout delay only bothers the user for the first time
he joins the project. The most effective measure we
take to handle performance issue is along-the-path-
expansion. Programmers’ behavior also exhibits
certain local nature (Kersten and Murphy, 2006): no
matter how the project scales, one programmer
usually works on a small subset of the artifacts.
Therefore, there is no need to expand the whole tree.
Initially, Team Radar only loads the root of the tree.
When a user opens a file, Team Rader will
automatically expand the nodes in the path from the
root to the file, and keep other nodes folded.
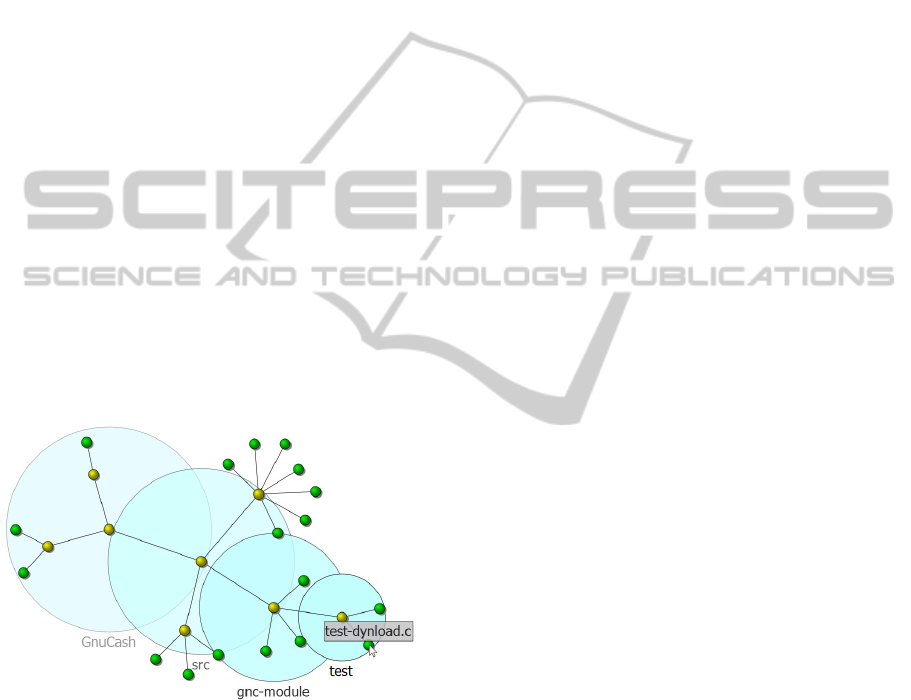
Figure 3: Improved force-directed layout showing the
subset of artifacts a programmer is working on. Yellow
nodes are directories, and green nodes are files. Labels are
turned on (blue halos for directories, and tags for files)
when the user opens a file.
Scalability of a visualization is often affected by
excessive information. Along-the-path-expansion
could significantly improve the scalability of the
system by showing a minimal subset of the nodes.
Labeling is another factor to the viewability of our
visualization. Displaying all the names of the nodes
would overwhelm the screen, as some of the names
could be very long. Team Radar only shows the
labels of the nodes in the path from the root to the
file currently editing. Figure 3 illustrates the
preliminary implementation of aforementioned
concepts.
Developers can protect their privacy using two
types of event filters: incoming filter and outgoing
filter. The incoming filter defines what kind of
events and whose events will be received, which
helps the user to concentrate on his interested events
and coworkers. The outgoing filter defines what
kind of events will be broadcasted. Developers could
agree on the configuration of filters based on their
organizational culture.
5 CURRENT STATUS
AND FUTURE WORK
We carry out the project in three steps. The first step
it to build an event capturing and distributing system
that share local events throughout the team. The
second step it to render the information received by
local viewer with animation. This part is still in
progress. Currently, Team Radar shows events as
textual scripts, which are then used to drive and
playback the animation. Figure 4 and 5 demonstrate
how the current system works. Finally, in case study,
we plan to apply Team Radar to some real projects
and evaluate how it could promote collaboration.
After we have accumulated enough first-hand data,
we will attempt to mine this fine-grained repository
and discover how developers collaborate in a level
that is more detailed.
6 CONCLUSIONS
In this paper, we report our ongoing work to
promote team awareness and stimulate collaboration
in the context of distributed software development.
Basic infrastructure and prototype have been built
and tested. The novelty of our approach is that with
afterimage technique and radar metaphor, our
visualization integrates both past and present
information at the same time, which we believe
would achieve a better balance of the tradeoff
between providing more information and avoiding
information overflow. A future contribution we
foresee is that we would take MSR research into a
deeper level by mining fine-grained information we
collect in the repository.
ENASE 2011 - 6th International Conference on Evaluation of Novel Software Approaches to Software Engineering
118
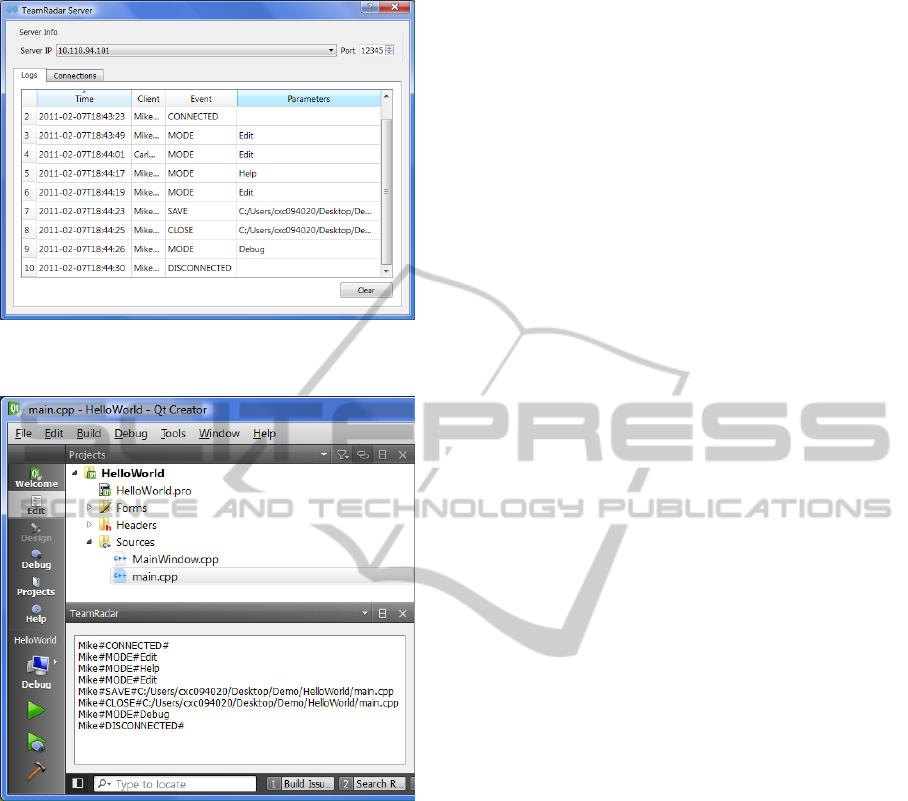
Figure 4: Team Radar server. Project events compose
team memory that can be retrieved and replayed.
Figure 5: Team Radar client. Peers’ activities are shown as
textual scripts that will drive the animation.
REFERENCES
Begel, A., Khoo, Y. P., and Zimmermann, T. (2010).
Codebook: Discovering and Exploiting Relationships
in Software Repositories. In Proceedings of the 32nd
ACM/IEEE International Conference on Software
Engineering - Volume 1, Cape Town, South Africa.
Caudwell, A. H. (2010). Gource: Visualizing Software
Version Control History. In Proceedings of the ACM
International Conference Companion on Object
Oriented Programming Systems Languages and
Applications Companion, Reno/Tahoe, Nevada, USA.
DeLine, R., Czerwinski, M., Meyers, B., Venolia, G.,
Drucker, S., and Robertson, G. (2006). Code
Thumbnails: Using Spatial Memory to Navigate
Source Code. In Proceedings of 2006 IEEE
Symposium on Visual Languages and Human-Centric
Computing, Brighton, UK.
Dourish, P. and Bellotti, V. (1992). Awareness and
Coordination in Shared Workspaces. In Proceedings
of the 1992 ACM Conference on Computer-Supported
Cooperative Work, Toronto, Ontario, Canada.
Eick, S. G., Steffen, J. L., and Eric E. Sumner, J. (1992).
Seesoft-A Tool for Visualizing Line Oriented
Software Statistics. IEEE Transaction on Software
Engineering, 18(11), 957-968.
Fennell, M. T. and Wishner, R. P. (1998). Battlefield
awareness via Synergistic SAR and MTI Exploitation.
Aerospace and Electronic Systems Magazine, IEEE,
13(2), 39-43.
Fitzpatrick, G., Marshall, P., and Phillips, A. (2006). CVS
Integration with Notification and Chat: Lightweight
Software Team Collaboration. In Proceedings of the
20th Anniversary Conference on Computer Supported
Cooperative Work, Banff, Alberta, Canada.
Froehlich, J. and Dourish, P. (2004). Unifying Artifacts
and Activities in a Visual Tool for Distributed
Software Development Teams. In Proceedings of the
26th International Conference on Software
Engineering, Edinburgh International Conference
Centre, Scotland, UK.
Grinter, R. E. (1995). Using a Configuration Management
Tool to Coordinate Software Development. In
Proceedings of Conference on Organizational
Computing Systems, Milpitas, California, USA.
Gutwin, C. A. (1998). Workspace Awareness in Real-Time
Distributed Groupware. University of Calgary.
Hadany, R. and Harel, D. (1999). A Multi-Scale
Algorithm for Drawing Graphs Nicely. In Proceedings
of the 25th International Workshop on Graph-
Theoretic Concepts in Computer Science.
Hattori, L. (2010). Enhancing Collaboration of Multi-
developer Projects with Synchronous Changes. In
Proceedings of the 32nd ACM/IEEE International
Conference on Software Engineering - Volume 2,
Cape Town, South Africa.
Herbsleb, J. D. and Grinter, R. E. (1999). Architectures,
Coordination, and Distance: Conway's Law and
Beyond. IEEE Software, 16(5), 63-70.
Herbsleb, J. D., Mockus, A., Finholt, T. A., and Grinter,
R. E. (2000). Distance, Dependencies, and Delay in a
Global Collaboration. In Proceedings of the 2000
ACM Conference on Computer Supported Cooperative
Work, Philadelphia, Pennsylvania, USA.
Heywood, S. and Churcher, J. (1971). Eye Movements
and the Afterimage—I. Tracking the Afterimage.
Vision Research, 11(10), 1163-1168.
Kersten, M. and Murphy, G. C. (2006). Using Task
Context to Improve Programmer Productivity. In
Proceedings of the 14th ACM SIGSOFT international
symposium on Foundations of software engineering,
Portland, Oregon, USA.
Lanza, M., Hattori, L., and Guzzi, A. (2010). Supporting
Collaboration Awareness with Real-time Visualization
of Development Activity. In Proceedings of 14th
IEEE European Conference on Software Maintenance
TEAM RADAR - Visualizing Team Memories
119

and Reengineering, Madrid, Spain.
Neamtiu, I., Foster, J. S., and Hicks, M. (2005).
Understanding Source Code Evolution Using Abstract
Syntax Tree Matching. In Proceedings of the 2005
International Workshop on Mining Software
Repositories, St. Louis, Missouri.
Nokia. (2008). Qt Creator. Available at: http://qt.
nokia.com/products/developer-tools/
Sandom, C. (2007). Success and Failure: Human as Hero –
Human as Hazard. In Proceedings of the 12th
Australian Workshop on Safety Critical Systems and
Software and Safety-related Programmable Systems,
Adelaide, Australia.
Sarma, A., Noroozi, Z., and van der Hoek, A. (2003).
Palantir: Raising Awareness among Configuration
Management Workspaces. In Proceedings of the 25th
International Conference on Software Engineering,
Portland, Oregon, USA.
Sarma, A. and van der Hoek, A. (2002). Palantir:
Coordinating Distributed Workspaces. In Proceedings
of the 26th Annual International Computer Software
and Applications Conference, Oxford, England, UK.
Schneider, K., Gutwin, C., Penner, R., and Paquette, D.
(2004). Mining a Software Developer's Local
Interaction History.
Servant, F., Jones, J. A., and Hoek, A. v. d. (2010). CASI:
Preventing Indirect Conflicts Through a Live
Visualization. In Proceedings of the 2010 ICSE
Workshop on Cooperative and Human Aspects of
Software Engineering, Cape Town, South Africa.
Thompson, P. and Burr, D. (2009). Visual Aftereffects.
Current Biology, 19(1), 11-14.
ENASE 2011 - 6th International Conference on Evaluation of Novel Software Approaches to Software Engineering
120
