
STEREO VISION MATCHING OVER SINGLE-CHANNEL
COLOR-BASED SEGMENTATION
Pablo Revuelta Sanz
1
, Belén Ruiz Mezcua
1
, José M. Sánchez Pena
1
and Jean-Phillippe Thiran
2
1
Carlos III University of Madrid, Spanish Center for Captioning and Audiodescription (CESyA)
Av. Peces Barba, 1, 28918 Leganés, Madrid, Spain
2
Signal Processing Laboratory (LTS5), École Polytechnique Fédéral de Lausanne (EPFL)
Station 11, CH1015 Lausanne, Switzerland
Keywords: Segmentation, Single-channel, Depth map, Stereovision.
Abstract: Stereo vision is one of the most important passive methods to extract depth maps. Among them, there are
several approaches with advantages and disadvantages. Computational load is especially important in both
the block matching and graphical cues approaches. In a previous work, we proposed a region growing
segmentation solution to the matching process. In that work, matching was carried out over statistical
descriptors of the image regions, commonly referred to as characteristic vectors, whose number is, by
definition, lower than the possible block matching possibilities. This first version was defined for gray scale
images. Although efficient, the gray scale algorithm presented some important disadvantages, mostly related
to the segmentation process. In this article, we present a pre-processing tool to compute gray scale images
that maintains the relevant color information, preserving both the advantages of gray scale segmentation and
those of color image processing. The results of this improved algorithm are shown and compared to those
obtained by the gray scale segmentation and matching algorithm, demonstrating a significant improvement
of the computed depth maps.
1 INTRODUCTION
Stereo vision is a common procedure used to obtain
a 3D representation of a scene where the information
is provided from two different image projections of
the same scene. This particular process is carried out
automatically by human vision. However,
implementing this technique in a computer vision
system presents many diverse problems which will
be discussed throughout this study.
All multi and stereo view vision based
approaches must take into consideration a process
known as Matching. This consists in identifying the
same physical points in different images (Pons and
Keriven, 2007). The difference between these
images is referred to as the disparity, from which the
depth information can be recovered.
We propose in this paper an improvement of a
previous work (Revuelta Sanz et al., 2010b). In this
previous work, stereo vision has been achieved by
matching the region descriptors instead of matching
blocks or edges located in both images. Regarding
color images matching, algorithms found in the
literature show to have important computational
load, whichever is the color space chosen to process
the image (see (Kuan et al., 2008; Mushrif and Ray,
2008; Ozden and Polat, 2007) for examples). The
segmentation and the descriptors extraction of each
region were obtained by means of a region growing
and indexing algorithm (Revuelta Sanz et al.,
2010a), gray scale based. The contribution to this
algorithm is the inclusion of color information in the
region growing process, and our results will only be
compared to those obtained with the gray scale
version. The goal of this complementary
functionality is to take advantage of the color
information in image segmentation, improving the
depth maps accuracy, while preserving the
simplicity of the gray scale approach.
This paper is organized as follows. After this
introduction, section 2 explains the details of the
proposed pre-processing tool. In the same section
the effects of this pre-processing are shown. In
section 3, the segmentation and matching process of
pairs of images is described. Results of the
application of the described algorithm are shown in
section 4, and discussed in section 5, comparing
126
Revuelta Sanz P., Ruiz Mezcua B., M. Sánchez Pena J. and Thiran J..
STEREO VISION MATCHING OVER SINGLE-CHANNEL COLOR-BASED SEGMENTATION.
DOI: 10.5220/0003473201260130
In Proceedings of the International Conference on Signal Processing and Multimedia Applications (SIGMAP-2011), pages 126-130
ISBN: 978-989-8425-72-0
Copyright
c
2011 SCITEPRESS (Science and Technology Publications, Lda.)
these results with those obtained by the gray scale
version of the algorithm.
2 COLOR IMAGE PROCESSING
The field of research referred to as color image
processing has been widely studied over the past few
decades, this is partly due to the fact that it is closely
related to the process of human vision (Millán and
Valencia, 2006). However, several different
parameters must be considered when this
segmentation is to be performed on gray scale
(Zhang et al., 2007) and color images (Kuan, Kuo, &
Yang, 2008).
The color is commonly presented as the
combination of three components, Red-Green-Blue
(RGB). Other possibilities come from transpositions
of this space into three other coordinates, such as
YIQ or YUV, HSL, HSV, etc. The basic principles
of the improved and novel algorithm proposed in
this paper are listed as follows:
• Not every bit of a pixel carries the same
information: most relevant bits have more
information than the least bits.
• During the process of image segmentation it is
only important to compare relevant
information.
• A pseudo-color image (PCI from hereinafter)
can be built from a color image and maintains
the majority of the advantages associated with
both color and gray scale segmentation.
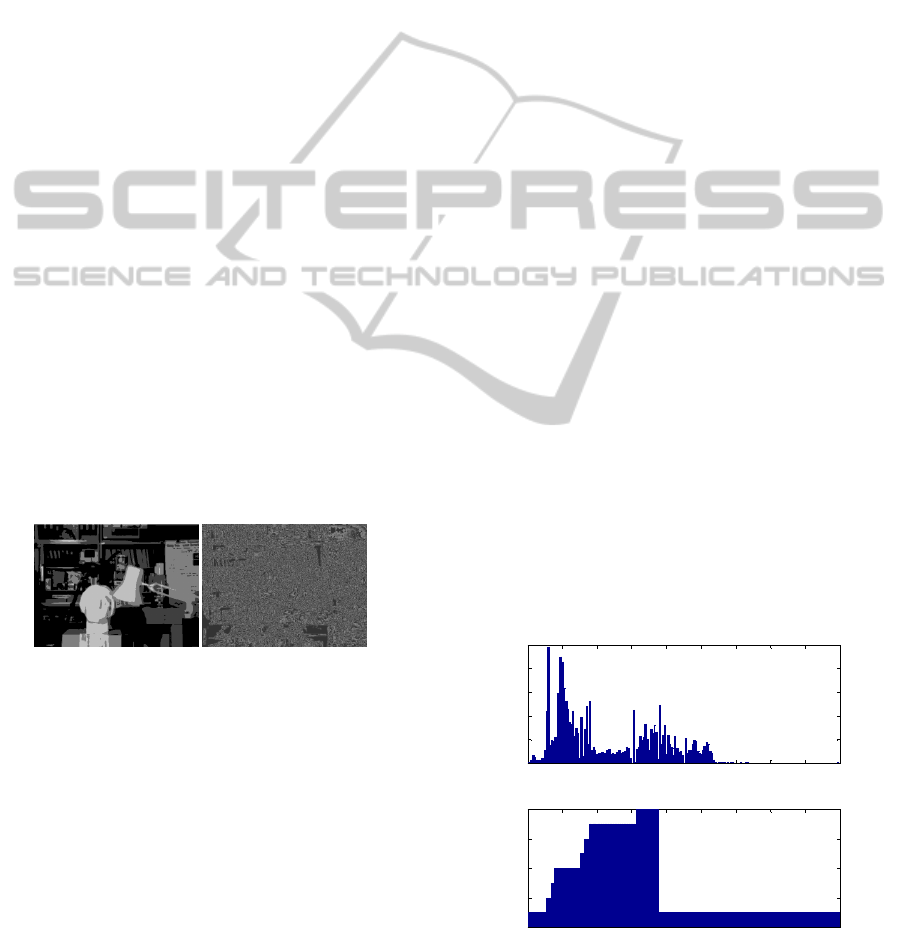
(a) (b)
Figure 1: Two most (a) and least (b) significant bits of the
red channel acquired from the Tsukuba right image.
These facts allow reducing the complexity of the
segmentation process, while at the same time
maintains the most relevant color features. For that
purpose, we identify the dominant colors in an
image, and set the rest of the bits with information
regarding relevant color levels. This process can be
carried out using the following steps: RGB
conversion to Hue, Saturation and Value (HSV)
color space, color clustering with the hue component
(assigning homogeneous values to pixels when their
color is close enough) and calculation of the pseudo-
color gray scale image. These images will be
segmented and matched as explained in (Revuelta
Sanz, Ruiz Mezcua, Sánchez Pena, & Thiran,
2010b). This is done with the following instructions:
counts=INF;
while(counts > MAX_NUM_OF_COLORS)
counts=0;
Variation_Threshold++;
for 0 < i < 360, do:
newHistogram[i] = counts;
if histogram[i] is local minima [i] with
variation > Variation_Threshold, do:
counts++;
else
if histogram[i] is isolated color
component with level > Level_Threshold, do:
counts++;
end if;
end if;
end for;
end while;
The maximum number of colors
(MAX_NUM_OF_COLORS) is a constant that
forces the threshold increase of the local minima
variation to fit the palette of colors to the desired
one. The Variation_Threshold variable is originally
set to 100, and incremented in steps of 100.
Although, this is not a crucial data since it will be
adjusted in the iterative loop.
The newHistogram array stores the same H value
until the algorithm finds a local minima or an
isolated group of colors above another threshold,
when counts increases its value representing a new
color. Figure 2 presents both the hue component of
and histogram (ranged in 180º) and the
corresponding LUT after the transformation. As
presented in figure 2, the array obtained may not be
considered as a proper histogram, but as a 1D-LUT
where a value (ranging between 1 and 8) is assigned
to every Hue value of each pixel in the original
image. Originally gray pixels will be processed in a
gray scale format.
Figure 2: (up) Original histogram of Tsukuba right image
(ranged [1:180], horizontal axis) and (down) Clustered
Look-Up-Table to 8 colors (ranged [1,8], vertical axis).
0 20 40 60 80 100 120 140 160 180
0
1000
2000
3000
4000
5000
Original hue histogram
hue value
num. pixels
0 20 40 60 80 100 120 140 160 180
0
2
4
6
8
Clustered hue LUT
original hue value
final hue value
STEREO VISION MATCHING OVER SINGLE-CHANNEL COLOR-BASED SEGMENTATION
127
The complete transformation for each pixel is as
follows:
if O(Si,j) > SAT_THRESHOLD & O(Vi,j) >
VAL_THRESHOLD, do:
F(Hi,j) = O(Hi,j);
F(Si,j) = 255;
F(Vi,j) = O(Vi,j)&MASK;
else
F(Hi,j) = O(Hi,j);
F(Si,j) = 0;
F(Vi,j)
= O(Vi,j)&MASK;
end if;
In this pseudo code, the terms O(…) and F(…)
are the original and final images, respectively. H
i,j
,
S
i,j
and V
i,j
are the Hue, Saturation and Value
component , respectively, of the (i-th,j-th) pixel and
MASK is the constant that maintains the two MSBs
rejecting the rest ones. The result of the
aforementioned process is the conversion of the
original image to a scalar image. Figure 3 illustrates
two representations of the final PCI image (false
colors have been introduced to aid visual
perception). Since the level of Saturation has been
reduced to one bit (whether or not it is completely
saturated), the color palette is forced to be
represented by 8 colors. As effect of the minimum
saturation constraint, some pixels are left in gray
scale. The Value of every pixel is truncated to its
two MSBs, the complete pixel information can thus
be stored in 6 bits, which maintain the most relevant
information of each pixel. As a result, a gray-scale
image can be built, which is then segmented as a non
ambiguous gray scale image, as shown in figure 3.b.
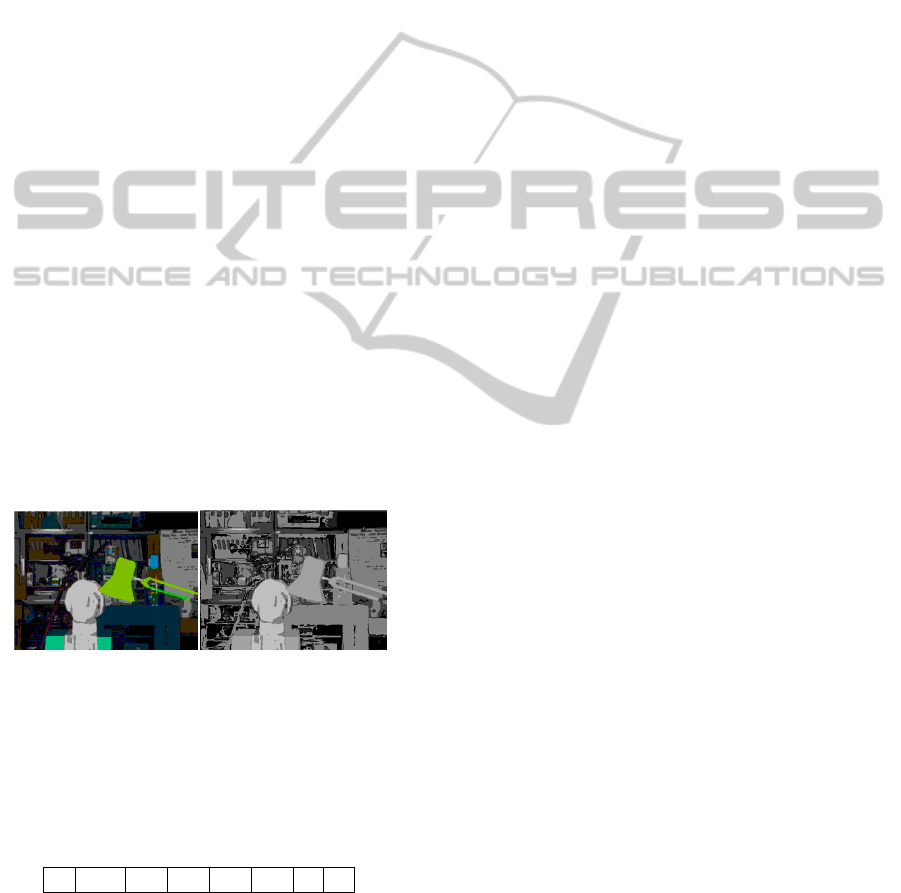
(a) (b)
Figure 3: (a) Tsukuba right image after color clustering (1
byte/pixel). False color representation. (b) PCI shown in a
gray scale image.
In these images, each byte has the following
structure:
Table 1: Clustered pseudo color byte structure.
S C
1
C
2
C
3
V
8
V
7
0 0
In this table, S is the saturation bit, C
x
the
descriptor of the dominant color (allowing 8
different colors) and V
8
and V
7
the two MSB of the
Value component. It is important to notice that this
transform is not equivalent to a Euclidean distance
measurement in any color space. Moreover, its non-
linear transform allows an important save of
memory and computational load, maintaining
important information.
3 PCI SEGMENTATION AND
MATCHING
We present herein an analysis of the segmentation
process required in computer vision. This task has
been used to separate different regions or areas
located within the same image of support Ω (Pham
et al., 2000):
∑
=
=Ω
K
k
k
S
1
(1)
In this equation, S
k
represents the k-th region and
S
k
∩ S
j
=Ø for k≠j. When applied to binary images
the process of segmenting demonstrates no
interpretation uncertainties. However, several
different parameters must be considered when this
segmentation is to be performed on gray scale
(Zhang, Xiong, Zhou, & Wong, 2007) and color
images (Kuan, Kuo, & Yang, 2008).
The segmentation and matching is done with the
algorithm presented in (Revuelta Sanz, Ruiz
Mezcua, Sánchez Pena, & Thiran, 2010b). The main
advantage of the segmentation process is that it
allows statistical descriptors to be extracted from
every region on the fly thus reducing the
computational cost as each pixel is only processed
once. A detailed description of the extraction
features may be found in (Revuelta Sanz, Ruiz
Mezcua, & Sánchez Pena, 2010a).
4 RESULTS
The pre-processing and segmentation procedures
have been implemented using an OpenCV library
along with a specific C program designed for this
particular application. To verify the reliability of this
procedure, it has been applied to the Tsukuba pair of
color images, which have a resolution of 384x288
pixels. Figure 4 shows the real depth map and the
computed one.
SIGMAP 2011 - International Conference on Signal Processing and Multimedia Applications
128
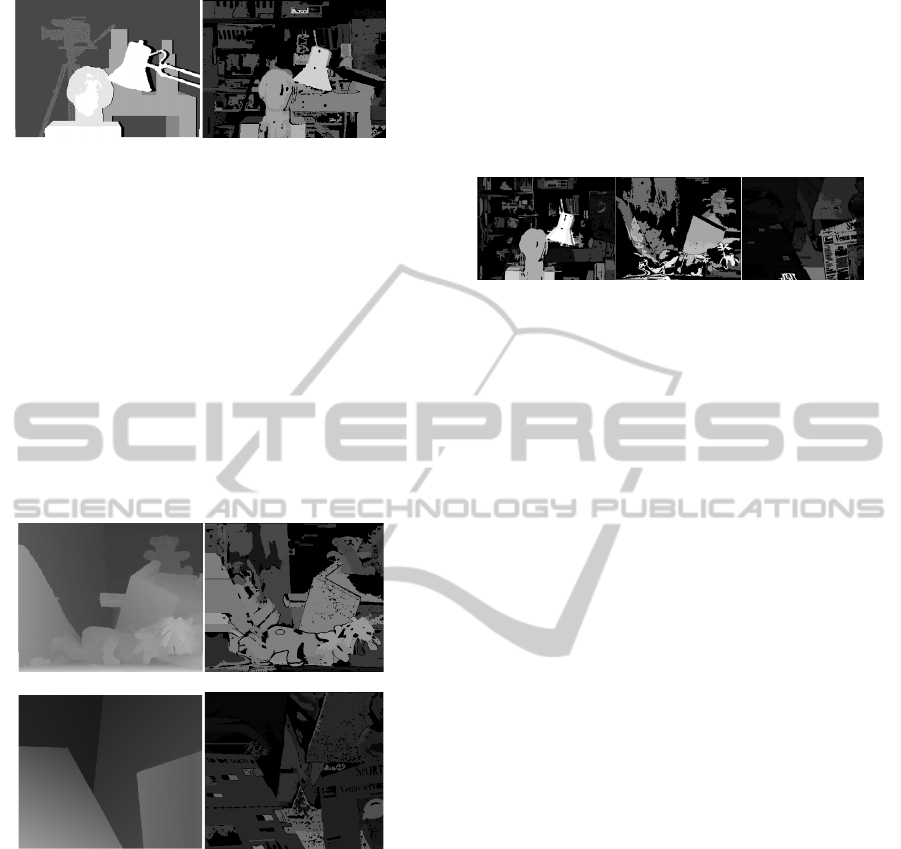
(a) (b)
Figure 4: (a) Real depth of Tsukuba images. In black, the
occluded parts. (b) The computed depth map. In black,
unmatched regions and occluded parts.
The time required by the algorithm to obtain this
result is 77.4 ms (12 fps), achieving a real-time
performance. The quantitative results, obtained by
means of the Middlebury web page (Middlebury,
2010), show that the error in non-occluded pixels
achieves the 46.9% of pixels for a threshold of 2.
Further tests on different color standard image
pairs have also been carried out, using the same
database. Image processing results on each image of
the Teddy and Venus pairs are presented in the
following figure, close to the true depth maps.
(a) (b)
(c) (d)
Figure 5: (a) Teddy true and (b) computed depth map. (c)
Venus true and (d) computed depth map.
In these cases, the time required to compute the
depth maps is 114.2 ms (8 fps) for the Teddy image,
and 111.8 ms (8 fps) for the Venus image. In these
cases, the error in non-occluded pixels (“nonocc” in
the database notation) for the Teddy and Venus
image pairs is 60 and 77.2%. These results are
discussed in the following section.
5 DISCUSSION
The main goal of the pre-processing and color
clustering algorithm has been achieved. We propose
now a qualitative comparative analysis between the
proposed algorithm for color images and the
previously developed algorithms applied to gray
scale images (Revuelta Sanz, Ruiz Mezcua, Sánchez
Pena, & Thiran, 2010b). The depth map computed
using truncated gray scale images on the same set of
image pairs are presented in the following figure 6.
(a) (b) (c)
Figure 6: Segmentation based on gray scale version of (a)
Tsukuba, (b) Teddy and (c) Venus images pairs (Revuelta
Sanz, Ruiz Mezcua, Sánchez Pena, & Thiran, 2010b).
The errors appreciated in this figure are a result
of the lack of information of the gray scale image.
By using the color based algorithm presented in
this paper most of these errors have been corrected.
All remaining results are seen to improve when
using the novel color-based algorithm, where more
detailed depth maps have been obtained. However
several errors are still present which are related to
the segmentation process. An example of such errors
may be observed and measured in the different areas
of the left panel of the Venus pair, which provoke
errors shown in figure 5.d. These can be explained
by the nature of the segmentation algorithm. As the
areas with the same value (regardless of the image
being in gray or color scales) are processed as being
the same region, any depth differences within the
same region have not been computed, and only a
mean value is provided. This particular effect may
also be appreciated when observing the floor of
figure 5.b. Additionally, some differentiated areas
inside this panel (color blocks, for example) have
been processed as different regions thus, the depth
has been computed separately. Finally, the high rate
of errors measured in images 5.b and 5.d are also
due to the following reason: the depth is computed
from the difference of the centroids horizontal
coordinate in both images. This centroid can be
displaced if the segmentation in one image includes
some parts that are not included in the corresponding
image and region segmentation. Hence, the centroid
different appears to be different of the exact value
and, finally, all pixels segmented and labelled as
belonging to that region will have a depth value
slightly distorted but big enough to compute as
errors.
To conclude, the additional information provided
by color images is advantageous when an improved
STEREO VISION MATCHING OVER SINGLE-CHANNEL COLOR-BASED SEGMENTATION
129

segmentation algorithm is to be implemented. The
main problems associated with such color-based
segmentation, i.e. three-channel processing, has been
solved by the composition of a pseudo-color image
which preserves the critical information within a
single channel, where no additional computational
load is required for the segmentation process.
ACKNOWLEDGEMENTS
This work has been partially supported by
Comunidad de Madrid (grant no. S2009/ESP-1781).
Additionally, we would like to acknowledge the
student grant offered by the Universidad Carlos III
de Madrid and the CESyA, which has also
contributed to this research work to be performed.
REFERENCES
Middlebury Database. 2010. http://vision.middlebury.edu/
stereo/data/
Kuan, Y.-H., Kuo, C.-M., & Yang, N.-C., 2008. Color-
based image salient region segmentation using novel
region merging strategy. IEEE transactions on
multimedia 10[5], 832-845.
Millán, M. S. & Valencia, E., 2006. Color image
sharpening inspired by human vision models. Applied
Optics 45[29], 7684-7697.
Mushrif, M. M. & Ray, A. K., 2008. Color image
segmentation: Rough-set theoretic approach. Pattern
recognition letters 29[4], 483-493.
Ozden, M. & Polat, E., 2007. A color image segmentation
approach for content-based image retrieval. Pattern
recognition 40[4], 1318-1325.
Pham, D. L., Xu, C., & Prince, J. L., 2000. Current
Methods in Medical Image Segmentation. Annual
Review of Biomedical Engineering 2, 315-337. Annual
Reviews Inc.
Pons, J.-P. & Keriven, R., 2007. Multi-View Stereo
Reconstruction and Scene Flow Estimation with a
Global Image-Based Matching Score. International
Journal of Computer Vision 72[2], 179-193.
Revuelta Sanz, P., Ruiz Mezcua, B., & Sánchez Pena, J.,
2010a. M. Efficient Characteristics Vector Extraction
Algorithm using Auto-seeded Region-Growing.
Proceedings of the 9th IEEE/ACIS International
Conference on Computer and Information Science
ICIS 2010, 215-221.
Revuelta Sanz, P., Ruiz Mezcua, B., Sánchez Pena, J. M.,
& Thiran, J.-P. 2010b, Stereo Vision Matching using
Characteristics Vectors EPFL-REPORT-150511.
Zhang, K., Xiong, H., Zhou, X., & Wong, S., 2007. A 3D
Self-Adjust Region Growing Method for Axon
Extraction. Image Processing, 2007. ICIP 2007. IEEE
International Conference on 2[II], 433-436. San
Diego, California, IEEE Signal Processing Society.
SIGMAP 2011 - International Conference on Signal Processing and Multimedia Applications
130
