
PCN: QUANTIFYING LEARNING ACTIVITY FOR
ASSESSMENT BASED ON TIME-SERIES COMMENTS
Kazumasa Goda
Faculty of Management and Information Sciences, Kyushu Institute of Information Sciences, 6-3-1 Saifu, Dazaifu, Japan
Tsunenori Mine
Faculty of Information Science and Electrical Engineering, Kyushu University, 744 Motooka Nishiku, Fukuoka, Japan
Keywords: User model, Freestyle comments, Time series sentences, Learning activity inference, PCN Method.
Abstract: Learning activity plays important role in enhancing one’s knowledge and skill. There are many ways to
acquire and extract learning activities of students from their learning information; we focus on comments
handwritten in their attendance sheets. It is easy for teachers to collect the sheets every class and for
students to write their activities as comments. The sheets consequently provide time-series text data related
to students; such the data are treasures because the comments and the questionnaire reflect their learning
activities directly and indirectly. We propose a method called a PCN method for quantifying the comments
into triple showing inferred learning activities student by student. Case studies illustrate the validity of the
PCN method.
1 INTRODUCTION
Recently, e-learning systems in the classroom have
been popular. They give students useful
opportunities to learn class contents anytime and
anywhere through the Internet, and automatically
gather the students’ access logs which include the
history of pages visited, with their visited order, by
the students. The e-learning systems have many
tools and components for analyzing digitized and
well-formed data such as server logs of the systems;
using the tools, teachers can analyze the data from
their points of views, extract the relationships from
the data, and use them, with their experience and
intuition, to derive and grasp the learning status of
their students so that they can improve their class. In
addition to the server logs of e-learning systems,
teachers gather students’ learning information in
many forms such as questionnaires, quizzes, and
examinations. They gather their answers and
comments in digitized or non-digitized forms.
On the other hand, there exists other information
related to the learning activities which are not
always gathered automatically, such as
Questionnaires, Quizzes, Examinations, Feedback
Comments and so on. Especially Students’
handwritten freestyle feedback comments are easy to
collect and useful for grasping each of their learning
status and holistic class tendency. Since these
comments usually express rich information on
learning status of the students, some teachers gather
the comments of their students in the class at the end
of every period of the class. However there are
unfortunately not so many tools for analyzing free
style data such as students’ comments in the class.
So, they can just read them and confirm the overall
tendency or the some typical problems of the class.
If such the students’ unformatted comments can be
analyzed and transformed into quantified ones which
can easily be reused or recorded, it is useful for
teachers to record, compare, and visualize as graphs,
figures or tables.
This paper proposes a method of quantifying the
freestyle comments and analysis procedure for the
quantifycation. We call the method a PCN method.
The PCN method enables teachers to acquire a
temporal learning status of each student as a form of
triple (P, C, N); P (Previous) indicates the learning
activity before the classtime such as review of
previous class and preparation for coming class, C
(Current) shows the understanding and achievement
during the classtime, and N (Next) tells the learning
419
Goda K. and Mine T..
PCN: QUANTIFYING LEARNING ACTIVITY FOR ASSESSMENT BASED ON TIME-SERIES COMMENTS.
DOI: 10.5220/0003478404190424
In Proceedings of the 3rd International Conference on Computer Supported Education (ATTeL-2011), pages 419-424
ISBN: 978-989-8425-50-8
Copyright
c
2011 SCITEPRESS (Science and Technology Publications, Lda.)
activity plan until next class. The PCN method
provides some data expressing the learning status of
each student quantified from his/her comments and
special items implying something about learning
attitudes student by student. It is useful for class
assessment if components supporting the PCN
method are built as assessment tools and are
deployed to e-learning systems which gather
comments of the class.
The rest of the paper is organized as follows;
Section 2 describes the quantifying strategy of the
PCN method, which analyses comments and
quantifies into triple (P, C, N); Section 3 discusses
the case study; Section 4 shows related wok and
makes the difference from this work clear; finally
Section 5 concludes the paper and describes our
future work.
2 QUANTIFYING STRATEGY
2.1 Overview of the PCN Method
First, teachers read class comments written in
natural language with free-style, and analyze them
according to 3 time-series viewpoints: Previous,
Current, and Next. The teachers evaluate the
analyzed comments, convert them numerically, and
record them. In numerical conversion, one value of
(-1, 0, 1, 2) is provided. Absence is treated
exceptionally and given as -5 to all of P, C, and N.
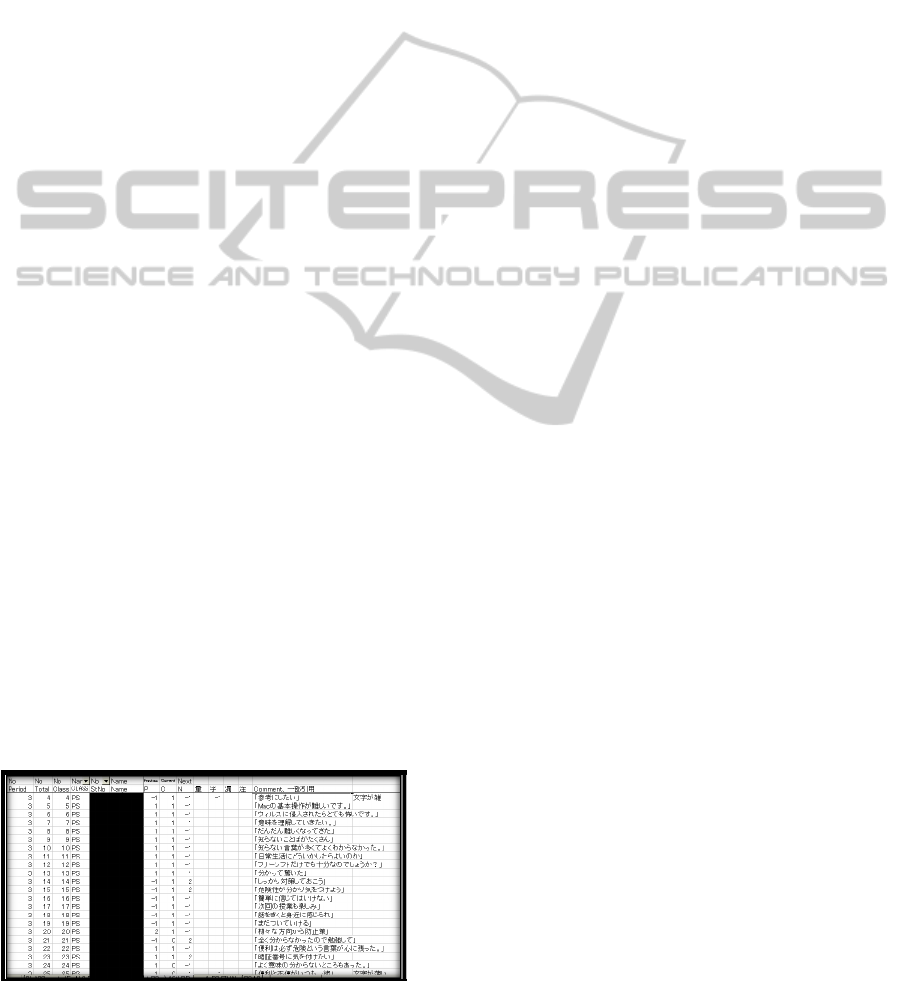
Figure 1 shows a working sheet for quantifying the
comments to triple (P, C, N), and special items. The
sheet also contains phrases that directly express
learning status of students or show notes concerning
to the students. As need arises, the teachers, further
to PCN, can also record special items described in
Section 2.1.4. After all the comments are quantified,
teachers can adjust the values from other
information as the questionnaire of the day, the
memories concerning the students, and/or the
experience of the class. The concrete criteria of
rating values of PCN are described in the following
Figure 1: Analyzing the comments (in Japanese).
subsections.
2.1.1 Rating P
P indicates the learning action between the previous
class and the current class, such as reviews of the
previous class or preparations for the current class.
In the real comments, students describe this kind of
action such as “I trained typing” or “I read chapter 3
of the textbook”. For quantifying the value of P,
one is selected from 4 levels: Attention (-1), Bad
(0), Fair (1), and Good (2). Attention (-1) is rated
if there are no expressions related to previous
learning actions, in any form, directly or indirectly.
Bad (0) is rated if there is abstract expression
concerning previous actions, but not in detail.
Teachers can confirm the fact of the action but not
detailed contents. For example, from real comments,
“I trained typing” insists reality of actions, but does
not explain in detail such as training time, or
achievement level. Fair (1) is rated if there are any
concrete expressions concerning previous actions,
but the action level implied from the expression does
not reach the level expected in the class. For
example, the comment, “I trained typing, and
achieved the speed of 100 strokes per minute”
describes the fact and detail on the previous action,
but the described fact (100 strokes per minute) does
not reach the expected level (150 strokes per
minutes) of the class. Good (2) is rated if there are
any concrete expressions concerning previous
actions and the action level implied from the
expressions reach the level expected in the class. For
example, the comment, “I trained typing, and
achieved the speed of 200 strokes per minute” shows
the fact and detail on the previous actions, and the
described fact (200 strokes per minute) goes beyond
the expected level (150 strokes per minute) of the
class. It is so difficult to acquire comments relating
to P at the first period of the class that we
exceptionally rate Bad (0) as a default value.
2.1.2 Rating C
C indicates understanding and achievement of the
current class. Teachers determine the value from
their experience. For example, for the comments, “I
finished the first exercise” or “I didn’t finish all
exercise because time is up,” one value is
empirically rated by the teachers.
For quantifying the value of C, one is selected
from 4 levels: Bad (-1), Normal (0), Good (1), and
Very Good (2). Attention (-1) is rated if there are
no expressions indicating the facts of students’
understanding or achievements in the current class,
CSEDU 2011 - 3rd International Conference on Computer Supported Education
420

in any form, directly or indirectly. Bad (0) is rated if
there are any expressions indicating the facts of
students’ understanding or achievements, but those
expressions are too abstract for teachers to extract
the students’ understanding level. For example, the
comment “I didn’t understand it” or “It was difficult,”
shows facts about students’ understanding, but their
achievement level is not clear. Fair (1) is rated if
there are any concrete expressions that help teachers
infer the students’ understanding and achievement
level, but the level is not so high. For example, the
comment “I have done the first exercise,” concretely
shows the fact of student’s achievements, but only
“the first exercise” does not reach the expected level
of the class. Good (2) is rated if there are any
concrete expressions that help teachers infer the
students’ understanding and achievement level,
which goes beyond the expected level of the class,
such as “Today I have done all exercises.”
Since it is sometimes difficult to acquire
comments related to C at the first two or three
periods of the class, teachers request students to
write comments related to C because comments are
freestyle and students have not accustomed yet. In
such cases, we rate Bad (0) as a default value and
adjust them per each student with questionnaire of
the day, and teachers’ experience and memories for
students.
2.1.3 Rating N
N indicates action plan after the class, and is guessed
from comments of students. Teachers guess students’
action plan from comments, and rate them
numerically. For example, for comments “I will
make preparation by next class,” “I found necessity
to train typing,” teachers rate Good (2) or Attention
(-1). Attention (-1) is rated if there are no
expressions concerning action plan in the comments,
in any form, directly or indirectly. Good (2) is rated
if there are any expressions concerning action plan
in the comments, in any form: determination,
declaration, or implication, such as “I found
necessity to train typing,” “I think my preparation is
not enough,” “I recognized that I should do exercise
not only in mind but also by hand,” and so on.
It is known facts from teachers’ experience that
motivation of students becomes weaker at the final
period of the class after submission of their final
reports. They feel so free that they write their plans,
determinations, and declarations related to N more
boldly and intrepidly than ever. We do not adjust the
values of the final period at present.
2.1.4 Extracting Special Items
We currently record 5 special items: Quantity,
Readability, Blank, Caution, and Citation. They
are defined as follows: Quantity is quantified into
an integer if extremely short or long. Readability is
quantified if the letter and figure in the comment are
extremely rough or polite. Blank is quantified if any
item required in the comment is blank or not found.
Caution is quantified if a phrase should be shared in
the class such as common mistakes, good hints,
inappropriate attitude, or laziness. Citation is
sample sentences clipped from the comments.
The reasons of recording such items are to help
teachers adjusting the results into more precise one.
These items reflect the characters of students and
reinforce the reliability of the same results as
teachers’ experience and memories to the students.
In addition, they enhance and improve teachers’ own
experience if new facts are found.
3 CASE STUDY
3.1 Environment of Case Study
We teach information processing courses including
computer literacy and C programming for entry level.
The course is taken by almost all first year students
in Kyushu University. We have two classes for the
course: 54 student class, say Class-A, and 55 student
class, say Class-B, in the 2nd semester, 2009. Each
class consists of 13 periods of the class. We gather
students’ attendance sheets in size of A6 at the end
of every period of the class. Each of the sheets has
the head side used for OCR data (ID information),
and the tail used for giving questionnaire of the day
and comments, although some students use as
memoranda of the class.
3.2 Analyzing by the PCN Method
3.2.1 Correlation between PCN Value
and Credit
As mentioned earlier, the PCN method quantifies
learning activities described in freestyle comments.
This enables teachers to visualize the tendency of
each student’s behavior in each period of the class;
teachers acquire the clues of understanding of
students’ learning activities if those are accidental or
natural. Actually, P indicates preparation activity for
the class. N indicates some activities related to
reflection and motivation for the next class.
PCN: QUANTIFYING LEARNING ACTIVITY FOR ASSESSMENT BASED ON TIME-SERIES COMMENTS
421
Table 1: The correlation between PCN values and credits
in a class. Pos. And Neg. Present positive and negative
values, respectively.
P C N
Pos. and
Neg.
0.742 0.786 0.655
Pos. 0.378 0.515 0.329
Neg. 0.769 0.776 0.748
Moreover, if we combine N and P, e.g., the m-th
period value of N (N
m
for short) and the (m+1)-th
period value of P (P
m+1
for short), we will find the
relationship between the m-th preparation activity
plan and the corresponding (m+1)-th real
preparation activities. To apply the PCN method, we
first analyzed the comments, and found that the
following facts:
1. Many students tend to skip preparation
activities to the class.
2. Many students describe the action plan to
their next class.
3. Most of them do not make practice in real.
The PCN shows these facts numerically.
Next, we sum up P, C, and N of all the periods
for each student, and also calculate the correlation
coefficient between the sum and the final score of
each student’s credit. The results illustrate strong
correlation. Then, we sum up in two ways such as
positive part and negative part of comments, and
calculate the correlation coefficient between the sum
of each part and the final score. The positive part of
comments is the part that only non-negative values
are summed up and negative values are treated as
zero. The negative part of comments is the par that
only non-positive values are summed up and
positive values are treated as zero. The results shown
in Table 1 say the strong correlation for the sum of
negative part of P, C, and N. On the other hand, the
sum of positive part of P, C, and N only show weak
correlation. As references, the final score and points
of students’ report make strong correlation of 0.634.
3.2.2 Overall Tendency of Learning
Activities during All the Class Periods
Firstly, we calculated the average sum of PCN
values for Class-A and Class-B at each period. The
results are shown in Table 2. From the results, we
found two singular points. For N
7
, P
8
and P
9
, two
areas are distinguished from other areas. When
considering N
7
, the contents of the class changed
marvellously. There was the switching point of the
subjects between the 6
th
period and 7
th
period of the
class, i.e. the 6
th
period class gives a lecture of
computer literacy, which gives how to use word
processor, spread sheet, and presentation tool, and
Table 2: The transition of PCN values by periods.
the lecture was changed to C programming from the
7
th
period class. The computer literacy subject is
educated compulsory and widely all over senior high
schools in Japan, and only a few contents differs
their detail. However, C programming, or
programming using other language, is not a required
subject until entering the university, and most
students are novices at programming. At the 7
th
period, the teacher explains the fundamental element
and basic procedure of C programming slowly and
precisely. The each student may feel that
programming is very difficult, and feel the necessity
and importance of preparing the class. We regard it
as natural that such the situations mentioned above
greatly increase the value of N
7
from that of N
6.
Secondly, we consider P
8
and P
9.
P
8
goes the
biggest down at this period in the semester. On the
other hand, P
9
goes up with the second biggest gap.
It makes V curve between P
8
and P
9
. This is because
in the 7
th
period, its subjects change drastically from
that of 6
th
, and students feel so uneasy that they need
to prepare their class more than before and that
makes P go up powerfully. Then, P
8
falls down very
much because, at the 7
th
period, the teacher spoke a
lot so that students felt programming was easy and
fun. On the other hand, it made them underestimate
the difficulties of the programming, and not to
prepare the class. However, at the next period, P
9
rose again because students recognized and reflected
that they should have prepared the class sufficiently.
We found the big difference between the 6
th
and 7
th
period of the class, and analyzed and compared the
two segments, before sixth (first half) and after
seventh (second half), and also classified the
students into positive and negative thinking groups.
As we inferred, second half periods and the negative
thinking groups showed the strongest correlation
with their final scores of the class. This shows the
fact that negative actions or do nothing on learning
affect the final score (credit score) greater than what
and how they learned, or process of learning.
3.2.3 Class Tendency of Learning Activities
during All the Class Periods
Firstly, we calculated the average of PCN values for
each class, both Class-A and Class-B show in Table
3. The results are shown in Figure 2. From this
figure, we found two tendencies. In the first half
CSEDU 2011 - 3rd International Conference on Computer Supported Education
422
Table 3: Analysis by period group.
periods of the class, values of which are plotted left
side in Figure 2, Class-B tends to be higher than
Class-A. In the second half, values of which are
plotted right in Figure 2, Class-B seems to be more
stable than Class-A. Secondly, we considered the
difference between Class-A and Class-B from
viewpoint of the comments. We read the comments
again, and found that the comments of Class-B
students tend to be more straight-forward and
concrete than those of Class-A students. This
implies that Class-B students tend to be more direct
and talkative than Class-A, and Class-A students
tend to be more shy. Thirdly, we compared the
average of PCN values between Class-A and Class-
B, and found Class-A tends to be higher than those
of Class-B about P values shown in Table 4. This
means that Class-A students tend to make more
preparation than Class-B, and also implies Class-A
students tend to more serious than Class-B which is
similar to the intuition of the teacher’s. About C
values Class-A tends to be lower than Class-B. This
means that Class-A students tend to understand or
achieve less than Class-B, and implies the average
sum of credits of all the Class-A students is lower
than those of Class-B, and this inference is against
the result, or credits of the class. From this gap and
teacher’s feelings in the classroom, we infer Class-A
students are pessimistic (or they write worse than
real) and Class-B ones are optimistic (or they write
better than real). Although we trust all the comments
of each student as premise, some exaggerations
cannot be avoidable and should be accepted.
Next, we focus on N value comparison between
classes, and found that Class-A tends to be lower
than Class-B, opposite tendency again C value
transition. This implies Class-B students tend to
declare their preparation or reviews explicitly but
fail to do as they have written. At the 7
th
period, both
P and C values of Class-A are much higher than
those of Class-B, but N values of both classes are
similar. This may be because the teacher tells
students slowly and precisely the importance of
preparation at the beginning of the every time of the
class and the effect of the advice has come at that
period. On the other hand, at the 8
th
period, the two
class students returned as before. Totally, over all
the periods, Class-A students tend to seek
preparation even if the correlation coefficient
Figure 2: C value transition of Class-A, Class-B, and Both.
Table 4: The PCN value transitions by classes.
between P value and C value is not so strong. Class-
B students seek to try preparations, but also easily
give up them if they failed in understanding or
achieving. Actually, this impression is very similar
to the one the teacher (one of the authors) felt in the
classroom. Or intuition to the two classes from the
teacher’s experience is explained by interpretation of
the result of the PCN method.
4 RELATED WORK
There exists a lot of work related to the subject
touched on in this paper, such as adaptive learning,
text mining of time-series data and so forth.
First, we discuss some work on adaptive learning.
From behaviorism, PSI (Personal System of
Instruction) is one of teaching methods, person to
person education well-known for Keller Plan (Keller
1968). Proctors play an important role in PSI and
they should work very hard to grasp learning status
of all the members in the class and manage the
progress of the class, quality of which depends on
their experiences. Since training proctors costs
expensive and takes long time, PSI is only applied to
limited students requiring special aid. CSCL
(Computer Supported Collaborative Learning) is a
pedagogical research area on learning environment
derived from CSCW (Computer Supported
Cooperative Work) (Koschmann 1996). It provides
the learning environment for collaborative learning
across classes, schools, sometimes countries by
PCN: QUANTIFYING LEARNING ACTIVITY FOR ASSESSMENT BASED ON TIME-SERIES COMMENTS
423

computer connected to the internet. This breaks
special barrier and students are located so wide in
such environments that teachers encounter the
difficulties in grasping learning status of all the
students or even students in charge. The PCN
method provides indexes expressing learning status
of students and basic idea for a component of
learning system supporting CSCL. Self-regulated
learning is a learning style guided by metacognition
(Zimmerman 1990). It is characterized three points,
self-observation, self-judgment, and self-reactions.
The PCN method provides indexes reducing the task
for all of self-observation, self-judgment, and self-
reaction. ID (Instructional Design) is the practice of
maximizing the effectiveness of learning rooted in
cognitive and behavioral psychology (Gagne 1965,
Ito & Suzuki 2008), and there are many instructional
design models but many of them are based on the
ADDIE model with the five phases: analysis, design,
development, implementation, and evaluation. The
analysis process of ID needs the current learning
status of the class. And the PCN can provide it.
There exist so many user models concerning
adaptive media systems (Brusilovsky 2001, Popescu
et al. 2007) and they are roughly classified into three
categories: the user model, the domain model, and
the interaction model (Martins 2008). The PCN
method helps the interaction model in inferring
students’ characters partly by PCN values.
Next, we will describe some work on text
mining. There exist only a few researches of text
mining using learning data (Romero 2007) because
there is few data concerning learning status in time
series. With respect to the content of the comments,
most analyses of time-series comments are for
marketing such as CRM (customer relationship
management), and the contents of comments include
reputations, opinions, and requests expressing
directly and apparently their preferences and
characters. Our purpose is for education and learning,
and the comments from students reflect their
learning activity directly or indirectly. In this
research, we analyse time series comments. The
comments are handwritten with free style, and
include full name of students, which enable tracking
the students easily.
5 CONCLUSIONS
In this paper, we proposed and discussed the PCN
method which quantifies the freestyle
classcomments. This method enables teachers to
grasp the tendencies of students’ learning activities
in the class, which are not only for the whole class
members, but also for each member in the class.
Concerning individual learning behavior, we can
grasp the current status and the change of his/her
activities. As described in this paper, the PCN
method provides the basis of improving both class
and learning. In future, we will develop dynamic
grouping module and build it into e-learning system,
and attach the function which provide learning
information or advice, and use result of analysis of
both whole class and each individual in order to
enhance adaptive contents to specific level group.
The PCN method currently costs because the teacher
of class read and evaluate into numbers. To continue
this procedure, automation is required such as
digitization of comments, keywords, text mining.
This is very important task. Authors are planning to
extend this research to design, develop, and
implement the module for dividing and reconstruct
the students cluster by specific criteria.
REFERENCES
Brusilovsky P., 2001. Adaptive Hypermedia. User
Modeling and User-Adapted Interaction 11, 1-2
(March 2001), 87-110.
Bull S., Greer J., McCalla G., Kettel L., & Bowes J., 2001,
User Modelling in I-Help: What, Why, When and
How, in M. Bauer, P.J. Gmytrasiewicz, and J.
Vassileva (Eds.): UM 2001, LNAI 2109, 117-126.
Gagne, R. M. 1965. The conditions of learning and theory
of instruction (1st ed.): Holt, Rinehart & Winston.
Ito, T., & Suzuki, K. 2008. Development of an effective
and subtainable system for ID training: Proposing a
strategy model of Training of Trainer (ToT).
Educational Technology Research, 31(1-2): 13-24.
Keller, F. S., 1968. Goodbye teacher, Journal of Applied
Behavior Analysis 1, 79-89.
Van Kleek, M., Shrobe H., 2007. A Practical Activity
Capture Framework for Personal Lifetime User
Modeling (PLUM), 11th International Conference of
User Modeling (UM 2007), 298-302.
Koschmann, T., 1996, Paradigm Shifts and Instructional
Technology: An introduction. In T.D. Koschmann
(Ed.), CSCL: Theory and practice of an emerging
paradigm, Hillsdale, NJ, Lawrence Erlbaum, 1-24.
Martins, A. C., Faria, L., Vaz de Carvalho, C., &
Carrapatoso, E., 2008. User Modeling in Adaptive
Hypermedia Educational Systems. Educational
Technology & Society, 11 (1), 194-207.
Popescu, E., Trigano, P., & Badica, C. 2007. Towards a
unified learning style model in adaptive educational
systems. Procs. ICALT 2007, 804-808
Romero C., Ventura S., 2007. Educational data mining: A
survey from 1995 to 2005, Expert Systems with
Applications 33 (2007) 135-146.
Zimmerman, B. J., 1990. Self-regulated learning and
academic achievement: An overview. Educational
Psychologist, 25, 3-17.
CSEDU 2011 - 3rd International Conference on Computer Supported Education
424
