
CLOUD COMPUTING KEEPS FINANCIAL METRIC
COMPUTATION SIMPLE
Joan Navarro
1
, Ainhoa Azqueta-Alzuaz
2
, Pablo Murta Bai˜ao Albino
3
and Jos´e Enrique Armend´ariz-I˜nigo
2
1
Distributed Systems Research Group, La Salle, Universitat Ramon Llull, 08022 Barcelona, Spain
2
Dpto. Ing. Matem´atica e Inform´atica, Universidad P´ublica de Navarra, 31006 Pamplona, Spain
3
Dpto. Gesti´on de Empresas, Universidad P´ublica de Navarra, 31006 Pamplona, Spain
Keywords:
Cloud computing, Hadoop, MapReduce, Data consistency, SABI database.
Abstract:
Cloud computing—implemented by tool suites like Amazon S3, Dynamo, or Hadoop—has been designed to
overcome classical constraints of distributed systems (i.e. poor scale out, low elasticity, and static behaviour)
and to provide high scalability when dealing with large amounts of data. This paper proposes the usage
of Hadoop functionalities to efficiently (1) process financial data and (2) detect and correct errors from data
repositories; in particular, the work is focused on the database SABI.There is a set of operations that performed
with the distributed computation paradigm may increase the calculation performance.
1 INTRODUCTION
Rapid advances in technology and storage capacity
have lead to grab huge volumes of data from internal
and external processes. In such scenario, data man-
agement has become a crucial component in any data-
driven application. Actually, the concept of data man-
agement has evolved and, currently, not only refers to
data storage but also to computation and data aggrega-
tion, which pushes traditional relational databases to
the background. Thus, cloud storage services take the
baton offering their high scalability and availability at
low cost (Kraska et al., 2009). Existing commercial
services use computer farms of commodity hardware
to provide remote storage facilities. Some of them
restrict strong consistency to small data sets (e.g. Mi-
crosoft SQL Data Services) and others only provide
eventual consistency to larger data sets (e.g. Amazon
S3). However, there are several applications that re-
quire both transactional guarantees and high scalabil-
ity. Data management then imposes new demands to
deal with (1) a large amount of (2) non-homogeneous
data.
This work focuses on the financial database Sis-
tema de An
´
alisis de Balances Ibricos (SABI) (Bureau
van Dijk, 2010), which is considered a research tool
by many Spanish universities (Albino, 2008) and is
largely used by private companies to perform market
analysis. Although this repository constitutes an im-
portant financial information source in Spain, many
companies do not properly fill all the fields, leading
to an incomplete data panel. In some works, this is-
sue is roughly solved by excluding those rows that be-
long to companies with missing values (Hern´andez-
C´anovas and Mart´ınez-Solano, 2010). Reducing the
size of the sample set or even replacing missing val-
ues with means may bias the results in terms of ac-
curacy. Nonetheless, this data repository is targeted
to engage researchers in analysing companies’ effi-
ciency (Kapelko and Rialp-Criado, 2009; Retolaza
and San-Jose, 2008; Guzm´an et al., 2009), by com-
puting ratios like indebtedness, availability of idle
resources, or capital costs (Mart´ınez-Campillo and
Gago, 2009). Thus, to perform such calculations re-
searchers and users have to follow a two-step proce-
dure: (1) search and filter the data and (2) analyse
them with the aid statistical tools.
The purpose of this paper is to propose the use
of an open-source cloud computing tool to efficiently
store and process large amounts of data. To this end,
we rely on Hadoop (White, Tom, 2009) and its im-
plementation of MapReduce (Dean and Ghemawat,
2010). To manage the storage resources, Hadoop
uses a distributed file system referred to as HDFS
that is written in Java and designed to offer portabil-
ity across heterogeneous hardware and software plat-
143
Navarro J., Azqueta-Alzuaz A., Murta Baião Albino P. and Enrique Armendáriz-Iñigo J..
CLOUD COMPUTING KEEPS FINANCIAL METRIC COMPUTATION SIMPLE.
DOI: 10.5220/0003506901430148
In Proceedings of the 6th International Conference on Software and Database Technologies (ICSOFT-2011), pages 143-148
ISBN: 978-989-8425-76-8
Copyright
c
2011 SCITEPRESS (Science and Technology Publications, Lda.)

forms. We tested the performance of the proposed
approach through a case study based on error detec-
tion and financial metric computation on the afore-
mentioned SABI repository.
The remainder of this paper is organised as fol-
lows. Section 2 reviews the tools powered by Apache
Hadoop project, and Section 3 describes the SABI
repository. Next, Section 4 details the implementa-
tion and presents some experimental results. Finally,
Section 5 summarises the work and outlines some fu-
ture research lines.
2 MASSIVE STORAGE &
COMPUTING
Despite the effort in designing and developing ef-
ficient algorithms, scalability is still a challenge in
data management (Brewer, 2000; DeCandia et al.,
2007). This has been carried out by a database man-
agement system (DBMS) which is usually enhanced
with cluster-based solutions to increase system per-
formance and tolerate site failures. Nevertheless, the
more the number of replicas increases, the more the
traditional DBMS struggles (Paz et al., 2010).
To overcome this drawback, some ap-
proaches (Chang et al., 2006; DeCandia, Giuseppe
et al., 2007; Lakshman, Avinash and Malik, Prashant,
2010) attempt to store data into non-relational
databases; plain databases with no special features
such as fast interfaces or advanced concurrency
control algorithms (Brantner et al., 2008), where data
are just stored in a non-normalised scheme meeting
specific constraints.
This section reviews the storage technologies and
describes the data management model used in our ex-
periments, which offers an efficient cloud-based way
to address the data set described in Section 3.
2.1 Cloud Storage Trends
According to the CAP theorem (Brewer, 2000), in or-
der to deal with a deluge of data spread over thou-
sands of servers, data consistency, availability, or net-
work partitioning properties have to be relaxed, find-
ing a trade off among them. Amazon S3 (Palankar
et al., 2008), Dynamo (DeCandia et al., 2007), Ya-
hoo! (Cooper et al., 2009) or Hadoop are some of
the market technologies that provide high-scalability
based on the cloud paradigm. However, depending
on the aforementioned requirements—consistency,
availability or performance—one technology will be
more suitable than the others. For instance, while
Amazon S3 implements eventual consistency on its
nodes, Hadoop ensures strict consistency allowing
data to be Written Once and Read Many (WORM)
times (White, Tom, 2009).
Our specification is subjected to two require-
ments, data must be (1) strictly consistent and (2)
written once and read each time we perform calcu-
lations. To this end, Hadoop can be a suitable tech-
nology since it satisfies our need by providing a good
balance between consistency and availability. In addi-
tion, it supplies a set of open-source tools which offer
reliable and scalable distributed computing:
Hadoop Distributed File System (HDFS). Raw stor-
age container which ensures consistency, scal-
ability, fault tolerance, and replication under a
WORM environment. This implementation has
followed the ideas presented in (Ghemawat et al.,
2003).
HBase. Interface that permits accessing the non-
normalised data stored on the HDFS as if it was
a structured distributed database.
MapReduce. Software framework able to perform
distributed computing operations in the data set
stored in the HDFS.
In the following, each tool is described:
HDFS. Storage devices tend to be the bottleneck in
many scenarios such as web services or intensive
computing applications; scenarios where user queries
and network communications are faster than writing
and reading from disks (Paz et al., 2010). However,
HDFS, due to its architecture, behaves as a distributed
file system mounted at the user space which spreads
and replicates data across all the storage servers in a
scalable way.
In our case, HDFS automatically splits the file
and stores each partition on different sites enabling
parallel distributed computations. The size of this
partition is set by default to 64 MB though it can
be adjusted to obtain different performances (Shafer
et al., 2010).
HBase. Once data are stored on the distributed file
system, they are ready to be retrieved and processed.
Data can be accessed (1) from the command line in-
terface which gives direct access to the distributed
file system via
put
and
get
HDFS directives suitable
to perform small tests and check whether data have
been stored correctly or (2) from an upper-layer mid-
dleware such as HBase, extremely useful when large
amounts of data have to be read, processed, and writ-
ten back to the file system.
HBase allows us to access to the non-normalized
data stored on the distributed file system as if they
ICSOFT 2011 - 6th International Conference on Software and Data Technologies
144

were on a relational database SQL. Both the standard
query language and the HDFS built-in facilities make
easier to formulate queries and retrieve filtered data.
MapReduce. Data stored in distributed file systems
can be processed either (1) by centralized computing,
i.e. by aggregating all remote data and then process-
ing them from a central node or (2) by distributed
computing, i.e. by first processing data chunks lo-
cally stored on each node and then aggregating the
partial results. The latter may perform better than the
first one when calculations can be solved in parallel
since it takes the most of the computational resources
of each distributed site and minimizes the network
traffic. MapReduce is an Apache Hadoop compati-
ble distributed computing paradigm which hides the
internal distributed file system architecture allowing
to process distributed data without knowing its exact
location.
HBase and MapReduce both provide an efficient
way to access the distributed data stored in the HDFS
without compromising reliability nor worrying about
data partition. While HBase is best suited for real-
time read/write random access to very large data sets,
MapReduce is suitable for performing complex op-
erations with stored data without having any notions
about the typical issues of the distributed systems
such as concurrency control, replication schemes,
fault tolerance and recoverability.
Taking into account that our data have to be not
only stored and retrieved from the file system but
also processed, MapReduce seems to be an appealing
framework to efficiently perform our experiments.
3 SABI DATABASE
This section briefly describes SABI, the database used
in the experimentation, stresses its relevance, and
points out its main drawbacks which can be solved
with the proposed MapReduce approach.
Distributed online in Spain by INFORMA (In-
forma, 2010), SABI consists of (1) a private repos-
itory that gathers data from 1998 until 2009 of more
than 1.2 million Spanish and Portuguese firms and (2)
a financial analysis system.
As any other conventional database, the data
stored can be accessed through different search cri-
teria such as company name, tax identification num-
ber, location, business activity, employees, etc. How-
ever, SABI provides additional functionalities that al-
low the user to (1) perform statistical and compara-
tive analyses of companies taking into account dif-
ferent variables and different time basis, (2) to ob-
tain reports in either standard or personalized format,
and (3) graphically visualise results from balance ac-
counts, income statements, and other comparisons.
Therefore, SABI’s strength lies on its analytical
tools applied to finance, marketing, and economics.
Finance/Credit. Users can follow financial
progress, carry out credit analysis, conduct company
comparisons, identify competitors, study companies’
position in the market, detect potential partners,
consider mergers and acquisitions, etc.
Marketing/Commercial. Users can perform strate-
gic corporate planning, examine market situation, de-
tect potential clients, elaborate market strategies, etc.
Economics Research. Users can benefit from a re-
search tool and teaching resource.
SABI has been used in many research works such
as (Retolaza and San-Jose, 2008; Hern´andez-C´anovas
and Mart´ınez-Solano, 2010). Nevertheless, some of
these studies report the inconsistency of the database
and the presence of missing values which force to re-
move many items from the database and, as a conse-
quence, shrink the set of samples.
In the following, we present a case study that
showshow to detect errors from the database and keep
the information used consistent.
4 CASE STUDY: SABI
This section (1) describes the problem to solve, (2)
explains how data are organised in the SABI repos-
itory files and, (3) how these data are tuned to ap-
ply the MapReduce technique and derive our calcu-
lations. As already mentioned, we obtained the data
from a SABI DVD October 2009. These data corre-
spond to collected information from year 2001 until
2008 and most of them refer to the old Spanish chart
of accounts—which changed in 2007.
The main problem that everybody faces when try-
ing to extract any statistics from the SABI reposi-
tory is the mismatch between the different values con-
tained in the companies’ accounts. This is due to
the fact that most of these Spanish and Portuguese
companies manually introduce the calculated values.
Once mismatches are identified, these entries have to
be removed from the data panel. Therefore, the goal
of our proposal is to efficiently automatise the task of
identifying and removing these mismatches.
For example, the total assets value shown in Ta-
ble 1 can be computed from the following items:
(1) shareholder contribution receivable, (2) long-term
CLOUD COMPUTING KEEPS FINANCIAL METRIC COMPUTATION SIMPLE
145

Table 1: Verified metrics from the SABI repository.
Metric Operations required
Total assets Total liabilities
Total assets Shareholder contribution receivable + long-term investments + deferred
charges + current assets
Non-current assets Up cost + intangible assets + tangible assets + financial assets + long-term
treasury stock + due on long-term traffic
Current assets Expenditure required by shareholders + stocks + debtors + short term invest-
ments + short-term treasury shares + treasury + accrual
Total liabilities Equity + revenue deferred + provisions for liabilities and charges + long-term
creditors + short-term creditors
Equity Subscribed capital + premium + reservations and results for previous exercises
+ income + interin dividend paid during the year + share for capital reduction
investments (which is computed from the following
items: start-up costs, intangible assets, tangible as-
sets, financial investments, own stock and long-term
investments debtors), (3) deferred charges (which is
computed from the following items: shareholder con-
tribution non-receivable, debtors, temporary financial
investment, short-term own stock, liquid assets and
accrual adjustments), and (4) current assets.
Hence, the total assets field can be checked from
such other fields of the same entry. If there is a field
with incorrect data (either the final total assets value
or any of the others) the full entry will have to be re-
moved. We can follow a similar process for the rest of
metrics (economic performance, profitability, finan-
cial structure and short/long term solvency) shown in
Table 1.
Next, we describe how data is organisedwithin the
SABI data repository and how MapReduce tasks are
launched to deal with each entry.
4.1 Data File Format
The aforementioned SABI repository is extracted to
a single text file of 10.4 GB which is not manage-
able for some file systems. Hence, we split it up into
years (from 2001 to 2008) obtaining eight text files
of 1.3GB each. The first row of each file contains
the header indicating the content of each field, e.g.
the name, address, number of employees, etc. and
the rest contains information regarding each company
(one per row). Each file is written in a fixed-size vir-
tual rectangle which forces long fields (e.g. name) to
be written in multiple lines as follows:
This is This is 43 Another And another
a field another field one
field
In order to ease the map tasks, these files need
to be preprocessed to (1) demarcate each field (up to
now there is not a unique field separator, i.e. white
space or tabulator), (2) transform multiple line fields
into single lines, and (3) fill up the empty fields by
inserting ‘⋆’.
After preprocessing the eight files, we obtain eight
new files that are loaded into HDFS. The following
section describes how the MapReduce tasks check
these files.
4.2 The MapReduce Process with the
SABI Data Panel
Once the files are loaded into HDFS, the compu-
tation takes a set of input hkey
i
/value
i
i pairs, and
produces a set of output hkey
i
/value
′
i
i pairs. The
MapReduce process is based on two functions: map
and reduce. The map function, written by the user,
selects the needed fields to compute the metrics
shown in Table 1 from a given company and passes
them to the reduce function with an intermediate
key
i
. The reduce function, also written by the user,
accepts this key
i
and a set of values for that key
({value
i1
,value
i2
,...,value
ij
,...,value
ip
}) and com-
putes the desired metric. Its output is one if the com-
pany passes the check or 0 otherwise. The follow-
ing summarised code snippet shows the implemented
map and reduce functions written in J2SE:
static class myMapper extends Mapper
<LongWritable, Text, Text, Text > {
public void map (LongWritable key,
Text value, Context context){
String line = value.toString();
Pattern p = Pattern.compile("\t");
String[] items = p.split(line);
String[] fields = getFields(items);
context.write(fields);
}
}
static class myReducer extends Reducer <Text,
Text, Text, Text>{
public void reduce(Text key, Iterable <Text>
values, Context context){
context.write(key, new Text(
checkFields(values)));
}
}
ICSOFT 2011 - 6th International Conference on Software and Data Technologies
146
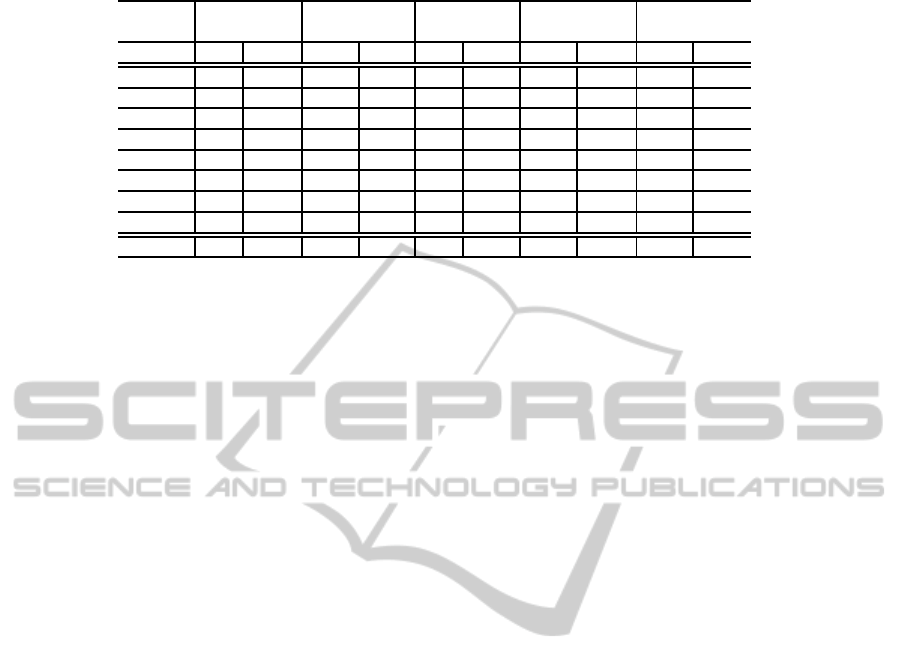
Table 2: Verification results (α for tested, β for passed).
Agriculture Industry Energies Construction Services
& Dwellings
Year α β α β α β α β α β
2001 1% 39% 25% 42% 1% 56% 17% 41% 55% 42%
2002 1% 38% 24% 45% 1% 57% 18% 41% 55% 44%
2003 1% 42% 24% 44% 1% 56% 18% 43% 55% 43%
2004 1% 41% 23% 43% 1% 55% 19% 41% 55% 43%
2005 1% 43% 23% 42% 1% 56% 19% 40% 55% 43%
2006 1% 40% 23% 43% 1% 55% 19% 40% 55% 43%
2007 1% 43% 23% 44% 1% 56% 18% 40% 56% 42%
2008 1% 36% 26% 40% 2% 43% 16% 32% 54% 43%
MEAN 1% 40% 24% 43% 1% 54% 18% 40% 55% 43%
After preprocessing the files, a line is arranged
as follows: “
Company[ ]year [
\
t] ...[
\
t]
shareholder contribution receivable [
\
t]
fixed assets [
\
t] multi-year expenses [
\
t]
current assets [
\
t] ... [
\
t] total assets
[
\
t]...
”.
Assume that a given line contains: “
Firm1 2006
[
\
t] ... [
\
t] 0[
\
t] 2.242.904 [
\
t] ... [
\
t]
48.258 [
\
t] 3.452.272 [
\
t] ... [
\
t] 5.743.434
[
\
t] ...
”.
The Hadoop JobTracker assigns to existing Task-
Trackers the different blocks in which the files are
split to do their map tasks. Our defined map task re-
turns for each company their four accounts that we
have specified per year; all of these accounts are sepa-
rated using “\t” too. So the result of the map task will
be in this case: “h
Firm1 2006, 5.743.434 [
\
t]
0 [
\
t] 2.242.904 [
\
t] 48.258 [
\
t] 3.452.272
i”,
recall that the map task (1) checks if there are empty
fields in a given line (if so, it will discard it and will
not send it to the reduce task) and (2) removes the un-
necessary fields (marked with “
...
” in the example
above).
Then, the reduce tasks will be issued obtaining
that:
total assets = 5.743.434, shareholder
contribution receivable = 0, fixed assets
= 2.242.904, multi-year expenses = 48.258,
current assets = 3.452.272
. As in this case it is
satisfied, it will return the tuple h
Firm1 2006, 1
i.
Thus, at the end of the reduce task we will have a file
composed of the following tuples (formatted as text
lines with “\t” as the field separator for each tuple):
{h
Firm1, 1
i, ... , h
Firm2, 1
i, ..., h
Firm3, 0
i, ... ,
h
Firm4, 1
i}.
As we wanted to extract some knowledge from
firms that have mismatching data, we classified
the total amount of entries in the SABI repository
from 2001 until 2008 (2.131.336 firms distributed in
266.417 entries per year) according to their working
sector: agriculture, industry, energies, construction
and dwellings, and services.
From the output generated by the MapReduce
task, we built Table 2. Each working sector has two
columns: (1) α shows the ratio of firms that had non-
empty values at all the required fields to compute the
metrics shown in Table 1 from the total amount of en-
tries, (2) β shows the ratio of these firms that passed
all the verifications (e.g. at 2001, the 25% of indus-
try firms, i.e. 266.417 ∗ 0,25 = 66.604 firms, had
no missing fields and, from these, only the 42%, i.e.
66.604∗ 0,42 = 27.974 firms, passed the six verifica-
tions described in Table 1).
This section described the implementation of the
map and reduce tasks to efficiently go through the
whole data repository and remove the mismatching
entries. Nevertheless, we also need to compare the
performance of our method with respect to other tools
designed to mine data such as project R, a free soft-
ware for statistical computing, or Matlab, a high level
computing language.
5 SUMMARY AND FUTURE
WORK
Data driven applications are becoming more popu-
lar nowadays and the requirements needed to manage
them are very stringent; huge volumes of data do not
fit well in traditional database management systems.
Cloud computing provides us the proper tools and in-
frastructure to manage data in a scalable and efficient
way. In this paper, we have proposed a method to
deal, not just storing but also computing, with large
data repositories in the financial field. This method
consists on using the HDFS and MapReduce facili-
ties to detect possible errors and recalculate values of
the Spanish/Portuguesedata repository and toease the
computation of certain financial metrics.
This work has presented a more daily application
of MapReduce which embraces economics calcula-
tion. However, there is still a long way until this usa-
CLOUD COMPUTING KEEPS FINANCIAL METRIC COMPUTATION SIMPLE
147

ge becomes familiar to practitioners due to the diffi-
culties of decomposing the problem in operations of
mapping and reducing required to apply the MapRe-
duce distributed computing paradigm. We hope our
sketch encourages researchers to work on this direc-
tion and provide new insight into the field.
Finally, our future research lines are two-fold: (1)
to apply the same idea with upper layer Hadoop prod-
ucts such as HBase or Hive and compare which option
is the best in terms of coding complexity and (2) to
make a performance comparison analysing statistical
tools such as R and SPSS.
ACKNOWLEDGEMENTS
This work has been partially supported by the Spanish
Government under research grant TIN2009-14460-
C03-02.
REFERENCES
Albino, P. M. B. (2008). Eficiencia y productividad de
las cooperativas de cr´edito espa˜nolas frente al de-
saf´ıo de la desintermediaci´on financiera. In INTER-
NATIONAL, C. E. A. C. (Ed.) innovation and Man-
agement: Answers to the great challenges of public,
social economy and cooperative enterprises.
Brantner, M., Florescu, D., Graf, D., Kossmann, D., and
Kraska, T. (2008). Building a database on s3. In
Proceedings of the 2008 ACM SIGMOD international
conference on Management of data, SIGMOD ’08,
pages 251–264, New York, NY, USA. ACM.
Brewer, E. A. (2000). Towards robust distributed systems
(abstract). In PODC Conf., page 7, New York, NY,
USA. ACM.
Bureau van Dijk (2010). Sabi.
http://sabi.bvdep.com
.
Chang, F., Dean, J., Ghemawat, S., Hsieh, W. C., Wal-
lach, D. A., Burrows, M., Chandra, T., Fikes, A., and
Gruber, R. E. (2006). Bigtable: a distributed stor-
age system for structured data. In Proceedings of the
7th USENIX Symposium on Operating Systems De-
sign and Implementation - Volume 7, pages 15–15,
Berkeley, CA, USA. USENIX Association.
Cooper, B. F., Baldeschwieler, E., Fonseca, R., Kistler, J. J.,
Narayan, P. P. S., Neerdaels, C., Negrin, T., Ramakr-
ishnan, R., Silberstein, A., Srivastava, U., and Stata,
R. (2009). Building a cloud for yahoo! IEEE Data
Eng. Bull., 32(1):36–43.
Dean, J. and Ghemawat, S. (2010). Mapreduce: a flexible
data processing tool. Commun. ACM, 53(1):72–77.
DeCandia, G., Hastorun, D., Jampani, M., Kakulapati,
G., Lakshman, A., Pilchin, A., Sivasubramanian, S.,
Vosshall, P., and Vogels, W. (2007). Dynamo: Ama-
zon’s highly available key-value store. In SOSP Conf.,
pages 205–220. ACM.
DeCandia, Giuseppe, Hastorun, Deniz, Jampani, Madan,
Kakulapati, Gunavardhan, Lakshman, Avinash,
Pilchin, Alex, Sivasubramanian, Swaminathan,
Vosshall, Peter, and Vogels, Werner (2007). Dynamo:
amazon’s highly available key-value store. SIGOPS
Oper. Syst. Rev., 41(6):205–220.
Ghemawat, S., Gobioff, H., and Leung, S.-T. (2003). The
google file system. In Scott, M. L. and Peterson, L. L.,
editors, SOSP, pages 29–43. ACM.
Guzm´an, I., Arcas, N., Ghelfi, R., and Rivaroli, S. (2009).
Technical efficiency in the fresh fruit and vegetable
sector: a comparison study of italian and spanish
firms. Fruits, 64(4):243–252.
Hern´andez-C´anovas, G. and Mart´ınez-Solano, P. (2010).
Relationship lending and sme financing in the conti-
nental european bank-based system. Small Business
Economics, 34(4):465–482.
Informa (2010). Informa D&B.
http://www.informa.es/informa/index.php/en/
.
Kapelko, M. and Rialp-Criado, J. (2009). Efficiency of the
textile and clothing industry in poland and spain. Fi-
bres & Textiles in Eastern Europe, 17(3):7–10.
Kraska, T., Hentschel, M., Alonso, G., and Kossmann, D.
(2009). Consistency rationing in the cloud: Pay only
when it matters. PVLDB, 2(1):253–264.
Lakshman, Avinash and Malik, Prashant (2010). Cassandra:
a decentralized structured storage system. SIGOPS
Operating Systems Review, 44(2).
Mart´ınez-Campillo, A. and Gago, R. F. (2009). What fac-
tors determine the decision to diversify? the case of
spanish firms (1997-2001). Investigaciones Europeas
de Direcci´on y Econom´ıa de la Empresa, 15(1):15–28.
Palankar, M. R., Iamnitchi, A., Ripeanu, M., and Garfinkel,
S. (2008). Amazon s3 for science grids: a viable solu-
tion? In DADC ’08: Proceedings of the 2008 interna-
tional workshop on Data-aware distributed comput-
ing, pages 55–64, New York, NY, USA. ACM.
Paz, A., P´erez-Sorrosal, F., Pati˜no-Mart´ınez, M., and
Jim´enez-Peris, R. (2010). Scalability evaluation of the
replication support of jonas, an industrial j2ee applica-
tion server. In 2010 European Dependable Computing
Conference, pages 55–60. IEEE-CS.
Retolaza, J. L. and San-Jose, L. (2008). Efficiency in work
insertion social enterprises: a dea analysis. In Univer-
sidad, Sociedad y Mercados Globales, pages 55–64.
Shafer, J., Rixner, S., and Cox, A. L. (2010). The hadoop
distributed filesystem: Balancing portability and per-
formance. In ISPASS, pages 122–133. IEEE Computer
Society.
White, Tom (2009). Hadoop: The Definitive Guide.
O’Reilly Media, 1 edition.
ICSOFT 2011 - 6th International Conference on Software and Data Technologies
148
