
DECISION SUPPORT SYSTEM FOR COST-BENEFIT ANALYSIS
IN SERVICE PROVISION
Emadoddin Livani
1
, Elham Paikari
1
and Günther Ruhe
1, 2
1
Department of Electrical and Computer Engineering, The University of Calgary, Alberta, Canada
2
Department of Computer Science, The University of Calgary, 2500 University Dr. NW Calgary, AB, Canada
Keywords: Service Engineering, Decision Support Systems, Cost-benefit Analysis, Bayesian Belief Networks.
Abstract: Cost-benefit analysis is an approach to relate effort and cost of an activity to the resulting benefit. In this
paper a novel decision support system for cost-benefit analysis in the context of service provision is
proposed. Four decision support scenarios are investigated: (i) analyzing the impact of the services on cost
and benefit, (ii) sensitivity analysis for the system variables, (iii) goal-seek analysis, and (iv) analyzing the
impact of the services on operational resources. The key engine of the analysis approach is a Bayesian
Belief Network (BBN). The BBN incorporates the key incoming, control and outgoing service parameters
as well as their probabilistic relationships. In the sense of a hierarchical system, the variation of some of the
parameters is guided by the results of optimizing operational resources being some of the BBN parameters.
We’ve evaluated the framework in a case study with the City of Calgary’s Waste and Recycling Services.
The results showed that using such a DSS facilitates the decision making process and improves the overall
cost-benefit ratio.
1 INTRODUCTION
Service Engineering (SE) is a technical discipline
concerned with the systematic development and
design of services using suitable models, methods
and tools. A service can be any kind of material,
energy, and information. Many studies have
investigated on SE, e.g. (Bullinger, 2003), (Sakao,
2007), (Kapitsaki, 2009), (Sundin, 2010).
Providing services needs resources, like time,
human, and budget. In the other hand, each service
has unique value for the service consumer, hence for
the service provider. As the resources are always
limited, selection of services is needed to increase
the value (benefit) of them. If we aggregate all the
resources as cost and present the value of them as
benefit, then the problem would be cost-benefit
trade-off analysis. This analysis needs to be
performed before an appropriate decision can be
made or a proper action can be taken (Liu, 2003).
There is no deterministic relationship between a
question and an answer in decision-making, as the
process normally involves a great deal of personal
experience and sophisticated reasoning. So, it’s
difficult to be modeled mathematically (Liu, 1999)
(Liu & Alderson, 1999). Probabilistic techniques
like Bayesian belief network (BBN) can be utilized
for this purpose. BBN has been used in the literature
as a decision making (and often decision support)
tool for representing and reasoning with uncertain
knowledge (Fenton, 2001) (Fenton, 1999) (Shirazi,
2009) (Heckerman, 1997) (Ibrahim, 2009) (Fineman,
2009).
Decisions are normally formulated by managers
as three levels: strategic, tactical, and operational.
The decision support systems in the literature
usually focus only on one type of decision and do
not consider the link between them (Liu, 2003)
(Zoric, 2011) (Nanazawa, 2009). So, there isn’t any
sophisticated decision support system for cost-
benefit analysis that evaluates both strategic and
tactical level decisions in one coherent solution.
In this paper a novel decision support system for
cost-benefit analysis of the services is proposed. It
addresses the above gap, by answering the following
questions:
• What’s the impact of a certain service on cost
and benefit?
• Which services dominate the others in terms
of cost and benefit?
Which system variables have the highest
198
Livani E., Paikari E. and Ruhe G..
DECISION SUPPORT SYSTEM FOR COST-BENEFIT ANALYSIS IN SERVICE PROVISION.
DOI: 10.5220/0003514101980203
In Proceedings of the 13th International Conference on Enterprise Information Systems (ICEIS-2011), pages 198-203
ISBN: 978-989-8425-54-6
Copyright
c
2011 SCITEPRESS (Science and Technology Publications, Lda.)

impact on cost and benefit?
• What’s the impact of a certain service on
tactical level variables?
In the next section, the architecture of the
proposed decision support system will be explained.
Then, the results of a case study evaluation of the
framework will be analyzed in Section 3. Finally,
Section 4 concludes the paper.
2 ARCHITECTURE OF THE
DECISION SUPPORT SYSTEM
The decision support system proposed in this paper,
as shown in
Figure 1, consists of three layers: user,
strategic, and tactical. These layers will be discussed
in depth in the following subsections.
Figure 1: Architecture of the DSS.
2.1 User Layer: Services and their
Mapping to the System Variables
Services are realized by unique combination of the
system variables and are associated with their own
cost and benefit. This layer, basically, maintains the
definitions of the services, system variables, and the
mapping between them. Mapping of a service to the
variables means determining the variables which are
affected by implementing it. This effect is measured
by changing in probability distributions of the input
variables in the BBN model (see the next
subsection).
2.2 Strategic Layer: Cost-benefit
Trade-off Analysis with BBN
At the strategic layer, Bayesian belief network
(BBN) is used to analyze the effect of the input
variables on the outputs of the model. A BBN is a
directed acyclic graph consisting of nodes and arcs
with a conditional probability distribution associated
with each node (Heckerman, 1997) (Fenton, 1999).
Nodes represent domain variables, and arcs
represent probabilistic dependencies between them.
Basically, in a BBN model there are three types
of variables: root, internal, and leaf. Root variables
are the inputs to the model so they don’t have any
incoming link from the other variables, as opposed
to the leaves which are output of the model and only
accept incoming links. Internal variables lie in the
middle connecting the former two types to each
other.
The BBN model in this research is used for three
well-known analysis types: user scenario, sensitivity,
and backward (goal-seek). A scenario can be created
by changing the probabilities of the input variables
or considering them as evidence i.e. setting them to
one of their possible values (by 100%). Each
scenario leads to different probabilities for the leaf
variables. The comparison of the scenarios means
comparison of the probabilities of the leaf variables.
We assume that in the BBN model there are two
output variables, one for cost and one for the benefit.
But the model is extensible to more outputs.
We define an abstract function F to map each
scenario (S) to a point in a 2-dimensional Cartesian
space. For each dimension, one for cost and one for
benefit, the function F is represented by Formulas 1
and 2. In Formula 1, c is the size of the states for the
‘Cost’. V
(k) is the probability of the ‘Cost’ being
state k. Similarly, in Formula 2, b is the size of the
states for the ‘Benefit’ and V
(k) is the
probability of ‘Benefit’ being k.
(
,
)
:
()| = 1 …
→ℝ
(1)
(
,
)
:
()| = 1 … → ℝ (2)
This mapping function, which is abstract, plays
an important role in the scenario analysis. A simple
concrete form of it could be the difference of the
probabilities compared to the baseline situation
(baseline is the initial model without any evidences).
See Formulas 3 and 4 as examples. The goal is to
minimize the F(., Cost) and maximize the F(.,
Benefit).
The sensitivity analysis is pretty similar to the
scenario analysis, except the fact that the scenarios
are created, not by prior knowledge instead, by
setting each root variable (or internal) to its states
one by one and keeping other variables unchanged.
As a result,
∑
(
)
scenarios will be created for
Tactical:
Optimization
User:
Services
Variables which
needs to be calculated
at the tactical level
Impact on tactical
level variables
Cost-benefit
Trade-off Analysis
Variables associated
with each service
Strategic:
BBN
DECISION SUPPORT SYSTEM FOR COST-BENEFIT ANALYSIS IN SERVICE PROVISION
199

root variables, where r is the size of the root
variables and P(R
k
) is the size of the states for
variable R
k
. Similarly, for the internal variables
∑
(
)
scenarios are created, where i is the size
of the internal variables and P(I
k
) is the size of the
states for variable I
k
.
In any of the above analyses, user scenario and
sensitivity, the probability of the leaf variables (cost
and benefit) will be calculated for each scenario.
Using Formulas 1 and 2, the trade-off graph will be
created for all the scenarios. Figures 2 and 3 are
example results (they will be discussed in Section 3).
We used Pareto optimal solution (POS) to analyze
the trade-off graph.
Definition 1. Assume we have set P of points, each
point representing a scenario’s impact on Cost and
Benefit, measured by Formulas 1 and 2. Set P* ⊆ P
is called Pareto set if no point in P* is dominated by
a point in P (Nanazawa, 2009). We say point A
dominates B if it has lower cost but higher benefit.
For example, in Figure 2 the circled points are
Pareto points.
In the backward analysis, evidence is set for a
leaf variable instead of a root or internal one. The
model will then suggest new probability
distributions for the root and internal variables. This
analysis specifies the requirements of the model in
order to create the desired outputs. However, the
suggested probabilities for the root variables might
not always be feasible. So, an interaction with the
expert (user of the BBN model) is usually needed to
come up with an acceptable scenario.
2.3 Tactical Layer: Optimizing
Operational Resources
Although analyzing the services at the strategic layer
gives an insight on their cost and benefit, it can be
further supported by measuring their resource
consumption in the tactical layer. In this paper, the
resources are the vehicles; so the problem will then
be the vehicle routing (VR) optimization. However,
our approach is a bit different from the traditional
VR problem as we consider the intersections of the
roads as the nodes of the graph and the roads
between them as the edges. This will reduce the size
of the problem dramatically.
We introduced a customized solution to this
problem (named DCPP) by combining Chinese
Postman Problem (CPP) (Edmonds, 1973) and
Dijkstra shortest path algorithm (Cormen, 2009). H.
Thimbleby (Thimbleby, 2003) proposed a heuristics
for CPP in a connected directed graph. We extended
it in order to make it work in disconnected graphs as
well. Table 1 shows the pseudo code of DCPP
algorithm.
First (steps 1-2), the graph G´ is created by
removing the edges with weight 0 (no service point
on them) from G. Then (steps 3-5) the closest sub-
graph in G´ to the starting node is found. The closest
sub-graph is defined as the one which has a node
that is closest to the start node, based on Dijkstra
shortest path algorithm. In step 6 the CPP problem is
solved for this sub-graph. Then the next closest sub-
graph to the last visited node of the previous sub-
graph is found, again using Dijkstra. This process is
repeated until all the sub-graphs are visited. At the
end, the shortest path is taken to the starting node to
complete the circuit.
The optimized values will then be used for two
purposes:
1. As an additional support for selecting the
decision alternatives (services) by presenting the
actual effect on resource consumption;
Table 1: Pseudo code of the DCPP algorithm.
0 Algorithm DCPP (G: input graph, S: start node);
1 G´ Å Remove edges with weight 0 from G;
2 SG´ Å Set of sub-graphs in G´;
3 V Å S;
4 Route Å {};
5 SG Å Find the closest sub-graph in SG´ to node V based on
Dijkstra shortest path algorithm;
6 Route Å Solve the standard CPP problem for SG and append
to previous Route;
7 SG´ Å Remove SG from SG´;
8 V Å last node visited in SG;
9 Repeat steps 5-8 until SG´ goes empty
10 Find the shortest path from the last visited node to S
ICEIS 2011 - 13th International Conference on Enterprise Information Systems
200

2. To feed back the BBN model with,
potentially, the new probabilities (or even
evidences) for some of the input variables. Input
variables in the BBN model could be indirectly
related to each other, so the optimization will
suggest the optimized value for one, based on a
change in the other one.
3 CASE STUDY
The City of Calgary business unit for Waste &
Recycling Services (WRS) manages residential
waste and recycling collection for 300,000
residential homes and operates three landfills and
various community recycling depots. Examples of
the decisions made regularly at the WRS include:
• Strategic level decisions like the budget, type
and level of the services, training of the staff,
etc.; and
• Tactical (or operational) level decisions like
the number of humans and vehicles, routing
of the vehicles, etc.
In the following subsections, the results of the
case study evaluation for each component of the
decision support system, presented in Section 0, will
be discussed.
3.1 User Layer
Examples of the services at WRS are: collection of
the residential waste and recycling, commercial
waste and recycling, and Christmas tree collection.
These services are unique as they need their own
planning, budget, resources, and income. The cost of
the services is measured by the actual resource
consumption, which are mainly the human/vehicle
used. The income (benefit) is a bit different though.
For the commercial collection, the benefit is simply
the charge, but for the residential units it’s measured
as the quality of the services (QoS). The WRS runs a
survey each year to measure the customer
satisfaction and interprets it as the QoS. So, if WRS
increases the collection days per week for the
residential waste, the QoS will increase but at the
same time the cost will increase too. Therefore, the
trade-off between cost and QoS is always pursued.
3.2 Strategic Layer
In this experiment we focused on the residential
waste collection. To elicit the system variables, we
used a tool named Very Best Choice Light
TM
(VBC)
(Ruhe, 2010). VBC is a collaborative DSS for
eliciting and ranking system variables, requirements,
or features. Stakeholders are defined in VBC to rank
the variables. Consulting with the WRS experts, 20
stakeholders (from WRS and some external ones)
and 20 initial variables were defined and devised as
5 groups: human, vehicle, routing, quality of service,
and logistics. The stakeholders were asked to:
• Revise the variables, introduce new ones, or
remove existing ones
• Rank the variables based on their impact on
the cost
We selected the top 15 variables and built the
BBN model using knowledge of the domain experts
at WRS. The model and its variables are accessible
on (Livani, 2011). SamIam (SamIam, 2011) was
used to analyze the BBN model.
The objective function of Formulas 1 and 2 has
been instantiated as Formulas 3 and 4, for Cost and
QoS respectively.
(
,,
)=
−
+(
−
)
(3)
(
,,
)=
−
+(
−
)
(4)
In Formula 3,
is the probability of Cost
being ‘High’ for scenario S
i
and
for the
baseline scenario (S
0
).
is the probability of
Cost being ‘Low’ for scenario S
i
and
for the
baseline. The objective function is defined similarly
for QoS as Formula 4. So if the probability of being
‘High’ is increasing by a change in the inputs, it
means the Cost (or QoS) is increasing in that
scenario. But if the probability of being ‘Low’ is
increasing, it means the Cost (or QoS) is decreasing.
We’ve ignored the ‘Medium’ category for now
because increasing (or decreasing) of it doesn’t
affect the Cost or QoS directly.
The baseline scenario resulted in probabilities for
Cost and QoS respectively being as (46%, 49%, 5%)
and (67%, 18%, 15%) for (High, Medium, Low)
categories.
The next step is the sensitivity analysis. We
created 75 scenarios by setting each variable (root
and internal variables) to one of its possible states at
a time (as an evidence), while keeping the other
variables unchanged. The scenarios can be found on
(Livani, 2011). Two graphs have been created, one
for the root (Figure 2) and one for the internal
variables (Figure 3). The circled points in each graph
show the Pareto points, which dominate the other
points in both Cost and QoS aspects.
DECISION SUPPORT SYSTEM FOR COST-BENEFIT ANALYSIS IN SERVICE PROVISION
201
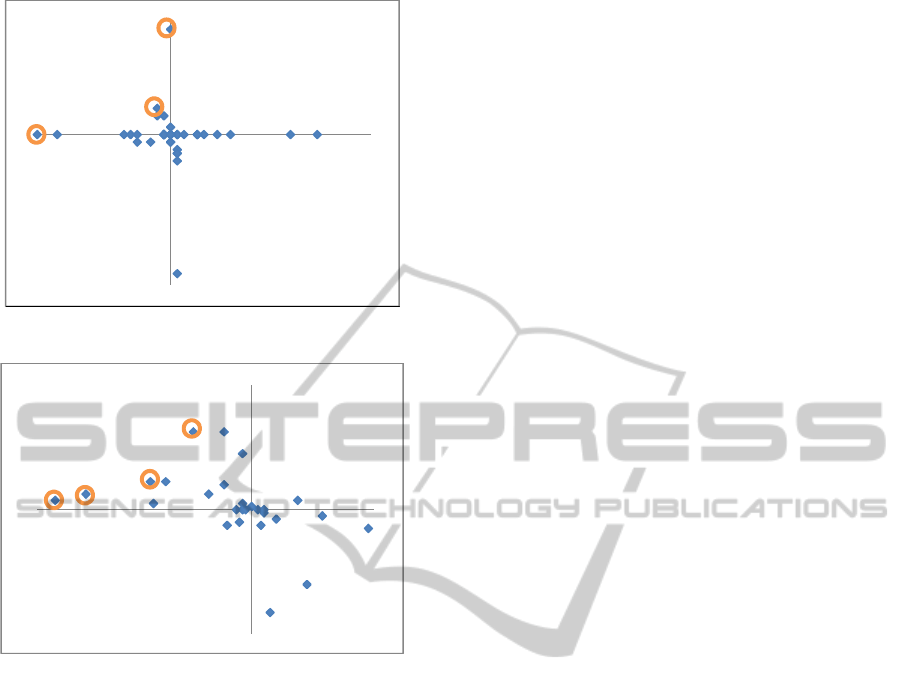
Figure 2: Cost vs. QoS trade-off for input variables.
Figure 3: Cost vs. QoS trade-off for internal variables.
There is a difference between Figures 2 and 3.
Pareto points in Figure 2 are related to the input
variables, so they should be possible to achieve
because they are the user inputs. But in Figure 3 the
Pareto points are related to the internal variables
which will then create new probabilities for the input
variables. These new values might not be always
achievable due to the restrictions in the inputs. So,
the interaction with the user is needed to adjust the
probabilities.
3.3 Tactical Layer
We applied the DCCP algorithm to a part of the road
network of the City of Calgary. Each part is named a
‘beat’ and is defined as an area of the city which can
be services by one vehicle in one day. The data,
provided by the WRS, contained the roads and
intersections between them, length and direction of
the roads.
The optimized routes, created by the DCPP
algorithm, showed 20% improvement in the total
length of the routes taken by the trucks, compared to
the actual routes taken by the city vehicles. We also
integrated our results with ArcGIS (ESRI, 2011) to
visualize the routes, available at (Livani, 2011).
3.4 Interaction between Strategic and
Tactical Layers
The goal of the tactical layer is not just optimizing
the operational resources. The results of the tactical
layer are fed back to the strategic layer to re-analyze
the model. One of the strategic variables in the BBN
model is the ‘KM Travelled per day’. This variable
is directly affected by the beat design, which is
usually unique for each service (waste, recycling,
etc.). So, any change at the strategic layer which has
an impact on the beat designs, needs to be further
evaluated at the tactical layer by the optimization
component. New values for this variables leads to
new probabilities for the system variables. Therefore,
the BBN model must be re-run. Another impact of
the optimized routes will be decreasing the
productivity of the collectors (human resources)
every time that new routes are created. Therefore,
again, the model needs to be re-run and new Pareto
points will be generated.
4 CONCLUSIONS & FUTURE
WORK
In this paper a novel decision support system for
cost-benefit analysis in service provision has been
proposed. It consists of three layers: user, strategic,
and tactical. Services and their mapping to system
variables are defined at the user layer. At the
strategic layer, Bayesian belief network (BBN) is
used to analyze the effect of the input variables on
the outputs (here cost and benefit). Results are
presented in the form of trade-off between cost and
benefit; using Pareto optimal solution.
The strategic decisions will be evaluated further
at the tactical layer through resource optimization.
We evaluated our DSS in a case study with the
Waste and Recycling Services (WRS) unit of the
City of Calgary, Canada. Results showed that
analyzing a service at the strategic level and
implementing it at the tactical level is not enough.
Instead, the optimization results must be analyzed to
see which variables are impacted by the new values.
Then the BBN must be re-run to create new Pareto
points. This will lead to an iterative process for
evaluating and composing the new services.
In this paper the initial (whilst recent) evaluation
-40%
-20%
0%
20%
-20% 0% 20%
F(., QoS, S
0
)
F(., Cost, S
0
)
-40%
-20%
0%
20%
40%
-70% -20% 30%
F(., QoS, S
0
)
F(., Cost, S
0
)
ICEIS 2011 - 13th International Conference on Enterprise Information Systems
202

of an ongoing work towards creating a DSS for
service engineering has been presented. Further
analyses and investigations are needed to increase
the accuracy and acceptance of the results. This can
be done through more discussions with the domain
experts and also mining the data available at the
WRS. Using the Multi-Criteria Decision Analysis to
further analyze and compare the Pareto points is also
among our future works.
ACKNOWLEDGEMENTS
We would like to thank Natural Sciences and
Engineering Research Council (NSERC) of Canada
for partly supporting this research; project no.
386808-09. We also would like to appreciate the
Waste and Recycling Services of the City of Calgary
for their support and assistance when running the
case study.
REFERENCES
Bullinger, H., Fähnrich, K. & Meiren, T., 2003. Service
engineering--methodical development of new service
products. International Journal of Production
Economics, 85(3), pp.275-287.
Cormen, T. H. et al., 2009. Introduction to Algorithms,
Third Edition 3rd ed., The MIT Press.
Edmonds, J. & Johnson, E.L., 1973. Matching, Euler tours
and the Chinese postman. Mathematical Programming,
5(1), pp.88-124.
ESRI, 2011, http://www.esri.com.
Fenton, N. E. & Neil, M., 1999. Software metrics:
successes, failures and new directions. Journal of
Systems and Software, 47(2-3), pp.149-157.
Fenton, N. & Neil, M., 2001. Making decisions: using
Bayesian nets and MCDA. Knowledge-Based Systems,
14(7), pp.307-325.
Fineman, M., Fenton, N. & Radlinski, L., 2009. Modelling
Project Trade-Off Using Bayesian Networks. In
Computational Intelligence and Software Engineering,
2009. CiSE 2009. International Conference on.
Computational Intelligence and Software Engineering,
2009. CiSE 2009. International Conference on. pp. 1-4.
Available at: 10.1109/CISE.2009.5364789 [Accessed
October 15, 2010].
Heckerman, D., 1997. Bayesian Networks for Data
Mining. Data Mining and Knowledge Discovery, 1,
pp.79–119.
Ibrahim, H., Far, B. & Eberlein, A., 2009. Tradeoff and
Sensitivity Analysis of a Hybrid Model for Ranking
Commercial Off-the-Shelf Products. In Engineering of
Computer Based Systems, 2009. ECBS 2009. 16th
Annual IEEE International Conference and Workshop
on the. pp. 119-127. Available at:
10.1109/ECBS.2009.47 [Accessed September 22,
2010].
Kapitsaki, G. M. et al., 2009. Context-aware service
engineering: A survey. Journal of Systems and
Software, 82(8), pp.1285-1297.
Livani, E, http://www.ucalgary.ca/~elivani/DSSCBA.xls.
Liu, K. & Ong, T., 1999. A Modelling Approach for
Handling Business Rules and Exceptions. The
Computer Journal, 42(3), pp.221 -231.
Liu, K., Alderson, A. & Qureshi, Z., 1999. Requirements
recovery from legacy systems by analysing and
modelling behaviour. In Software Maintenance, 1999.
(ICSM '99) Proceedings. IEEE International
Conference on. Software Maintenance, 1999. (ICSM
'99) Proceedings. IEEE International Conference on.
pp. 3-12.
Liu, Y. et al., 2003. A Cost-Benefit Evaluation Server for
decision support in e-business. Decision Support
Systems, 36(1), pp.81-97.
Nanazawa, Y., Suito, H. & Kawarada, H., 2009.
Mathematical study of trade-off relations in logistics
systems. Journal of Computational and Applied
Mathematics, 232(1), pp.122-126.
Ruhe, G., 2010. Product Release Planning: Methods,
Tools and Applications 1st ed., Auerbach Publications.
Sakao, T. & Shimomura, Y., 2007. Service Engineering: a
novel engineering discipline for producers to increase
value combining service and product. Journal of
Cleaner Production, 15(6), pp.590-604.
SamIam, 2011, http://reasoning.cs.ucla.edu/samiam.
Shirazi, A. et al., 2009. A framework for combined
bayesian analysis and optimization for services
delivery. In Service Operations, Logistics and
Informatics, 2009. SOLI '09. IEEE/INFORMS
International Conference on. Service Operations,
Logistics and Informatics, 2009. SOLI '09.
IEEE/INFORMS International Conference on. pp.
382-387. Available at: 10.1109/SOLI.2009.5203963
[Accessed September 14, 2010].
Sundin, E., Öhrwall Rönnbäck, A. & Sakao, T., 2010.
From component to system solution supplier: Strategic
warranty management as a key to efficient integrated
product/service engineering. CIRP Journal of
Manufacturing Science and Technology, 2(3), pp.183-
191.
Thimbleby, H., 2003. The directed Chinese Postman
Problem. Software: Practice and Experience, 33(11),
pp.1081-1096.
Zoric, J., 2011. Connecting business models with service
platform designs: Exploiting potential of scenario
modeling. Telematics and Informatics, 28(1), pp.40-54.
DECISION SUPPORT SYSTEM FOR COST-BENEFIT ANALYSIS IN SERVICE PROVISION
203
