
EXPLORING THE DIFFERENCES IN SURFACE
ELECTROMYOGRAPHIC SIGNAL BETWEEN
MYOFASCIAL-PAIN AND NORMAL GROUPS
Feature Extraction through Wavelet Denoising and Decomposition
Ching-Fen Jiang
1
, Nan-Ying Yu
2
1
Department of Biomedical Engineering, I-Shou University, Kaohsiung, Taiwan
2
Department of Physical Therapy, I-Shou University, Kaohsiung, Taiwan
Yu Ching Lin
Department of Physical Medicine and Rehabilitation, National Cheng Kung University, Tainan, Taiwan
Keywords: Myofascial pain, Surface electromyography, Wavelet energy.
Abstract: Upper-back myofascial pain is an increasingly significant syndrome associated with frequent computer
using. However, the changes in neuromuscular functions incurred by myofascial pain are still under-
discovered. This study aims to discover the changes in neuromuscular function on the taut band through
signal analysis of surface electromyography. We first developed a fully automatic algorithm to detect the
duration of an epoch of muscle contraction. Following that, the features of epochs in both time-domain and
frequency-domain were extracted from the 13 patients to compare with the measurement from 13 normal
subjects. The higher contraction strength with lower median frequency found in the patient group is similar
to the reported changes with muscle fatigue. The signal was further analyzed by wavelet energy of 17 levels.
The result shows that the energy measured from the patients exceeds that from the normal group at the low
frequency band, suggesting that an increasing synchronization level of motor unit recruitment may cause the
drop in the median frequency and the increase in contraction strength.
1 INTRODUCTION
Nowadays due to the popularity of using computer
and increasing working stress, myofascial pain
(MFP) has been a common occupational hazard. The
number of people with this syndrome seeking
medical treatment is increasing abruptly. Although
there are various inferences for the etiology of MFP,
the investigation into any induced changes in
neuromuscular functions is rare.
The detected signal form surface
electromyography (SEMG) is called the interference
pattern (IP), which provides considerably more
diagnostic information than that of the motor unit
action potential (MUAP) along. The IP is commonly
used to predict the muscle force and evaluate the
muscular motor functions in several fields such as
rehabilitation, and sport and geriatric medicine. The
popularity of application of SEMG in clinics is due
to non-invasiveness. Past efforts to analyze SEMG
signals were mainly based on the feature extractions
in time (Fricton et al., 1985) or frequency domain
(Hagberg and Kvarnstrom, 1984) separately. These
methods do not take both time and frequency
variation into account in an optimal sense. However,
since the IP is comprised of the summation of
MUAP trains from all active motor units within the
surface electrode recording range; as a result of that,
the variations in MUAP shapes and sizes are
averaged. In addition, the SEMG signal is non-
stationary as its statistical properties change over
time and usually contaminated with random noises.
All these factors can lead to a loss of key motor
control information contained in the signal.
Therefore, the non-stationery nature of SEMG signal
associated with the large subject-dependent
variances in its parametric measures hinder
practitioners from interpreting their clinical findings.
203
Jiang C., Yu N. and Ching Lin Y..
EXPLORING THE DIFFERENCES IN SURFACE ELECTROMYOGRAPHIC SIGNAL BETWEEN MYOFASCIAL-PAIN AND NORMAL GROUPS -
Feature Extraction through Wavelet Denoising and Decomposition.
DOI: 10.5220/0003515402030206
In Proceedings of the International Conference on Signal Processing and Multimedia Applications (SIGMAP-2011), pages 203-206
ISBN: 978-989-8425-72-0
Copyright
c
2011 SCITEPRESS (Science and Technology Publications, Lda.)
The wavelet transform (WT) is an efficient tool
for multi-resolution analysis of non-stationary and
fast transient signals. These properties make it
especially suitable to study the neurophysiological
signals. Numerous WT applications in biosignal
analysis have been proposed, including for EMG
analysis (Arikidis et al., 2002, Kumar et al., 2003).
In our previous study (Jiang and Kuo, 2008), we
have developed a wavelet denosing method that can
automatically detect the occurrence of SEMG
epochs and render more consistent and stable epoch
strength. Based on this denoising method, this study
further applies feature extraction and analysis of
SEMG signal in both time and frequency domain to
explore the changes in neuromuscular function with
MPF.
2 MATERIALS AND METHODS
2.1 SEMG Measurement
We recruited two groups of participants with the age
ranged from 30 to 50 years old. One was the patient
group and the other is normal group. Table 1
provides the descriptive information of the
participants. In order to make a consistent condition,
only the right-handed participants were selected.
The active electrodes MA-411 were attached on
the taut-band loci at the right side of the upper back
to measure the SEMG signal. The analogue signal
was amplified up to 3800 times and band-passed
(20Hz to 3,000Hz) by MA-411 and then digitized
with 5000 kHz sampling rate by instruNet 100 data
acquisition card and transferred to computer for
further analysis.
The participant conducted only five repetitive
trials. For each trial, participants lay down on their
stomach steadily for standby at the first three beats
and lifted both their arms toward the ceiling on the
4th beat with their maximal force, released the hold
on the 5th beat. One beat last one second, so each
trial last for 5 seconds.
Table 1: Descriptive information about participants.
Variable patient group normal group
Number 13 13
age (years) 41.2±6.2 39.5±7.3
weight (kg) 58.6±7.5 59.3±8.7
2.2 Denoising and Epoch Detection
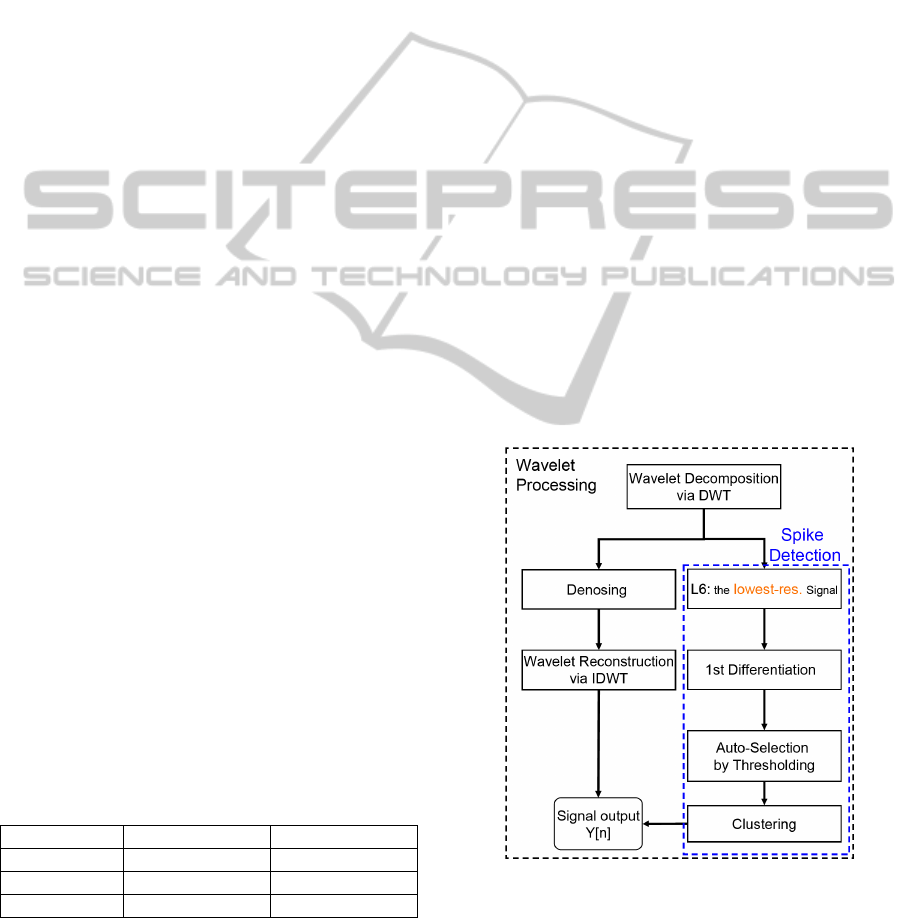
The overall procedure to detect the occurrences of 1-
sec epoch for each contraction is summarized in
Figure 1. According to our previous comparative
study, we first applied Universal-soft denoising
method to yield the reconstructed signal with the
best signal quality. Following that, the 1
st
differentiation of the denoised signal was calculated
to detect the abrupt spikes, contained in each epoch.
Finally, the dominate spike, indicating the central
location of the epoch, was detected by using our
developed multi-resolution thresholding algorithm
based on statistical clustering process. The principle
of the algorithm is based on the existence of an
optimal threshold that should separate the population
into two groups with maximal between-class
variance. This concept was originally proposed by
Otsu for image segmentation (Otsu, 1979).
However, the distribution of the SEMG signal
derivatives is not like an image histogram with
definite discrete levels. To circumvent this problem
of indefinite derivatives, we developed a novel auto-
thresholding algorithm with multi-resolution
concept. The algorithm is described in detail in the
reference(Jiang and Kuo, 2008).
Once the central location of the epoch is
determined, then the duration can be spread
symmetrically toward both side of it within 1 sec.
(each side contains 2500 sampling points). The
following feature analysis was subject to the
detected epochs.
Figure 1: Wavelet processing.
2.3 SEMG Analysis
Three features were extracted from the SEMG
activity for group comparisons to examine the
SIGMAP 2011 - International Conference on Signal Processing and Multimedia Applications
204
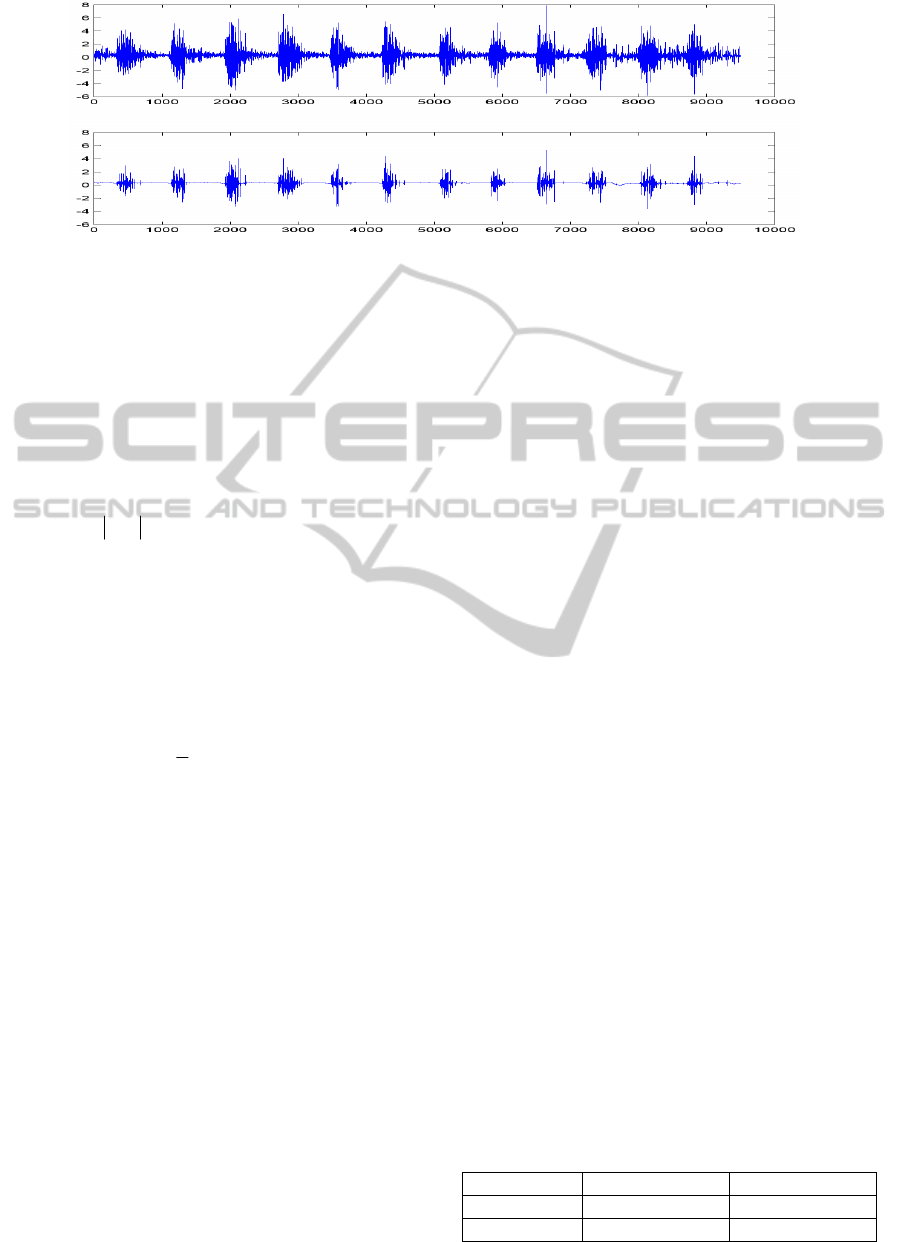
Figure 2: Top panel shows the original SEMG signal from the muscle contraction at a constant pace and the corresponding
signal after denoising shown in the bottom panel.
difference between normal and MFP contraction.
They are described separately in detail as follows.
Root mean square (RMS) of a SEMG epoch
is an index to evaluate the strength of the
corresponding muscle contraction. It can be
calculated as the summation of amplitude
square within an epoch according to
∫
+
==
Tt
t
dttmTtmRMS
2/12
])([/1})({
(1)
Median frequency (MDF) is a common
parameter derived from the power spectrum
density (PSD) of SEMG signal to evaluate
the activity of muscle fiber recruitment and
conduction. The definition of MDF is the
frequency where the area of the PSD is
exactly half of total area of the PSD as
∫∫
∞
=
00
)(
2
1
)( dffPSDdffPSD
MDF
(2)
Wavelet energy is a quantifier commonly
used to evaluate signal strength in a specific
frequency band through wavelet
decomposition. The wavelet energy (Ej) at
level j is defined as the summation of the
power of the “detail” coefficient (dj[m]).
2
1
])[( mdE
n
m
jj
∑
=
=
(3)
We further made a plot of wavelet energy (E
j
)
versus decomposition level (j) and fitted the plot into
a curve using a non-linear regression model.
3 RESULTS AND DISCUSSIONS
The results are described from two aspects as
follows.
3.1 Denoised Signal and Detected
Epochs
The effect of the denoising process for the SEMG
signal is illustrated in Figure 2. It can be found that
the denoised signal still keeps the epoch location and
preserves the features.
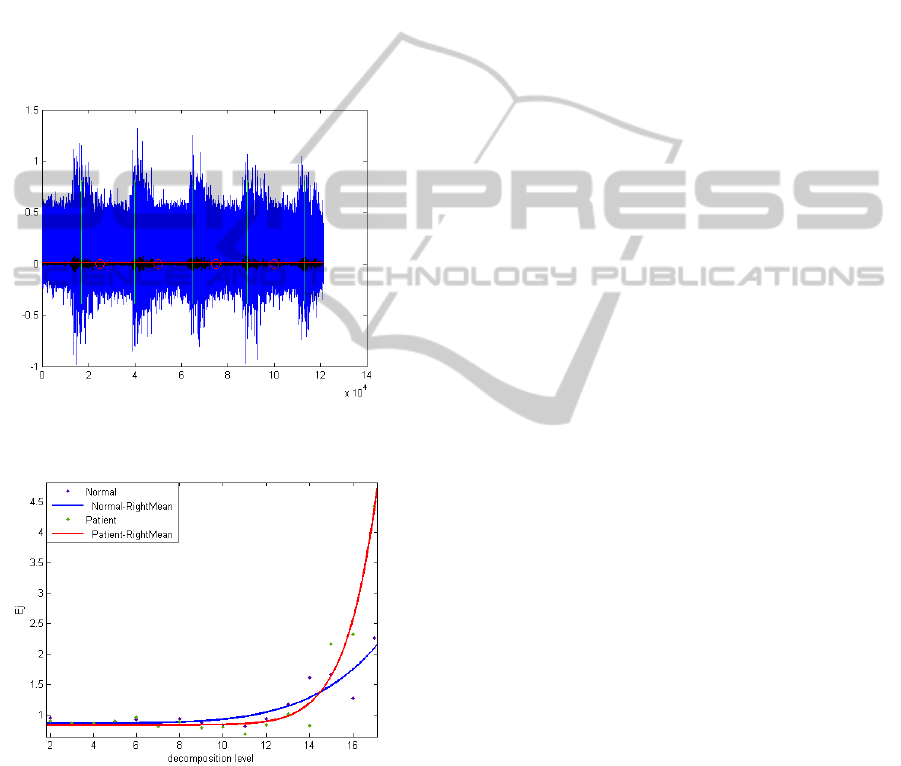
An example of the detection of the occurrences
of SEMG epoch is given in Figure 3.
3.2 Group Comparison of SEMG
Features
The analysis in the time domain shows that the RMS
from the patient group is slightly higher than that of
normal group. The power-spectrum analysis shows
that the MDF from the patient group is lower than
that of normal group. Table 2 summarizes the results
of those analyses.
From the results of the comparative study, it is
evident that the SEMG signal from the MPF
participants tends to have greater RMS amplitudes
than that from the normal subjects. This result agrees
with the finding of the previous study (Fricton et al.,
1985, Hagberg and Kvarnstrom, 1984). The
decreasing median frequency observed in the power
spectral density of the SEMG from MPF subjects is
similar to a fall in median frequency during muscle
fatigue (Hagberg and Kvarnstrom, 1984).
The result of wavelet analysis (Figure 4) shows
an increasing energy gap between patient and
normal groups as the decomposition level increases,
especially beyond level 8.
Table 2: Comparison of the SEMG features between two
groups.
Variable patient group normal group
RMS (volt) 0.98±0.07 0.94±0.13
MDF (Hz) 966.6±28.7 975.8±20.7
EXPLORING THE DIFFERENCES IN SURFACE ELECTROMYOGRAPHIC SIGNAL BETWEEN
MYOFASCIAL-PAIN AND NORMAL GROUPS - Feature Extraction through Wavelet Denoising and Decomposition
205
Our finding in increasing energy difference in
the lower-frequency-band is in accord with the
finding of previous approach regarding muscle
fatigue (Kumar et al., 2003). The WT of a signal
provides a multiresolutional decomposition of the
signal for the analysis of signal components at
different scales in the time domain. The energy in
the higher decomposition level is contributed by the
signal in the coarser resolution or within the lower
frequency-band. In addition, the greater wavelet
energy derived from MPF SEMG signal than that
from the normal SEMG signal in the lower-
frequency-band could be a reflection of the drop in
the median frequency of the spectral analysis.
Figure 3: The detected center of the epoch for each
contraction is indicated as the green bar.
Figure 4: The trend of difference in the wavelet energy
between the MDF patients and the normal subjects across
the 17 frequency levels.
4 CONCLUSIONS
In recent years, Upper-back myofascial pain (MP) is
increasingly found to be associated with consistent
computer using. We postulate that MP could be due
to muscle fatigue caused by long-lasting computer
usage. However, the effect of MP on the muscle
function is unclear. Therefore in this study we tried
to use the wavelet energy to analyze differences in
SEMG signal between MP and normal groups.
Results either in the time domain or in the
frequency domain show similar changes found in
muscle fatigue. Wavelet analysis further explores
that these changes may be attributed to the
increasing difference towards the lower frequency-
band, as the result of the increasing synchronization
level of motor units recruitment. These finding may
suggest that the changes in neuromuscular function
associated with myofascial pain can be induced by a
long-term muscle fatigue.
REFERENCES
Arikidis, N. S., Abel, E. W. & Forster, A. 2002. Interscale
wavelet maximum-a fine to coarse algorithm for
wavelet analysis of the EMG interference pattern.
Biomedical Engineering, IEEE Transactions on, 49,
337-344.
Fricton, J., Auvinen, M., Dykstra, D. & Schiffman, E.
1985. Myofascial pain syndrome: electromyographic
changes associated with local twitch response.
Archives of physical medicine and rehabilitation, 66,
314-317.
Hagberg, M. & Kvarnstrom, S. 1984. Muscular endurance
and electromyographic fatigue in myofascial shoulder
pain. Archives of physical medicine and rehabilitation,
65, 522-525.
Jiang, C. F. & Kuo, S. L. 2008. Detection of occurrence of
motor unit action potential in the surface
electromyographic signal based on wavelet denoising.
International Journal of Electrical Engineering, 15,
161-168.
Kumar, D. K., Pah, N. D. & Bradley, A. 2003. Wavelet
analysis of surface electromyography to determine
muscle fatigue. IEEE Trans Neural Syst Rehabil Eng,
11, 400-406.
Otsu, N. 1979. A Threshold Selection Method from Gray-
Level Histograms. IEEE Transactions on Systems,
Man and Cybernetics,, SMC-9, 62-66.
SIGMAP 2011 - International Conference on Signal Processing and Multimedia Applications
206
