
THE CONSTRUCTION OF ECONOMIC MODEL EVALUATION
SYSTEM BASED ON THE ECONOMIC MODEL OF RESOURCE
PLATFORM
Rong Ruan, Zhenji Zhang
School of Economics and Management, Beijing Jiaotong University, Haidian District, Beijing, China
Jingjing Meng
School of Economics and Management, Beijing Jiaotong University, Haidian District, Beijing, China
Keywords: Economic model, Evaluation system, Index, Weight, Analytic hierarchy process, Capability coefficient.
Abstract: With the development of computer and information technology, more network technology have been
applied into teaching area. The economic model resources platform is firstly built by schools of economics
and management, which hosting a economic model library. And those models come from classical or
innovation models and are built by teachers and students, using technologies such as Matlab and website
development to display on the platform. As one kind of teaching resources, the economics model should be
well built on the platform to enable the learners easily understanding. Then what standard can we find to
determine the quality of the economic models? So we need construct a evaluation system to help students
select models for learning. This article combines AHP with qualitative and quantitative method and Delphi
to construct the evaluation system. Finally we applicate the system to evaluate the economic models. It can
help the learners to select high quality models. And for the bad quality models, the managers can improve
them.
1 INTRODUCTION
With the rapid development of information
technology, network technology has been inserted in
teaching (Huang Dequn, 2005). But how to raise the
quality of growing teaching resources? It becomes a
topic people concerns, especially the designing and
evaluation of the network resources.
In order to study the interdependence quantitative
relationship between economic phenomena and help
people solve real economic problems, we build the
economic model library. For example,
Black_Scholes Options Pricing Model and Cartel
model of oligopoly market. Its website is
http://211.71.64.167/exper.
Now the quality of the models is uneven, how to
judge those models' quality and give reference for
the teachers and students has become the focus of
the model management. This article gives researches
on how to construct and use the economic model to
evaluation system by using AHP from management
and development perspective.
2 CONSTRUCT EVALUATION
INDEX SYSTEM OF
ECONOMIC MODELS
The economic model evaluation system is study on
the economic models on the platform, and it is used
by the manager and users of the platform. Whether a
model has the value to learn, the standard we trust is
very important.
We use analytical method (Sun Wenhong, 2010)
and AHP (Jin Zhilong, 2009) to get the evaluation
index system, following the two principles (Zhao
Yang, 2006): comprehensive and independent.
According to the principle of AHP, we divide the
system into three lever: target, rule and program
layers (Xu Wenxue, 2010). After consulting criteria
376
Ruan R., Zhang Z. and Meng J..
THE CONSTRUCTION OF ECONOMIC MODEL EVALUATION SYSTEM BASED ON THE ECONOMIC MODEL OF RESOURCE PLATFORM.
DOI: 10.5220/0003547603760379
In Proceedings of the 13th International Conference on Enterprise Information Systems (ICEIS-2011), pages 376-379
ISBN: 978-989-8425-53-9
Copyright
c
2011 SCITEPRESS (Science and Technology Publications, Lda.)

of teaching resources and combining the
characteristics of the economic models, we get the
target layer indicators. Then we use analytical
method to decompose the target layer indicators one
by one (Zhuang Yu, JI Meiru, 2008), and we get 11
indicators of the rule layer. Similarly as the program
layer indicators. Evaluation is like the table 2.
3 THE WEIGHT
DETERMINATION OF THE
ECONOMIC MODEL
EVALUATION SYSTEM
Because mature and easily to use, this article initially
adopts AHP method after comparison. There are 5
steps to determine the weight:
Step 1: Structuring Variables
As mentioned above, the first-level indicators are
assumed to A1, A2, A3, A4.then its corresponding
second-level indicators were set to B1m, B2n, B3k
(m, n, k are natural number). The same as the third-
level. The corresponding weight of the first-level
indicators are assumed as
w
1
,w
2
,w
3
,w
4
, then:
4
1
0 1 ( 1,2,3) (1)
1 (2)
i
i
i
iω
ω
=
⎧
≤≤ =
⎪
⎪
⎪
⎪
⎨
⎪
=
⎪
⎪
⎪
⎩
∑
Step 2: Constructing the Matrix
When comparing the same level indicators, it can
generally use "important", "slightly important ",
"obviously important ", "extremely important " to
describe the importance of one factor relative to
another factor. The results of pair wise comparison is
denoted in 1-9 scale (Wang Hao, Ma Da, 2003).
We invited 55 experts to rate economic model in
order to create a comparison matrix by questionnaire
and we got the initial data.
Steps 3: Calculating Index Weight and the Largest
Eigen Value
Determine the matrix data (Table 3 2-5 data) in
accordance with the formula and calculate the
maximum eigen value of each index and weight, the
results in Table 1.
Step 4: Consistency Test
Because the matrix structure made by the experts
do not necessarily meet the matrix consistency. In
order to limit this error, it is necessary to test the
consistency. Denoted by:
, (n is equal to the number of
indicators in matrix.)
If
2n ≤
,the matrix is always exactly the same, it
means
0CI =
.When
2n >
,the matrix's consistency
index and the ratio of the average random
consistency index are random consistency ratio. We
denote it as:
RC
.
If
R<0.1C
, the comparison matrix has satisfactory
consistency and the calculated feature vector is
reliable. Otherwise it needs to re-adjust the matrix
until with satisfactory consistency.
After calculation, all comparison matrix are
consistent, and the results credible.
Step 5: Calculation of the Total Weight
Following the step4 we can calculate every
indicator's weight and test its consistency.
Supposing the indicator i 's weight is equal to
a
i
,
its j secondary-level indicator's relative weight is
j
b
.Then this secondary-level indicator's total weight
is
ij
ab
×
.
Then use the following formula to calculate the
total random consistency index:
1
1
n
ii
i
n
ii
i
aCI
CR
aRI
=
=
=
∑
∑
While:
i
a
: the i first-level indicator's weight.
i
CI
:
the i first-level indicator's consistency index
value.
i
RI
:
the i first-level indicator's average random
consistency index values.
The final overall consistency test result is
0.028312 which is far less than 0.1. So it is
consistent with consistency. Evaluation index
system's weights are shown in Table 2.
4 VALIDATIONS AND
APPLICATION OF THE
EVALUATION SYSTEM
4.1 Example Demonstrating of the
Evaluation System
When an evaluation system is established, we need
to verify its validity and rationality. We do a
sampling survey and use two methods (lever
evaluation and evaluation system) to test the quality
of the models. By comparing the two groups, they
match very well. Through this validation, it indicates
max
1
n
CI
n
λ −
=
−
THE CONSTRUCTION OF ECONOMIC MODEL EVALUATION SYSTEM BASED ON THE ECONOMIC MODEL
OF RESOURCE PLATFORM
377
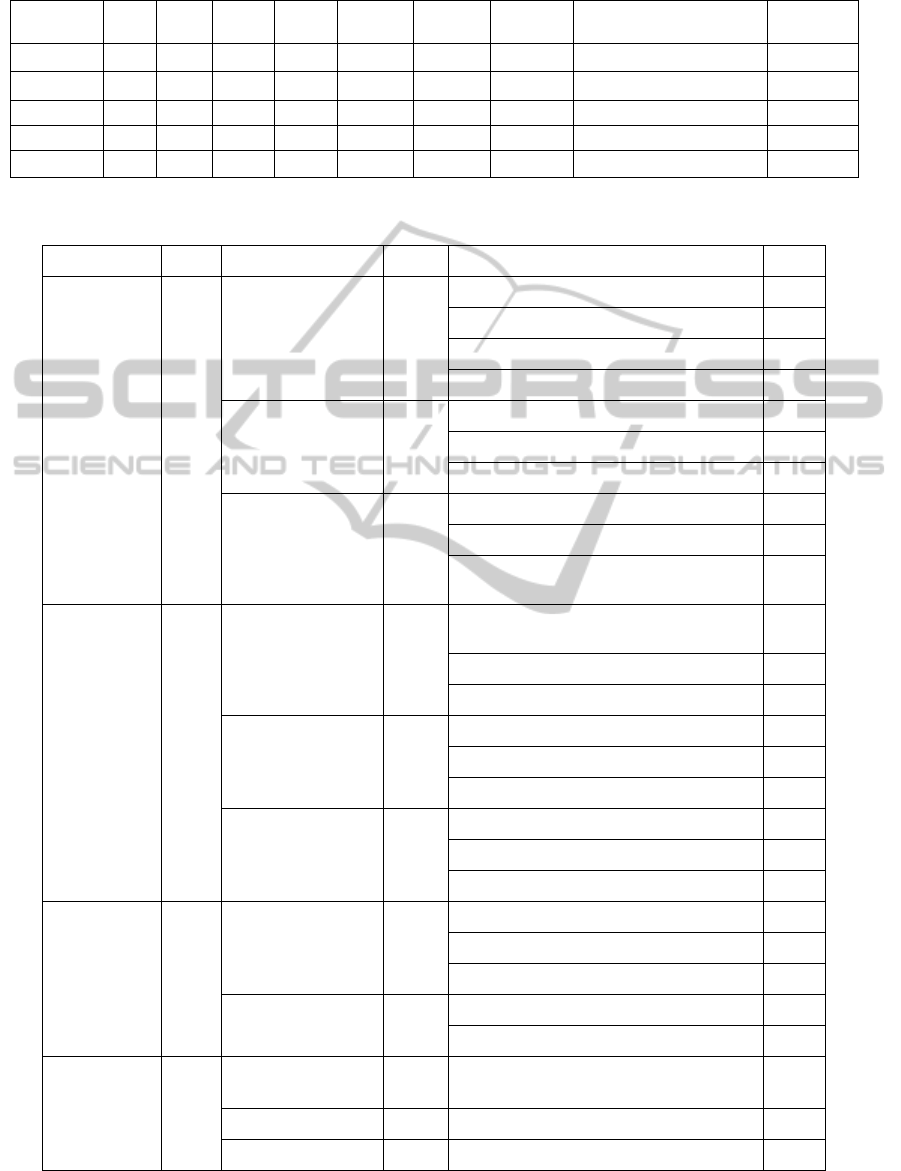
Table 1: Single evaluation index weights and the largest Eigen value.
Indicators A B C D Mi Wi (AW)i maximum Eigen value weight
A 1 2 2 1 1.41 0.34 2.04 0.696 0.505
B 0.5 1 2 2 1.19 0.29 1.58 0.451 0.327
C 0.5 0.5 1 1 0.71 0.17 0.51 0.087 0.063
D 1 0.5 1 1 0.84 0.20 0.71 0.144 0.104
total 4.15 1 1.378
Table 2: Evaluation of economic models and the corresponding weight.
A Target layer
B Rule layer
C Project layer
1 content 0.276
11 Integrity 0.124
111 Theoretical source
0.029
112 Assumptions
0.017
113 Theory to explain
0.048
114 Analysis
0.047
12 Accuracy 0.089
121 Interpretation accuracy
0.038
122 The accuracy of the understanding
0.018
123 Whether to seize the essence
0.027
13 Understandability 0.063
131 Example
0.018
132 Analogy to explain
0.009
133 Whether has interpretation of the
academic term
0.036
2 Technical 0.455
21 Operability 0.256
211 Whether the output of experimental
operation
0.148
212 Whether the result is that the process
0.053
213 Whether has input data validation
0.053
22 Friendly interface 0.067
221 Tips range of input data
0.028
222 Sample data
0.016
223 The reasonable of the control
0.022
23 Experiment to
explain
0.131
231 Experiment description
0.041
232 Interpretation of results
0.057
233 whether is the steps to explain logical 0.030
3 effectiveness 0.102
31 Intuitive 0.027
311 Text
0.015
312 Graphic description
0.008
313 Other visual presentation methods
0.004
32 Data Validation 0.075
321 The length of time to get result
0.054
322 Error rate 0.018
4 application 0.167
41 Case relevance 0.096 0.096
42 Case Study 0.035 0.035
43 Questions 0.035 0.035
ICEIS 2011 - 13th International Conference on Enterprise Information Systems
378

that the evaluation system is reasonable and
available.
4.2 The Application and Achievement
of the Evaluation System
After constructing the evaluation system, this article
introduced the correlation coefficient method (Wang
Sufen, 2007) and use the weighted average to
represent the quality. And we use the Asp and Ajax
technology to set up the system on the platform and
let it function on the management of the models.
5 CONCLUSIONS
After constructing the evaluation system, we apply it
in the evaluation of economic models on the
platform. By evaluating all models on the platform,
we can get a overall understanding of the quality of
all the economic models. Also we can know the
quantity of models on every lever. According to the
statistical results, now there are 22 models in good
lever, 110 models in middle and 38 models needing
to be improved. The evaluation result helps the
learners to select high quality models to learn, also it
provides foundation of model management for
manager.
Building a suitable and scientific evaluation
system for the pioneering economic models has been
finished, but its follow-up work which how to make
the evaluation system function well need continuing
researching. So next step we need to study the
operating mechanism of the evaluation system.
ACKNOWLEDGEMENTS
In this thesis writing process, we give special thanks
to my mentor's guidance and supervision and thank
her for understanding and tolerance.This article has
referenced to the large number of documents,and we
pay tribute to all the academic predecessors!
REFERENCES
Huang Dequn. The research based on the network teaching
evaluation [J]. Journal of remote education
magazine
2005, (4): 23-26.
Jin Zhilong, Li Duanmei. Local research institutions
performance evaluation indicator and its weight
calculation [J]. Journal of technical management
research, 2009, (12): 103-106.
Sun Wenhong. The safety evaluation index weight study
based on the analytic hierarchy process (AHP) railway
dangerous cargo standing[J]. Railway operation
technology, 2010,(2): 55-58.
Wang Hao, Ma Da. AHP scale-free evaluation and new
scale method [J]. Journal of system engineering theory
and practice, 2003, (9) : 82-86.
Wang Sufen. The methods using the correlation coefficient
to improve the principle and grading [J]. Journal of
simulation experiment on information technology,
2007, (17): 37.
Xu Wenxue. AHP in financial warning index weight the
design application [J]. Journal of accounting new
horizons, 2010, (1): 20-2
ZhaoYang. Project management achievement evaluation
system [D]. Beijing: university of north China: electric
power management science &engineering, 2006.
Zhuang Yu, JI Meiru. A Data Analysis of the Index
System of Assessment Water environmental Carrying
Capacity The National Social Science Foundation
2008 pp 1-4.
THE CONSTRUCTION OF ECONOMIC MODEL EVALUATION SYSTEM BASED ON THE ECONOMIC MODEL
OF RESOURCE PLATFORM
379
