
COST MODELING AND ESTIMATION IN AGILE SOFTWARE
DEVELOPMENT ENVIRONMENTS USING INFLUENCE
DIAGRAMS
Efi Papatheocharous, Despoina Trikomitou
Department of Computer Science, University of Cyprus
75 Kallipoleos Street, P.O. Box 20537, CY1678 Nicosia, Cyprus
Pantelis Stylianos Yiasemis, Andreas S. Andreou
Department of Electrical Engineering and Information Technologies, Cyprus University of Technology
31 Archbishop Kyprianos Street, 3036 Lemesos, Cyprus
Keywords: Agile software development, Productivity, Project management, Influence diagrams.
Abstract: Software development according to agile principles seeks to promote adaptive processes, teamwork and
collaboration throughout the life-cycle of a project. In contrast, traditional software development focuses on
the various phases and activities of the life-cycle while seeking for repeatable, predictable processes to
maximize productivity and quality. Additionally, project management in conventional development
processes aims to plan and predict the future, whereas in agile development environments, aims to adapt
according to any future change. In this paper we investigate, through modeling with Influence Diagrams, the
benefit of switching from traditional software development to agile in terms of productivity, expected value
and cost. Additionally, we examine how software costs might differentiate if traditional or agile
development methodologies are followed. We explore the factors that contribute in successful software
development and draw our main conclusions through hypothetical and real case scenarios recorded in agile
surveys on Information Technology practices. One of our main conclusions includes verification of the need
for a skillful manager and small development team to lead to successful agile projects.
1 INTRODUCTION
Software development constantly needs to evolve
and adapt to the changing needs of software
practitioners and users. Agile software development,
introduced in the ‘Agile Manifesto’ (Beck et al.,
2001), is a relatively new paradigm consisting of a
group of methodologies created to deliver value to
the customer. Even though it is hard to quantitatively
assess the value delivered to the customer, it has a
profound effect on the quality of the product
delivered to the customer and the productivity of
software developers. The added value from inserting
flexibility and adaptability in the processes followed
during software development is clearly reported in
one of the early surveys in agile methodologies
(Johnson, 2003). In general, companies using agile
processes report lower or unchanged cost and better
productivity, quality and business satisfaction. Value
is considerately more useful to the customers as the
streamlined development, in highly efficient ways,
reduces time and delivers products that satisfy the
real customer needs and achieve competitiveness in
the market.
Many companies find the benefits of agile
software development reason enough to incorporate
agility in their environment and respond to the
continuously changing requirements and emerging
new technologies. In fact, the flexibility and
adaptability of agile methods makes them so
attractive to software developers and project
managers, as a lot of the development burden that
usually comes along with traditional methods (e.g.,
documentation) is stripped away, allowing for
quicker reaction to changes in user requirements,
volatile organizational or technological conditions
117
Papatheocharous E., Trikomitou D., Stylianos Yiasemis P. and S. Andreou A..
COST MODELING AND ESTIMATION IN AGILE SOFTWARE DEVELOPMENT ENVIRONMENTS USING INFLUENCE DIAGRAMS.
DOI: 10.5220/0003553901170127
In Proceedings of the 13th International Conference on Enterprise Information Systems (ICEIS-2011), pages 117-127
ISBN: 978-989-8425-55-3
Copyright
c
2011 SCITEPRESS (Science and Technology Publications, Lda.)

etc. Therefore, agility helps in meeting the
customer’s requirements with minimal costs.
In theory changing the requirements after
development has already been initiated is something
that should never happen. In practice, this occurs
almost always and is something that cannot be
avoided as customers usually cannot communicate
correctly their requirements to the developers,
technology constantly evolves causing changes to
the system, legislation and other internal or external
project factors that will eventually affect
requirements regularly, and so on.
The main difference of agile methods from
traditional is that they focus on individuals and
interactions over processes and tools, working
software code over documentation, customer
collaboration over contract negotiation and respond
to change of requirements over pursuing a plan
(Beck et al., 2001). Traditional process models
follow a strict structure and an unpliable plan in
which changes after the phase of gathering
requirements have a huge impact on schedule and
cost, while in agile processes, there is no reluctance
in changes and going beyond cost to deliver better
software.
Therefore, one of the most interesting and
challenging problems to analyze in software
development, either following a traditional or an
agile mode, is estimating the final cost of generating
a software product. Software cost is assessed in
person-months, according to the effort required for
the development of a product. In traditional methods
cost estimation and effort planning is done from the
beginning of a project, as these methods follow
specific sequential or iterative steps. In agile
methods, planning may exceed the original
assessments, due to their incremental and flexible
nature and thus effort estimation is even harder and
unpredictable.
Moreover, academic research on the
identification of the factors affecting agile software
development methods is scarce and the most
influential publications are usually written by
business consultants and practitioners in the industry
of software development (Abrahamson et al., 2002).
Until today several researchers have only used
empirical methods to compare agile and traditional
methods (Glass, 2001, Black et al, 2009, Tuner and
Boehm, 2003). These comparisons are practically
based on case studies that examined various
companies that used traditional or agile software
development methodologies. Boehm (2002)
comments about agile and traditional methods:
“Each approach has a home ground of project
characteristics within which it performs very well,
and much better than the other.”. Other researchers
investigated if the practices recommended within the
agile methods can be applied successfully in real life
scenarios and are not just theoretical methods
(Schallio, 2001, Mann and Maurer, 2005, Chong,
2005).
One of the basic investigations of this paper
concerns deciding which development method is
better to follow in particular software development
cases, based on project characteristics. We
investigate the most qualitative real project cases
applying agile software development obtained from
the survey of Dybå and Dingsøyr (2008) in order to
comprehend the characteristics of agile development
processes, teams and organizations.
The survey of Dybå and Dingsøyr (2008)
includes an overview of topics researched, findings,
strength of the findings, and implications for
research and practice in the area of agile software
development. Particularly, the survey included 1996
studies found in the relative literature up to the year
2005 that reported empirical agile software
development data. From those studies only 36 were
chosen for further analysis. The selection of these
studies was based on a protocol, developed by the
authors, offering a systematic review and a set of
criteria for assessing them. From the remaining
studies we collected the different experiences and
statements of the interviewees, information which
was considered particularly useful for this work.
Also, information from publicly available
questionnaires (Ambysoft surveys) was used.
The main research questions that we attempt to
answer in this work are the following:
RQ1: Follow Agile or Traditional development
activities? – Depending on the situation within a
hypothetical organization regarding the team size
and expertise, skills, physical environment, etc.,
which development methodology should the
organization adopt?
RQ2: Will the cost increase if we follow the agile
paradigm or not? – Examining the critical issue of
software cost estimation in agile and traditional
software development, which cost factors should be
taken into consideration? Depending on the different
values of these factors in hypothetical scenarios,
what would be the change in development cost?
The questions raised in the two points above are
some of the most critical questions that software
industry practitioners and cost estimators are eager
to answer. They relate with adopting agile and
abandoning traditional plan-driven software
development methodologies, something which in
ICEIS 2011 - 13th International Conference on Enterprise Information Systems
118

effect will lead to a radical change in conventional
project management.
In this work, we created two different models
employing Influence Diagrams (ID) to answer the
above questions. ID are graphical representations for
modeling uncertain variables and decisions and
providing probabilistic dependencies in order to
evaluate decisions (Schacter, 1986)
For the first research question we created three
different variations of the same ID that differ in their
structure; a simple diagram, a deterministic diagram
and an advanced diagram. Three different scenarios
were chosen to run on these diagrams: a worst case
scenario, an ideal scenario and a real case scenario
drawn from the questionnaires.
For the second research question we created two
different ID to estimate the change of cost; firstly in
agile and secondly in traditional development
environments. Four different scenarios were
executed: a worst case scenario, an ideal scenario, an
ideal-team scenario and an ideal-manager scenario.
From the different scenarios executed some
indicative results were obtained regarding the
research questions posed. Moreover, the diagrams
created enable project managers to assess the
advantages of using the appropriate development
methodology (traditional or agile) depending on the
specific organization’s conditions. These conditions
regard the maturity level of the organization, the
personnel’s skills and expertise, the project
manager’s confidence, etc. Especially volatile
conditions, such as conditions related with the
technology and people, have a significant impact on
software cost and are used in the diagrams.
The significance of this work lies in the fact that
we attempt to model an environment that has never
been modeled before, i.e. the agile software
development. Especially the real case scenarios may
be considered highly important since they utilize
data that reflect real life circumstances drawn from
questionnaires (Ambysoft surveys). The questions
answered in this work are considered to be critical
for organizations considering switching from
traditional to agile development methods. Finally,
the selection of the modeling technique, i.e.,
Influence Diagrams (ID), was based on the benefits
they offer. They can successfully represent
mathematical dependencies between complex or
qualitative factors and provide intelligent models for
answering our research questions.
The rest of the paper is organized as follows:
Section 2 presents a brief background review of
agile methods and software cost estimation
literature. Section 3 makes a brief description of the
Influence Diagrams theory. Moreover, the diagrams
created to answer our research questions are
presented. Section 4 describes the scenarios
executed for our experiments and presents the results
obtained from the diagrams. Finally, Section 5
provides our conclusions, discusses a few limitations
that should be taken into consideration and outlines
our future research steps.
2 RELATED WORK
There are a number of different agile methods,
which are based on principles defined in the Agile
Manifesto (Beck et al., 2001). Examples of
methodologies include Extreme Programming,
Scrum, Crystal Methodologies, and Lean Software
Development. In this section we summarize related
work on case studies utilizing agile development
methods. The following studies assess the progress
between different releases of the same project, make
a direct comparison between traditional and agile
methods, or evaluate the human factors that may
have an effect on the development process.
Abrahamson (2003) studied Extreme
Programming (XP) and investigated whether the
practices suggested by this method can be applied
successfully to real life scenarios. A comparison of
the progress between two releases of the same
project was made. The results were really
encouraging as the comparison showed a lot of
progress in the amount of work and in the team’s
productivity between the two releases. Also, the
results showed that the degree of the customer’s
interaction was not as substantial as it should have
been.
XP methods suggest that the customer should be
close to the developers at all times so as to
contribute significantly to the project’s progress.
Koskela and Abrahamsson (2004), examined if the
customer’s presence is vital to the project and in
effect how it would influence the development
team’s progress. The main observation was that the
customer’s contribution on a project with onsite
presence 100% of the development time, only 21%
of the work the customer delivered contributed to
the final project outcome.
The empirical survey (Dybå and Dingsøyr, 2008)
of case studies developing software using agile
methods employed a set of criteria to evaluate a
large range of studies and projects. Their findings
concerned the benefits and limitations of agile
development, which were used as a guide to mainly
compare the settings in the studies with the
COST MODELING AND ESTIMATION IN AGILE SOFTWARE DEVELOPMENT ENVIRONMENTS USING
INFLUENCE DIAGRAMS
119

hypothetical scenarios and cases investigated in this
study. Particularly, we are interested in investigating
software costs in agile environments.
Software cost estimation in general is the ability
to predict the cost of the software to be produced in
terms of person-months. This problem exists almost
from the start of software development. Essentially,
in every project the customer wants to know what
will the project cost for the company before taking
the decision of actually going on and developing it.
This can lead to either overestimating or
underestimating the real cost which in turn will be a
loss for the software development company.
Estimating software cost in agile projects is
really hard in practice, because of the repetitive
small cycles of development executed and the
unpredictable nature of agile methods. Agile
methods use a number of iterations until their
completion, where in each one of the iterations all or
some of the steps of a traditional method are
completed. While the cost of an iteration might be
relatively easy to estimate, the number of iterations
is unknown. Therefore, estimating the resources and
the total cost required for developing an agile project
is almost impossible especially at the beginning of
the project.
One way to estimate the cost in agile methods is
to calculate the development effort for each iteration
at the start of each iteration. The estimation can be
based on prior knowledge and expertise of
previously completed projects with iterations.
However, this method may provide estimation for an
iteration and not for the whole project. Nevertheless,
the estimation of an iteration may be used by project
managers to decide if the implementation of a part is
worth the cost. However, to the best of our
knowledge, little rigorous research attempts have
been made on how software stakeholders could
benefit in their cost estimation activities from
developing software using agile methodologies.
Moreover, the difficulty in cost estimation of
projects following the agile paradigm highly
increases because the people factor is considered to
be more crucial and important than process and
product factors. In order for a process to be
predictable it needs to have components that behave
in a predictable manner. As people factors are of
more importance to the development progress, due
to their unpredictable nature, software cannot be
easily quantified or measured for cost estimation.
Also, other factors that may affect cost estimation in
traditional methods, such as uncertainty, risk,
emerging requirements etc., are present in agile
methods as well, making even harder the estimation
of cost (Chandrasekaran et al., 2006).
To the best of our knowledge, few prior attempts
have been made in estimating software cost for agile
methods. Even though most projects rely on expert-
based estimations (Lippert et al., 2003, Elssamadisy
and Schalliol, 2002, Grossman et al., 2004) a study
by (Ceschi et al., 2005) claimed that none of the
companies reported had used COCOMO and that a
40% used Function Points estimation on their agile
projects. These results however are based only on 10
companies and do not represent generalizable
findings.
Conclusively, estimating software cost in agile
projects is a difficult task as a lot of the factors
affecting the cost cannot be foreseen with accuracy.
Since usually human factors are the ones that can
affect the estimation the most, in this work we
investigate several factors, like the mentality of a
person, the comprehension of the actual
requirements, the communication between customer
and developers etc., under specific scenarios. This
paper involves a modeling method to decide whether
to use traditional or agile development methods and
how this decision will ultimately affect cost.
3 EXPERIMENTAL METHOD
In this section we describe how Influence Diagrams
(ID) work and how they are used to explain a
decision to a particular problem, in our case to give
answers to the research questions we raised earlier.
3.1 Influence Diagrams
Influence Diagrams (ID) are decision diagrams used
for modeling a problem. They consist of nodes
which can interact with each other. A leaf node does
not influence a factor with the same intensity as
another leaf node. Influence diagrams use
probabilities to achieve the different influence that
each leaf has on a factor, i.e., the leaf node
Experience can take a ‘high’ or a ‘low’ value and
respectively the quantitative values of 0.8 and 0.2.
Additionally, the sum of probabilities shall always
be equal to 1.
ID consist of three types of elements: a decision
node (rectangular) which corresponds to a decision
to be made, a chance node (oval) which represents
the uncertainty value and a value node (octagon)
which executes all the possible combinations from
its parent nodes. A special type of a chance node is
the deterministic node (double oval) whose outcome
ICEIS 2011 - 13th International Conference on Enterprise Information Systems
120
is based on its leaf nodes. The elements of an ID are
linked through arcs.
The reason we selected ID in modeling the
scenarios for this work is because they offer
flexibility and can also represent many dependencies
between factors to obtain an informed decision. The
benefit of utilizing ID is that they may represent
highly complex problems in an understandable way
to humans. Another advantage of utilizing ID is that
they allow experts to interfere with the results of
models by changing the value nodes of the diagrams,
which are used in all the possible combinations with
their parent nodes. Therefore, experts can
incorporate their knowledge by testing specific
scenario-based values to define the model’s
outcome. After executing the probabilistic
combinations the ID provide answers to the specific
scenarios. For example, if the decision is whether to
take the car or walk today, we might consider factors
like the weather and the distance to our destination,
and the diagram might produce the value 0.800 to
take the car and the value 0.154 to walk. This means
that according to the specific scenario the result of
the ID advices you to take the car. In the following
section the diagrams built are described.
3.2 Experimental Diagrams
We constructed diagrams which consist of a
collection of the main factors that affect the
decisions regarding the research questions that we
seek answers for. We used the GeNIe toolbox
(Decision Systems Laboratory, University of
Pittsburgh, 1998) to create the Influence Diagrams
(ID) for the two models described and used in the
experimentation.
3.2.1 RQ1: Follow Agile or Traditional
Development Activities?
In order to answer RQ1, i.e., when should agile and
when should traditional activities be followed, each
of our scenarios was executed on three different
diagrams. These diagrams even though were used to
reply to the same question, had different structure
regarding the type of nodes and values. We denote
the first, second and third diagrams created as:
Simple, Deterministic and Advanced. The
Deterministic diagram differs from the Simple in that
all non-leaf nodes are defined as Deterministic
(expressed in double oval). Note that the diagram
shown in Figure 1 would have to mark all non-leaf
nodes as deterministic with double ovals in order to
express the Deterministic case. However, due to
space limitations and since the diagrams have no
other difference than that, the rest of the diagrams
are not provided. Moreover, the nodes in the Simple
diagram can take any value in the range [0,1], in the
Deterministic the non-leaf nodes values are binary,
i.e., True (1) or False (0), and in the Advanced
diagram the values can take linguistic values, such
as ‘low’, ‘medium’ or ‘high’.
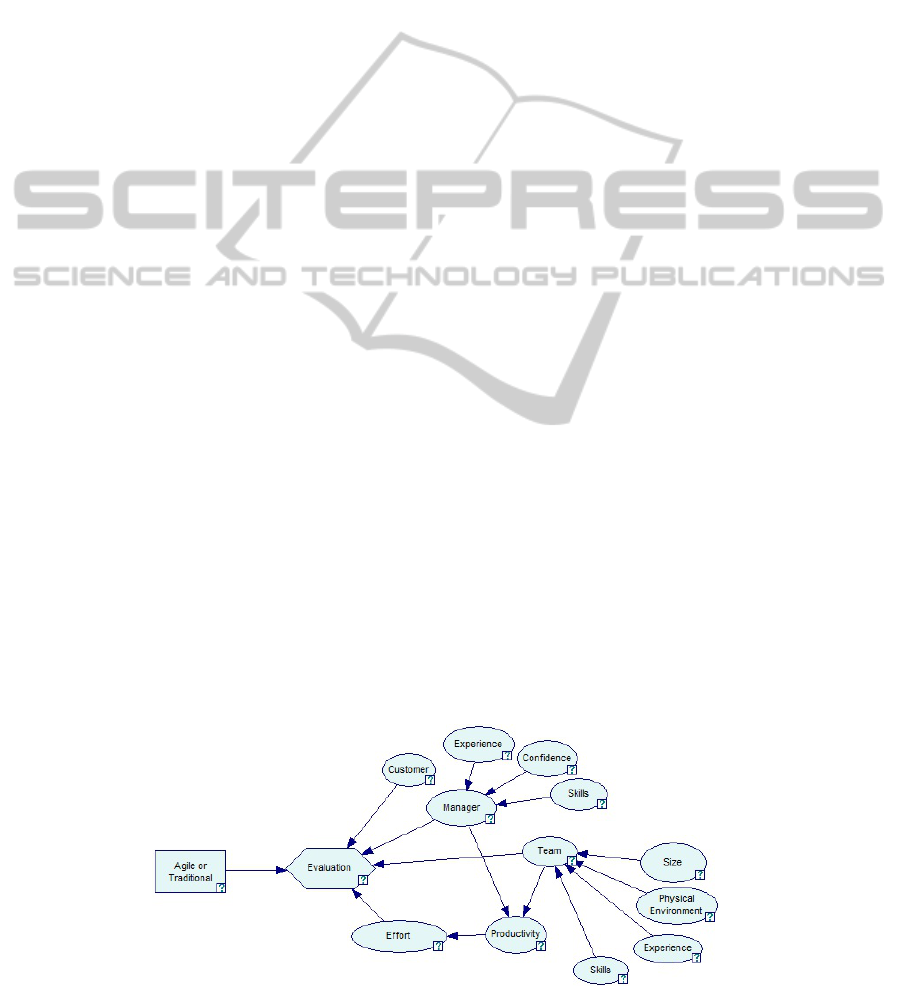
The Influence Diagram created to answer the
question whether a specific organization should use
agile or traditional development methods is shown in
Figure 1. The diagram includes three basic entities:
the Manager, Team and Customer of the project that
affect the values of two other nodes Productivity and
Effort. We selected these factors for answering the
question which development paradigm to follow
(Agile or Traditional) since from the review of case
studies of projects in the related literature, they were
usually reported as the most important factors
affecting productivity and project success. We
modeled the influence between leaf and non-leaf
nodes as follows: The value of the Manager node is
influenced by his respective Experience, Confidence
and Skills. The Evaluation node is used to execute
all the possible combinations of the value nodes to
offer a decision whether to adopt an agile or
traditional development method.
Figure 1: ‘Follow Agile or Traditional development activities?’ Influence Diagram.
COST MODELING AND ESTIMATION IN AGILE SOFTWARE DEVELOPMENT ENVIRONMENTS USING
INFLUENCE DIAGRAMS
121
A Manager is a person who guides the project
and the ability of that person to guide a project to
success is defined by the degrees of Experience in
using agile methodologies, of Confidence in the
success of agile and of Skills, meaning his
knowledge in the agile field. The node Team
consists of the type of people who take part in the
project and their ability to implement such a project
is defined by their Experience, Skills, Physical
Environment and Size (because the common practice
in order to have a successful agile project is the team
to be co-located and have a small size).
We propose that leaf nodes, such as Skills and
Confidence are subjective concepts and so numerical
constant values cannot be specified for them.
Therefore, we introduced for this type of nodes
linguistic terms like ‘True’ or ‘False’, and if for
example Skills can be defined from the range of
values [0,1], ‘True’ will cover the range of 0.5-1 and
‘False’ the range of 0-0.49.
The node Customer denotes the client’s degree
of participation in the development process. One of
the most unpredictable and important factors in
software development is the human factor, and
therefore the ability of both the Manager and Team
directly affect Productivity. The Productivity in turn,
influences the value of Effort. Finally, the
Evaluation node produces the result within the range
[-1, 1] which will reflect the answer to our decision
problem.
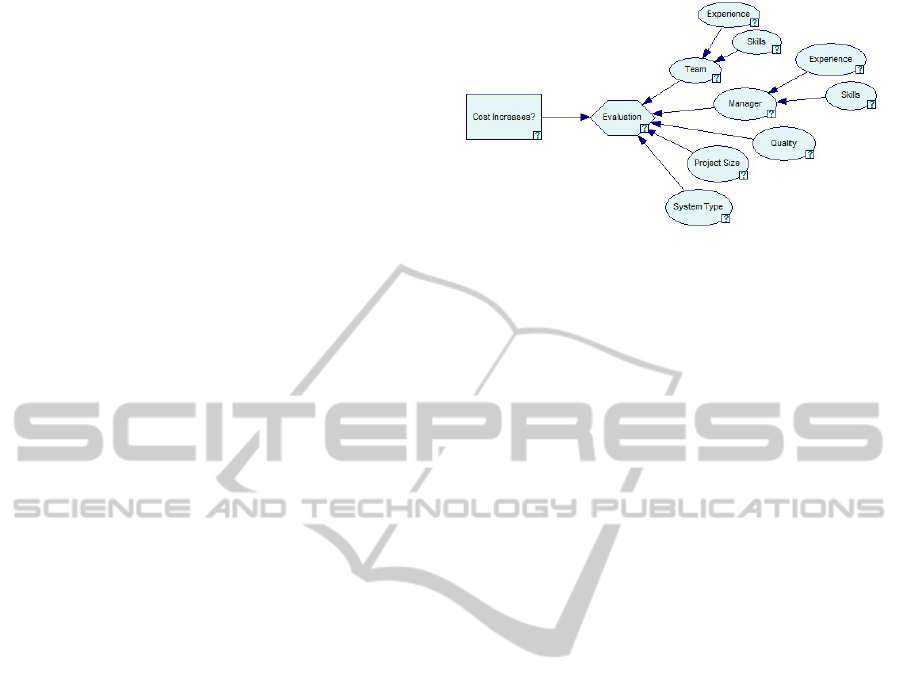
3.2.2 RQ2: Will the Cost Increase if We
Follow the Agile Paradigm or Not?
We developed two different diagrams to answer the
following questions respectively: (i) Will cost
increase in an agile development environment or
not? and (ii) Will cost increase in a traditional
development environment or not? The main idea is
that an organization is free to choose any of the two
aforementioned development methods. Before
deciding, though, specific scenarios on the two
diagrams need to be executed according to whether
the product will be developed or customized, what
type of team and project manager are going to work
on the project etc., and based on the results of these
scenarios the cost may be estimated for the two
developing options. Figure 2 shows the diagram
created for the agile cost estimation. The diagram
was modified to assess cost estimation for traditional
software development by just adding one more node,
i.e., the Documentation node.
Figure 2: Will the cost increase if we follow the agile
paradigm or not? Influence Diagram.
The factors used in the diagrams are the ones
considered to affect software cost with the highest
degree and were chosen after studying cost
estimation related literature (Sommerville, 2008).
The common factors between this diagram and the
previous one are the factors of Manager and Team.
However, the leaf nodes of these factors are
simplified as follows: the node Manager is no longer
defined by the leaf node Confidence and the node
Team is no longer affected by the leaf nodes
Physical Environment and Size. This is explained by
the fact that previously we defined Confidence as
how confident the manager is in the success of agile.
Therefore, the node Confidence is no longer required
in estimating the cost for the traditional case.
Furthermore we estimate cost in person-months so
the Size and Physical Environment will not affect
cost. However, we included in our diagrams product
characteristics which affect whether the cost will
increase or not.
We added the node Quality which defines the
quality of the new or customized product. We used
the node Project Size that defines the size of the
project (in terms of length or duration). Finally, we
added the node System Type which defines whether
we are dealing with a new product or an existing
one, i.e., will be customized. As mentioned before,
for the traditional diagram case we included also the
node Documentation that defines the type of the
documentation produced.
4 EXPERIMENTS AND RESULTS
In this section we present the scenarios executed and
the results obtained.
4.1 RQ1: Follow Agile or Traditional
Development Activities?
We executed three scenarios for deciding whether to
ICEIS 2011 - 13th International Conference on Enterprise Information Systems
122

follow an agile or a traditional development
paradigm using the diagram of Figure 1 and based
on specific conditions occurring within a
development organization. Our purpose was to
execute the three different scenarios and see the
resulting differences between the three variations:
the Simple, the Deterministic and the Advanced
diagrams.
4.1.1 Scenarios
Scenario 1 (Worst Case): In the first scenario we
suppose we have the case of a poor project manager
and a weak team. This means the project manager
has low experience in using agile methodologies,
negative confidence and low skills. The team is far-
located, has a large size (making communication
hard) and team members have low experience.
Scenario 2 (Ideal Case): In the second scenario we
have the case of an ideal project manager and team.
This means the project manager has high experience
in using agile methodologies, positive confidence
and high skills. The team is co-located, team size is
small and the team members have high experience.
Scenario 3 (Real Case): In the third scenario we
statistically analyzed data obtained from
questionnaires reporting Information Technology
practices (Ambysoft-Agile Adoption Rate Survey
Results-DDJ, February 2008). The analysis
performed on the sample data showed that project
managers using agile were highly experienced and
confident in the success of agile. Also, a small
percentage of the teams had a small size but were
highly experienced. Therefore, in this scenario we
consider the case of an experienced project manager
with confidence, a small team with high experience
and average skills.
In Table 1 we present the input values used in the
experiments based on the linguistic terms of the
factors for the Simple and Deterministic diagrams
and in Table 2 the same information for the
Advanced diagram is shown. The purpose of the
Advanced diagram is to assess the results using less
extreme values. The values reflect the previously
described scenarios where one can easily notice that
the elicitation of values leads to less
‘strict’/‘absolute’ scenarios. The columns S1, S2 and
S3 represent the various scenarios executed, i.e., the
Worst, the Ideal and the Real case respectively.
Table 1: Input values for Simple and Deterministic
diagrams in answering: RQ1 Follow Agile or Traditional
development activities?
Factor Term S1 S2 S3
Project Manager
Experience
True 0.2 0.8 0.885
False 0.8 0.2 0.115
Project Manager
Confidence
True 0.2 0.8 0.909
False 0.8 0.2 0.091
Project Manager
Skills
True 0.1 0.9 0.5
False 0.9 0.1 0.5
Team Physical
Environment
Co-Located 0.2 0.8 0.5
Far-Located 0.8 0.2 0.5
Team Size
Small 0.1 0.8 0.612
Medium 0.1 0.1 0.313
Large 0.8 0.1 0.075
Team Experience
Low 0.6 0.4 0.222
High 0.4 0.6 0.778
Team Skills
Low 0.8 0.2 0.537
High 0.2 0.8 0.463
Customer
On-Site 0 1 1
Away 1 0 0
Table 2: Input values for Advanced diagram in answering:
RQ1 Follow Agile or Traditional development activities?
Factor Term S1 S2 S3
Project Manager
Experience
Low 0.7 0.2 0.115
Medium 0.1 0.1 0.846
High 0.2 0.7 0.039
Project Manager
Confidence
Negative 0.7 0.1 0.091
Neutral 0.2 0.2 0.159
Positive 0.1 0.7 0.75
Project Manager
Skills
Low 0.7 0.1 0.33
Medium 0.2 0.2 0.33
High 0.1 0.7 0.34
Team Physical
Environment
Co-Located 0.2 0.8 0.5
Far-Located 0.8 0.2 0.5
Team Size
Small 0.1 0.7 0.612
Medium 0.2 0.2 0.313
Large 0.7 0.1 0.075
Team Experience
Low 0.1 0.7 0.222
Medium 0.2 0.2 0.654
High 0.7 0.1 0.125
Team - Skills
Low 0.7 0.1 0.537
Medium 0.2 0.2 0.336
High 0.1 0.7 0.127
Customer
On-Site 1 1 1
Away 0 0 0
4.1.2 Results
Executing the Worst case scenario on the Simple
diagram the decision was 0.072 for the agile
methods and 0.377 for the traditional ones. The
Deterministic diagram produced the value -0.441 for
agile and 0.626 for traditional. Lastly, the Advanced
diagram gave the value -0.231 for the agile and
0.454 for traditional. Therefore, in the Worst case
scenario all three diagrams agreed that traditional
methods should be followed over agile.
COST MODELING AND ESTIMATION IN AGILE SOFTWARE DEVELOPMENT ENVIRONMENTS USING
INFLUENCE DIAGRAMS
123

Executing the Ideal case scenario the Simple
diagram yielded the value 0.742 for agile and 0.625
for traditional. The Deterministic diagram gave the
value of 0.747 for agile and -0.389 for traditional.
Finally, the Advanced diagram produced the value of
0.740 for agile and -0.359 for traditional. Therefore,
all three diagrams indicated that in the Ideal case
scenario we should use agile. The result was
expected, as the Worst and Ideal cases are exact
opposite situations and consequently the results
matched those of the Worst case scenario in
mirrored values. The above results confirmed that in
all the cases the diagrams created yield correct
(certain) and reasonable results.
Executing the Real case scenario with values
drawn from questionnaires the Simple diagram
yielded the value 0.620 for agile and 0.429 for
traditional. The Deterministic diagram provided the
value 0.542 for agile and -0.082 for traditional.
Finally, the Advanced diagram provided the value
0.384 for agile and the value 0.007 for traditional.
Therefore, in the Real case scenario all diagrams
confirm that agile methods overcome traditional.
The experimental results obtained from the three
diagrams Simple, Deterministic and Advanced for
the scenarios executed always agree over the answer
to the decision of when to use agile or traditional
development activities. However, the results of the
Deterministic diagram indicate that the use of the
deterministic nodes in the latter diagram yields
stricter (clearer) results compared to the Simple
diagram. Therefore, we can infer that the reasoning
of the Deterministic diagram is stricter (firmer) in
the decisions obtained. The Advanced diagram also
offers a clearer decision for all the scenarios
executed in comparison to the Simple diagram, but
less strict decisions compared to the Deterministic
diagram, except in the Ideal case where the
difference between the decision values is very small.
4.2 RQ2: Will the Cost Increase if We
Follow the Agile Paradigm or Not?
We executed four scenarios on two cost estimation
diagrams i.e., the agile shown in Figure 2 and the
traditional software cost estimation, based on
specific conditions occurring within the developing
organization and the needs of the project. The main
objective is to observe the results and the decision
evaluations yielded by the diagrams. The first two
scenarios are executed to confirm the validity of the
results. Moreover, the last two scenarios are based
on hypothetical circumstances which may occur
within an organization.
4.2.1 Scenarios
Scenario 1 (Ideal Case): In the first scenario we
suppose that we have a strong team and a strong
project manager, in terms of experience and skills.
The software quality is high, the project size is
small, the system type is customization and the
amount of documentation is low.
Scenario 2 (Worst Case): In the second scenario we
have a weak team and a weak project manager, in
terms of experience and skills. The software quality
is low, the project size is large, the system type is
new software and the amount of documentation is
high.
Scenario 3 (Ideal-Manager Case): In the third
scenario we investigate the dynamics between
manager-team. We suppose that we have a weak
team but a strong project manager (again, in terms of
experience and skills). The software quality is high,
the project size is large, the system type is
customization and documentation is average.
Scenario 4 (Ideal-Team Case): In the final scenario
we invert the dynamics between manager-team and
keep the rest of the values unchanged. Thus, we
suppose to have a strong team but a weak project
manager and the same conditions as in Scenario 3.
Table 3 summarizes the values used for the factors
of the two diagrams, the agile and traditional.
Columns S1-S4 correspond to the scenarios
described above.
Table 3: Input values for answering: RQ2 Will the cost
increase if we follow the agile paradigm or not?
Factor Term S1 S2 S3 S4
Team Experience
Low 0.2 0.8 0.8 0.2
High 0.8 0.2 0.2 0.8
Team Skills
Low 0.2 0.8 0.8 0.2
High 0.8 0.2 0.2 0.8
Project Manager
Experience
Low 0.2 0.8 0.2 0.8
High 0.8 0.2 0.8 0.2
Project Manager
Skills
Low 0.2 0.8 0.1 0.9
High 0.8 0.2 0.9 0.1
Quality
Low 0.2 0.8 0.2 0.2
High 0.8 0.2 0.8 0.8
Project Size
Small 0.8 0.2 0.2 0.2
Large 0.2 0.8 0.8 0.8
System Type
New 0.1 0.9 0.2 0.2
Customized 0.9 0.1 0.8 0.8
Documentation
Low 0.7 0.3 0.5 0.5
High 0.3 0.7 0.5 0.5
4.2.2 Results
Executing the Ideal case scenario, the Agile diagram
showed that cost will not increase with a value of
ICEIS 2011 - 13th International Conference on Enterprise Information Systems
124

0.718 while cost will increase with a value of -0.585.
In the Traditional diagram the Ideal case showed
that cost will not increase with a value of 0.543 and
will increase with a value of -0.245. Therefore, the
diagrams showed that in the Ideal case cost will
probably not increase in the agile nor in the
traditional case, for the former having a stronger
confidence.
Executing the Worst case scenario the Agile
diagram produced the value of -0.430 for no cost
increase and the value 0.692 for cost increase. The
Traditional diagram resulted to a value of -0.297
that cost will not increase and a value of 0.683 that
cost will increase. As expected, in a worst case
scenario software cost is expected to increase no
matter which methods or activities are selected to
follow, agile or traditional.
The next two scenarios executed had the same
conditions except the diversified experiences and
skills of the team and the project manager.
Executing the Ideal-Manager the Agile diagram
showed that with a value 0.005 cost will not increase
and cost will increase with the value of 0.249. On
the contrary, the Traditional diagram showed that
cost will not increase with a value of 0.296 and will
increase with 0.117. It is obvious that having a weak
team, even with a strong project manager, in agile
methods software cost is more probable to increase,
whereas in traditional development the existence of
a strong project manager counterweights the
situation, and most probably cost will not increase.
However, the decision in traditional with a strong
manager versus a weak team is not ‘distinct’ (clear)
because the values produced are close.
Executing the Ideal-Team case scenario where a
strong team supports the activities but the project
manager is weak, in terms of experience and skills,
the diagrams again support a different decision. The
Agile diagram yields that the cost will not increase
with a value of 0.294 and it will increase with the
value of 0.033. The Traditional diagram resulted
that the cost will not increase with the value of 0.066
and it will increase with the value of 0.400. The
experimental results showed that agile methods with
an ideal team will probably not lead to a cost
increase (even though the project manager is
‘incompetent’). On the contrary, even though there
is a strong development team in the traditional
environment, due to the weakness of the manager,
cost will most probably increase.
Overall, the first two diagrams prove that in the
Ideal and Worst cases the diagrams investigateing
software cost increase produce reasonable (and
expected) results, i.e., cost will not increase in the
former but it will increase in the latter case. The
final two diagrams provide an important conclusion
regarding the effect of project success and cost
based on the quality of the project team and
manager. The diagrams confirm the agile theory that
specifies that the success of a project lies especially
on the skills, expertise and experience of the team
members. However, the manager’s skills are less
influential in agile environments. In addition, the
effect the team and manager have on agile vs.
traditional environments appears to be exact
opposite. Therefore, in traditional methods an ideal
team will still lead to cost increase if the manager’s
skills and experience are poor. Whereas, in
traditional methods having an ideal manager even
with a poor team will probably not lead to cost
increase.
5 CONCLUSIONS
Agile methods consist of a set of practices that aim
to tackle the unpredictable nature of the world and
the constant change of the project’s requirements.
Traditional methods on the other hand, tend to
advocate extensive planning, a lot of reuse and
processes codification in order to make the whole
development process shorter, less costly and
predictable. Due to this detailed planning occurring
at the start of a project, any later changes tend to be
really costly and take a substantial amount of time to
implement.
This paper focuses on the differences between
Agile and Traditional methods and tries to give a
solution to organizations that wonder whether they
should use agile or not to develop a project and what
impact this decision will have on cost. Thus, we
focused on the main factors that contribute to make
an agile project successful. We based this research
on studying initially a set of related case studies of
agile software developments, surveys and
questionnaires. The latter answered two research
questions: (i) Under which certain circumstances
should an organization follow agile or traditional
development methods? and (ii) How will this
decision affect the software cost of a project?
We built Influence Diagrams (ID) to model our
two research questions and we executed various
scenarios. Our purpose was to assess the results of
the scenarios so as to verify that the diagrams
provide safe guidance to answering our questions.
The results obtained were very encouraging as they
showed that the diagrams worked reasonably well,
fully adopting the agile paradigm. In cases where the
COST MODELING AND ESTIMATION IN AGILE SOFTWARE DEVELOPMENT ENVIRONMENTS USING
INFLUENCE DIAGRAMS
125

organization’s conditions did not favor agile, all
diagrams consent to following a traditional method
as the use of agile would have an increase in cost
and should be avoided.
One of the biggest problems recognized in agile
software development is that high complexity
projects with large teams may not work well when
using agile methods. This is due to the fact that these
methods support that the team members should be
co-located. However, it is hard to have a large
number of people in one place and at the same time
communicate effectively. Also, having high
complexity projects with a low degree of
documentation can lead to confusion, as the project
contains a lot of complex functions for
implementation. Another key factor that may
constitute a problem is the customer. It is difficult to
have the customer on site through all the developing
process, and even if the client can be close to the
process at all times, then he has to have knowledge
and experience in order to actually help and not
delay the developing team.
A limitation of this work is that very few real
cases were assessed with the models proposed and
more cases should be included in future analyses.
Also, a lot of experience is needed to build correct
models and evaluating all nodes requires a lot of
time. However, the results of this work support that
the diagrams may be used to base logical
conclusions that someone can trust and use in
practice.
For future work we suggest, an automation of the
data input method, as in the tool used it is highly
time consuming and requires a lot of effort.
Evolutionary computing techniques like Genetic
Algorithms can be used in order to achieve this
automation so the whole input process becomes
faster and more practical. The algorithms might also
help in calibrating the scenarios tested. Experts will
also be required to build the models, but the rest of
the process can be supported by more advanced
intelligent/automatic mechanisms.
REFERENCES
Abrahamsson, P., 2003. Extreme Programming: First
Results from a Controlled Case Study. In Proceedings
of the 29th EUROMICRO Conference “New Waves in
System Architecture”.
Abrahamsson, P., Salo, O., Ronkainen, J. and Warsta, J,
2002. Agile Software Development methods: Review
and Analysis. In VTT Technical report.
Ambysoft surveys http://www.ambysoft.com/ - Agile
Project Success Rates - Ambysoft, April 2010.
Beck, K., Grenning, J., Martin, C. R., Beedle, M.,
Highsmith, J., Mellor, S., Bennekum, van A., Hunt,
A., Schwaber, K., Cockburn, A., Jeffries, R.,
Sutherland, J., Cunningham, W., Kern, J., Thomas, D.,
Fowler, M. and Marick, B., 2001. Manifesto for Agile
Software Development. http://agilemanifesto.org/
Agile Alliance. http://agilemanifesto.org/.
Black, S., Boca, P. P., Bowen, P. J., Gorman, J. and
Hinchey, M., 2009. Formal Versus Agile: Survival of
the Fittest?. In IEEE Computer, Vol. 42, No. 9, pp.
37-45.
Boehm, B., 2002. Get Ready for Agile Methods, with
care. Computer, Jan. 2002 , pp. 64-69.
Ceschi, M., Sillitti, A., Succi, G. and De Panfilis, S., 2005.
Project Management in Plan-Based and Agile
Companies. IEEE Software, Vol. 22, pp. 21-25.
Chandrasekaran, S, Lavanya R. and Kanchana V., 2006
Multi-criteria approach for agile software cost
estimation model, International conference Global
Manufacturing & Innovation (GMI2006), Coimbatore,
India.
Chong, J., 2005. Social behaviours on XP and non-XP
teams: a comparative study. In Proceedings of the
Agile Development Conference.
Dybå, T. and Dingsøyr, T., 2008. Empirical studies of
agile software development: A systematic review. In
Information and Software Technology, Vol. 50, pp.
833-859. ElsevierLSEVIER.
Elssamadisy, A. and Schalliol, G., 2002. Recognizing and
Responding to "Bad Smells" in Extreme
Programming. In Proceedings of the 24th
International Conference on Software Engineering.
Glass, L. R., 2001. Agile Versus Traditional: Make Love,
Not War! In Cutter IT Journal, Vol. 14, No. 12, pp.
12-18.
Graphical Network Interface (GeNIE) 1998, Decision
Systems Laboratory, University of Pittsburgh,
aAccessed 10 October 10, 22010,
<http://genie.sis.pitt.edu/>.
Grossman, F., Bergin, J., Leip, D., Merritt, S. M. and
Gotel, O., 2004. One XP Experience: Introducing
Agile (XP) Software Development into a Culture that
is Willing but not Ready. In Proceedings of the 2004
Conference of the Centre for Advanced Studies on
Collaborative Research.
Ilieva, S., Ivanov, P. and Stefanova, E., 2004. Analyses of
an agile methodology implementation. In Proceedings
30th Euromicro Conference. IEEE Computer Society
Press.Johnson, M. 2003. Agile methodologies: Survey
results, Victoria, Australia: Shine Technologies.
Koskela, J. and, Abrahamsson, P., 2004. On-Site
Customer in an XP Project: Empirical Results from a
Case Study. In EuroSPI.
Lippert, M., Becker-Pechau, P., Breitling, H., Koch, J.,
Kornstädt, A., Roock, S., Schmolitzky, A., Wolf, H.
and Zülligjoven, H., 2003. Developing Complex
Projects using XP with Extensions. Computer, vol. 36,
pp. 67-73.
Mann, C. and Mauer F., 2005. A case study on the Impact
of Scrum on Overtime and Customer Satisfaction. In
ICEIS 2011 - 13th International Conference on Enterprise Information Systems
126

Agile Development Conference.
Schalliol, G., 2003. Challenges for Analysts on a Large
XP Project. In Marchesi, et al., (eds.) Extreme
Programming Perspectives, pp. 235-241 Pearson
Education.
Shachter, Ross D., 1986 Evaluating Influence Diagrams.
Operations Research 34, No. 6, pp. 871-882.
Sommerville, I., 2007. Software Engineering, Addison-
Wesley Publishers Limited. United States of America,
8th edition.
Turner, R. and Boehm, B., 2003. People Factors in
Software Management: Lessons From Comparing
Agile and Plan-Driven Methods. In CrossTalk The
Journal of Defence Software Engineering, Dec. 2003,
pp. 4-8.
COST MODELING AND ESTIMATION IN AGILE SOFTWARE DEVELOPMENT ENVIRONMENTS USING
INFLUENCE DIAGRAMS
127
