
FAILURE PREDICTION USING THE COX PROPORTIONAL
HAZARD MODEL
Pekka Abrahamsson, Ilenia Fronza and Jelena Vlasenko
Free University of Bolzano-Bozen, Piazza Domenicani, Domenikanerplatz 3, I-39100 Bolzano-Bozen, Italy
Keywords: Failure prediction, Cox PH model, Log files.
Abstract: Crashes of software systems may have disruptive, and sometimes tragic effects on users. Being able to
forecast such failures is extremely important, even when the failures are inevitable – at least recovery or
rescue actions can be taken. In this paper we present a technique to predict the failure of running software
systems. We propose to use log messages to predict failures running devices that read log files of running
application and warns about the likely failure of the system; the prediction is based on the Cox Proportional
Hazards (PH) model that has been applied successfully in various fields of research. We perform an initial
validation of the proposed approach on real-world data.
1 INTRODUCTION
Crashes of software systems may have disruptive,
and sometimes tragic effects on users. Being able to
forecast such failures is extremely important, even
when the failures are inevitable – at least recovery or
rescue actions can be taken. We propose in this
paper a method to predict the failure of running
software systems. Often, when developing a
software system, developers write log messages to
track its actual execution path, to debug it, or to
optimize its execution. Our idea proposes to use
such messages to predict the future failures. The
actualization of such idea will set the path for the
development of devices that read logs of running
applications and signal the likely crash of such
systems.
Methods for the prediction of a failure of systems
based on events (in our cases, the log messages)
have been proposed in various engineering
disciplines. These methods can be classified into
design-based methods and data-driven rule-based
methods. In a design-based method, the expected
event sequence is obtained from the system design
and is compared with the observed event sequence
(Sampath et al., 1994; Srinivasan and Jafari, 1993;
Pandalai and Holloway, 2000). The major
disadvantage of these methods is that in many cases,
events occur randomly and thus there is no system
logic design information available. Data-driven rule
based methods do not require system logic design
information. These methods are made of two phases:
1) identification of temporal patterns, i.e., sequences
of events that frequently occur (Mannila et al.,
1997), and 2) development of prediction rules based
on these patterns (Li et al., 2007).
In this work we propose to use the Cox PH
model. The Cox model has been applied mainly in
biomedicine, often for the study of cancer survival
(Bøvelstad et al., 2007; Hao et al., 2009; Yanaihara
et al., 2006; Yu et al., 2008). It has also been applied
successfully in various fields of research, such as
criminology (Benda, 2005; Schmidt and Witte,
1989), sociology (Agerbo, 2007; Sherkat and
Ellison, 2007), marketing (Barros and Machado,
2010; Chen et al., 2009). There are limited uses of
the Cox PH model in cybernetic (Li et al., 2007) and
also an application to software data (Wendel et al.,
2008) where, using as input code metrics, failure
time data coming from bug report were analysed.
The paper is structured as follows: In Section 2,
we present the Cox PH model; in Section 3, we
introduce our approach and we discuss a sample
application of it. In Section 4, we discuss our results.
2 THE COX PROPORTIONAL
HAZARD MODEL
Cox PH model (Cox, 1972) gives an expression for
201
Abrahamsson P., Fronza I. and Vlasenko J..
FAILURE PREDICTION USING THE COX PROPORTIONAL HAZARD MODEL.
DOI: 10.5220/0003557802010206
In Proceedings of the 6th International Conference on Software and Database Technologies (ICSOFT-2011), pages 201-206
ISBN: 978-989-8425-77-5
Copyright
c
2011 SCITEPRESS (Science and Technology Publications, Lda.)
the hazard at time t for an individual i with a given
specification of p covariates x:
(1)
The Cox model formula says that the hazard at
time t is the product of two quantities. The first of
them, h
0
(t), is called the baseline hazard function
and is equal for all individuals; it may be considered
as a starting version of the hazard function, prior to
considering any of the x´s. Cox PH model focuses
on estimating regression coefficients ß´s leaving the
baseline hazard unspecified. ß is a vector of
regression coefficients; in the p < n setting, ß´s are
estimated by maximizing the log partial likelihood,
which is given by:
(2)
Where R(t
i
) is the risk set at time t
i
, i.e. the set of
all individuals who are still under study just prior to
time t
i
.
A parametric survival model is one in which
survival time (the outcome) is assumed to follow a
known distribution. The Cox PH model is not a fully
parametric model; rather it is a semi-parametric
model because even if the regression parameters ß´s
are known, the distribution of the outcome remains
unknown. The Cox PH model is a “robust” model,
since the results obtained from it closely
approximate the results of the correct parametric
model.
The key assumption of the Cox PH model is
proportional hazards; this assumption means that the
hazard ratio (defined as the hazard for one individual
over the hazard for a different individual) is constant
over time.
Cox PH model is widely used because of its
characteristics: 1) even without specifying h
0
(t), it is
possible to find the ß´s, 2) no particular form of
probability distribution is assumed for survival
times, and 3) it uses more information – the survival
times – than the logistic model, which considers a
(0,1) outcome and ignores survival times and
censoring. Therefore it is preferred over the logistic
model when survival time is available and there is
censoring (Kalbfleisch and Prentice, 2002).
3 THE PROPOSED APPROACH
The approach proposed in this work is a technique to
predict the failure of a running software systems
using log files. The idea is to develop devices that
read logs of running applications and signal the
likely crash of such systems. In this Section, we
describe the structure of the approach and of the
monitoring process, and we show the results of the
sample applications.
3.1 Structure of the Approach
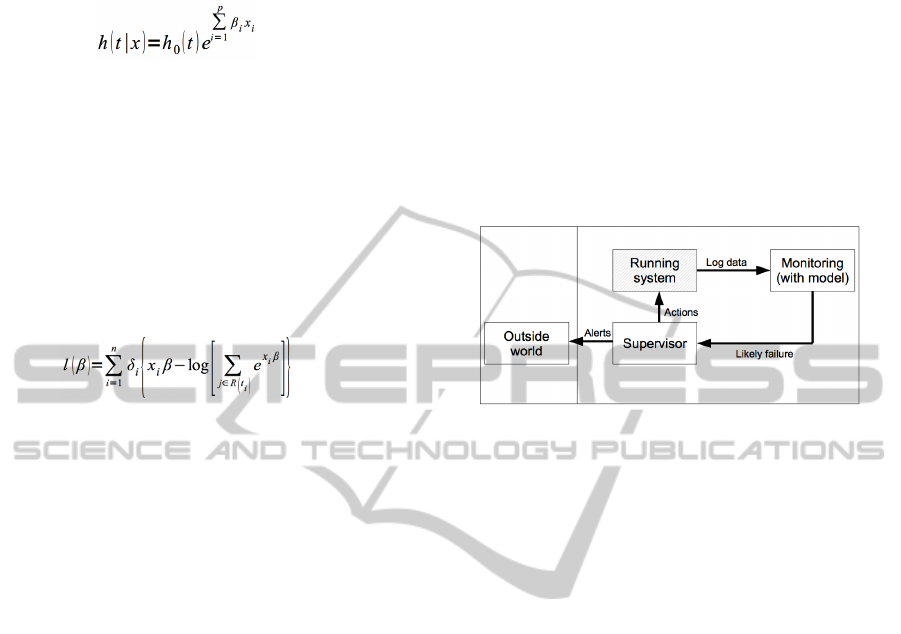
Figure 1 presents a schematic view of the proposed
approach.
Figure 1: Schema of the devices that read log files of a
running system and signal the likely failure.
While the system is running, log data are
collected to track the actual execution path (Coman
and Sillitti, 2007; Coman et al., 2009; Moser et al.,
2006; Scotto et al., 2004; Scotto et al., 2006; Sillitti
et al., 2003; Sillitti et al., 2004). In this work, we
look at the running system as a “black box”,
meaning that we do not have any other information
about the system except the log files.
The monitoring process takes log data as input,
basing on the analysis performed, gives to the
supervisor a message indicating the “likely failure”
for the running application.
The supervisor can act directly on the running
system to avoid the predicted failure, or send an alert
to the outside world. Possible actions could be to
abort the running system, to restart it, to dynamically
load components, or to inform the running system if
it was a suitably structured autonomic system
(Müller et al., 2009). Thus waste of time may be
reduced (Sillitti and Succi, 2005).
3.2 Structure of the Monitoring
Process
The monitoring process is based on the Cox PH
model; we chose this model because in our type of
data:
Ó Survival time is available;
Ó Censoring is present.
An advantage of Cox PH model is that no
assumption of a parametric distribution for the event
ICSOFT 2011 - 6th International Conference on Software and Data Technologies
202

sequence data is needed, which could result in the
discovery of information that may be hidden by the
assumption of a specific distribution (Yu et al.,
2008); results comparable to the parametric model
are obtained even without this assumption
(Kalbfleisch and Prentice, 2002).
3.2.1 Dimensional Reduction
of the Problem and Data Preparation
As first, the monitoring process performs an
automatic pre-processing phase (Zheng et al., 2009)
to get temporal event sequences from raw logs of the
application. This system works as follows:
1. data are parsed to extract operations together
with their associated time stamps and severities
for each event in the log file;
2. duplicate rows are deleted together with logs
that are missing information in one or several of
the fields Operation, Time stamp, Severity;
3. sequences of activities are extracted: a new
sequence starts either if there is a ‘Log in’
operation or if the day changes.
Failures are defined as sequences containing at
least one severity “Error”.
Table 1 summarizes the definitions used in this
work.
Table 1: Definitions used in this work.
Notion Definition
Environment Application
Sequence
A chronologically ordered set of log
entries in the maximum time frame of 1
day. Two sequences are separated by a
“Log in” operation
Failure
A sequence containing at least one
severity “Error”
Afterwards, the monitoring process prepares the
input for the Cox PH model (Table 2). Each
sequence i is described by (xi, ti, di), where: 1) xi =
(xi1, ..., xip) and xij is the multiplicity of operation j
in sequence i, 2) ti is the lifetime of the sequence,
defined as the difference between the last time stamp
and the first time stamp of sequence i, and 3) di = 1
when the event is “observed” (failure sequences) and
di = 0 elsewhere (censored observations). Our type
of censoring is type II with a percentage of 100%
(Lee and Wang, 2003), meaning that di is never
equal to zero because of the end of the observation
period.
3.2.2 Training of the Model and Analysis of
the Results
Following the guidelines of (Hao et al., 2009;
Yanaihara et al., 2006; Yu et al., 2008), the training
includes the following steps:
1. The Schoenfeld test (Hosmer et al., 2008;
Kalbfleisch and Prentice, 2002; Kleinbaum
and Klein, 2005) is applied to select the
operations satisfying the PH assumption.
2. The Cox PH model is applied and operations
that are significantly associated to failures are
identified.
3. For each sequence a risk score is evaluated
according to the exponential value of a linear
combination of the multiplicity of the
operation, weighted by the regression
coefficients derived from the aforementioned
Cox PH model.
4. The following values are extracted: 1) m, the
third quartile of risk scores of non failure
sequences, and 2) M, maximum risk score of
non failure sequences.
5. The risk score RS is then evaluated for the
actual sequence of the running application, as
in point 4. One of the following messages is
given as output to the supervisor about the
running application:
i. “likely no failure” if RS ≤ m,
ii. “likely failure” if RS ≥ M, and
iii. “still unknown” if m < RS < M.
3.3 Sample Application
To assess the suitability of our approach, we have
tested it with real-world data. We use log files
collected during approximately 3 months of work in
an important Italian company that prefers to remain
anonymous.
The dataset was prepared using the pre-
processing phase of the monitoring process
presented in Section 3.2.
Sequences were randomly assigned to training
set (60%) or test set (40%).
Table 3 contains the summary of the results of
pre-processing the training set.
Table 2: Training set pre-processing summary.
Type of event n %
Cases available in
the analysis
Failures* 28 12.8
Censored 157 72.0
Total 185 84.9
Cases dropped Censored before
the earlier event
in stratum
33 15.1
total 218 100
* Dependent variable: survival time
FAILURE PREDICTION USING THE COX PROPORTIONAL HAZARD MODEL
203
Six out of the eight initial operations were
satisfying the proportional hazards assumption and
were therefore kept in the input dataset for the Cox
PH model. Table 4 contains the output of this model.
Table 3: Output of the Cox PH model on training set.
β sig exp(β)
Operation 1 -0.40 0.013 0.961
Operation 2 0.06 0.015 1.006
Operation 3 -0.52 0.050 0.592
-2 Log Likelihood: 200.112
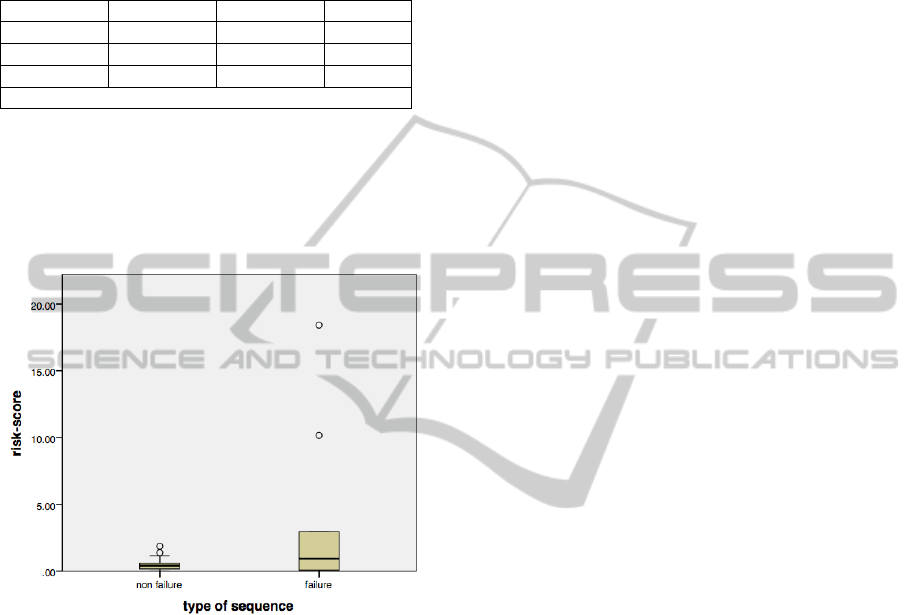
Three-operations signature risk scores were
calculated for all the sequences in the test set. The
comparison between failures and non failures shows
that higher risk scores have been assigned to failure
sequences (Figure 2). So, altogether we obtained a
value of m = 0.59 and M = 1.85.
Figure 2: Risk scores in failure and non failure sequences.
In the test set, the comparison of the risk scores
with m and M gives the following results: in 40 % of
the cases our approach is able to predict correctly the
failure and only in 1% of the cases a predicted
failure is not a failure; this means that a message of
expected failure is quite reliable. On the contrary,
the prediction of non failures is not as reliable: 48 %
of the failing sequences are predicted as non failing.
Altogether, the results from this analysis appear
quite interesting.
4 CONCLUSIONS
In this work we propose to develop devices that read
logs of running applications and warn the supervisor
about the likely failure.
Results show that higher risk scores are assigned
to failure sequences in the test set; 40% of failures
are correctly identified.
These devices are intended to become an
incremental failure prediction tool which is built
after each end of a sequence of operations and uses
data from previous iterations to refine itself at every
iteration.
Our goal now is to study more in-depth our
promising model to determine if we can generalize
our results. To this end, we plan to replicate the
analysis on more industrial datasets.
Another aspect that we will evaluate is the
possibility of predicting the occurrence of a failure
analysing only an initial portion of a sequence, so
that there could be an early estimation of failure,
providing additional time to take corrective actions.
We are also considering additional models to see
if we can achieve higher levels of precisions:
Ó Cox PH model with strata to analyse
covariates not satisfying the PH
assumption;
Ó specific techniques to manage datasets with
a limited number of cases (Bøvelstad,
2010).
Finally, we are now investigating how we could
consider other “black-box” properties or applications
to predict failures; candidate properties include
memory usage, number of open files, processor
usage.
We will also deal with the bias introduced when
calculating survival time without considering the
duration of the last operation.
Finally, the proposed model could be particularly
useful dealing with autonomic systems. Autonomic
systems could be instructed to receive signals of
likely failures and upon reception of such signals
could start a suitable recovery procedure (Müller et
al., 2009).
ACKNOWLEDGEMENTS
We thank the Autonomous Province of South Tyrol
for supporting us in this research.
REFERENCES
Agerbo, E. 2007. High income, employment, postgraduate
education, and marriage : a suicidal cocktail among
psychiatric patients. Archives of General Psychiatry,
64, 12, 2007, 1377-1384.
ICSOFT 2011 - 6th International Conference on Software and Data Technologies
204

Barros, C. P. and Machado, L. P. 2010. The length of stay
in tourism. Annals of Tourism Research, 37, 3, 2010,
692-706.
Benda, B. 2005. Gender differences in life-course theory
of recidivism: A survival analysis. International
Journal of Offender Therapy and Comparative
Criminology, 49, 3, 2005, 325-342.
Bøvelstad, H. M., Nygård, S., Størvold, H. L., Aldrin, M.,
Borgan, Ø., Frigessi, A., and Lingjærde, O. C. 2007.
Predicting survival from microarray data a
comparative study. Bioinformatics, 23, 16, 2080–
2087.
Bøvelstad, H. M. 2010. Survival prediction from high-
dimensional genomic data. Doctoral Thesis.
University of Oslo.
Chen, Y., Zhang, H., and Zhu, P. 2009. Study of Customer
Lifetime Value Model Based on Survival-Analysis
Methods. In Proceedings of the World Congress on
Computer Science and Information Engineering (Los
Angeles, USA, March 31 – April 02, 2009), 266-270.
Coman I. and Sillitti A. 2007. An Empirical Exploratory
Study on Inferring Developers' Activities from Low-
Level Data. In SEKE’07, International Conference on
Software Engineering and Knowledge Engineering.
Coman, I. D., Sillitti, A., and Succi, G. 2009. A case-study
on using an Automated In-process Software
Engineering Measurement and Analysis system in an
industrial environment. In ICSE’09, International
Conference on Software Engineering, pp. 89 – 99.
Cox, D. R. 1972. Regression models and life-tables.
Journal of the Royal Statistical Society Series B, 34,
1972, 187–220.
Hao, K., Luk, J. M., Lee, N. P. Y., Mao, M., Zhang, C.,
Ferguson, M. D., Lamb, J., Dai, H., Ng, I. O., Sham,
P. C., and Poon, R. T. P. 2009. Predicting prognosis in
hepatocellular carcinoma after curative surgery with
common clinicopathologic parameters. BMC Cancer,
9, 2009, 398-400.
Hosmer, D. W., Lemeshow, S., and May, S. 2008. Applied
survival analysis: Regression modeling of time to
event data. Wiley, 2nd edition.
Kalbfleisch, J. D. and Prentice, R. L. 2002. The statistical
analysis of failure time data. Wiley, 2nd edition.
Kleinbaum, D. G. and Klein, M. 2005. Survival analysis:
a self-learning test (Statistics for Biology and Health).
Springer, 2nd edition.
Lee E. T. and Wang, J. W. 2003. Statistical methods for
survival data analysis. Wiley, 3rd edition.
Li, Z., Zhou, S., Choubey, S., and Sievenpiper, C. 2007.
Failure event prediction using the Cox proportional
hazard model driven by frequent failure sequences.
IEE Transactions, 39, 3, 2007, 303-315.
Mannila, H., Toinoven, H., and Verkamo, A. I. 1997.
Discovery of frequent episodes in event sequences.
Data Mining and Knowledge Discovery, 1, 1997, 259
– 289.
Moser R., Sillitti A., Abrahamsson P., and Succi G. 2006.
Does refactoring improve reusability? In Proceedings
of the International Conference on Software Reuse,
287-297.
Müller, H. A., Kienle, H. M., Stege, U. 2009 Autonomic
Computing: Now You See It, Now You Don’t—
Design and Evolution of Autonomic Software
Systems. In: De Lucia, A., Ferrucci, F. (eds.):
Software Engineering International Summer School
Lectures: University of Salerno, LNCS 5413,
Springer-Verlag, 32–54.
Pandalai, D. N. and Holloway, L. E. 2000. Template
languages for fault monitoring of timed discrete event
processes. IEEE Transactions on Automatic Control,
45, 5, 2000, 868 – 882.
Sampath, M., Sengupta, R., and Lafortune, S. 1994.
Diagnosability of discrete event systems. In
Proceeding of the 11th international conference on
Analysis and Optimization of Systems Discrete Event
Systems (Sophia, Antipolis, June 15 – 17, 1994), 73 –
79.
Schmidt, P. and Witte, A. D. 1989. Predicting Criminal
Recidivism Using “Split Population” Survival Time
Models. Journal of Econometrics, 40, 1, 1989, 141-
159.
Scotto M., Sillitti A., Succi G., Vernazza T. 2004. A
Relational Approach to Software Metrics. In
Proceedings of the Symposium on Applied Computing,
pp. 1536-1540, 2004.
Scotto M., Sillitti A., Succi G., Vernazza T. 2006. A Non-
Invasive Approach to Product Metrics Collection.
Journal of Systems Architecture, 52, 11, pp. 668 –
675.
Sherkat, D. E. and Ellison, C.G. 2007. Structuring the
Religion- Environment Connection: Religious
Influences on Environmental Concern and Activism.
Journal for the Scientific Study of Religion, 46, 2007,
71-85.
Sillitti, A., Janes, A., Succi, G., and Vernazza, T. 2003.
Collecting, Integrating and Analyzing Software
Metrics and Personal Software Process Data. In
EUROMICRO, pp. 336 – 342.
Sillitti A., Janes A., Succi G., Vernazza T. 2004. Measures
for Mobile Users: an Architecture. Journal of Systems
Architecture, 50, 7, pp. 393 – 405.
Sillitti A., Succi G. 2005. Requirements Engineering for
Agile Methods. In Engineering and Managing
Software Requirements, Springer.
Srinivasan, V. S. and Jafari, M. A. 1993. Fault
detection/monitoring using time petri nets. IEEE
Transactions on System, Man and Cybernetics, 23, 4,
1993, 1155 – 1162.
Wendel, M., Jensen, U., and Göhner, P. 2008. Mining
software code repositories and bug databases using
survival analysis models. In Proceedings of the 2nd
ACM-IEEE international symposium on Empirical
software engineering and measurement
(Kaiserslautern, Germany, October 09 - 10, 2008),
282-284.
Yanaihara, N., Caplen, N., Bowman, E., Seike, M.,
Kumamoto, K., Yi, M., Stephens, R. M., Okamoto, A.,
Yokota, J., Tanaka, T., Calin, G. A., Liu, C. G., Croce,
C. M., and Harris C. C. 2006. Unique microRNA
FAILURE PREDICTION USING THE COX PROPORTIONAL HAZARD MODEL
205

molecular profiles in lung cancer diagnosis and
prognosis. Cancer Cell, 9, 3, 2006, 189-198.
Yu, S. L., Chen, H. Y., Chang G. C., Chen, C. Y., Chen,
H. W., Singh, S., Cheng, C. L., Yu, C. J., Lee, Y. C.,
Chen, H. S., Su, T. J., Chiang, C. C., Li, H. N., Hong,
Q. S., Su, H. Y., Chen, C. C., Chen, W. j., Liu, C. C.,
Chan, W. K., Chen, W. J., Li, K. C., Chen, J. J. W.,
and Yang, P. C. 2008. MicroRNA Signature Predicts
Survival and Relapse in Lung Cancer. Cancer Cell,
13, 1, 2008, 48-57.
Zheng, Z., Lan, Z., Park, B. H., and Geist, A. 2009.
System log pre-processing to improve failure
prediction. In Proceedings of the 39th Annual
IEEE/IFIP International Conference on Dependable
Systems & Networks (Lisbon, Portugal, June 29 – July
2), 572-577.
ICSOFT 2011 - 6th International Conference on Software and Data Technologies
206
