
TRAJECTORY SEMANTIC VISUALIZATION
Stanimir Bakshev, Laura Spinsanti
Database Laboratory, Ecole Polytecnhique Federal de Lausanne, Lausanne, Switzerland
Jose Antonio Fernandes de Macedo, Creto Vidal
Department of Computing, Federal University of Ceara, Ceará, Brazil
Marco Antonio Casanova
Department of Computing, Pontifical Catholic University of Rio de Janeiro, Rio de Janeiro, Brazil
Keywords: Trajectory Data, Semantic Visualization.
Abstract: Thanks to current GPS technologies, the capture of evolving positions of individual moving objects has
become technically and economically feasible. This opens new perspectives for a large number of
applications (from transportation and logistics to ecology and anthropology) built on the knowledge of
objects’ movements. The goal of this work is to propose a framework that supports querying and
visualization of trajectory data. Trajectory data and its semantic context are modeled by the means of an
application ontology, which allows the user to elaborate semantic queries. Results are rendered using an
automatic matching procedure that allows the user to change the actual visualization of the data.
1 INTRODUCTION
Thanks to current GPS technologies, the capture of
evolving positions of individual moving objects has
become technically and economically feasible. This
opens new perspectives for a large number of
applications (from transportation and logistics to
ecology and anthropology) built on the knowledge
of objects’ movements. From the users' viewpoint,
the concept of trajectory is rooted in the evolving
position of some object, travelling in geographic
space during a given time interval (Spaccapietra et
al., 2008). During motion, each object interacts with
different objects, both static, such as commercial
areas or traffic junctions, and dynamic, such as sport
events or specific weather conditions. This
additional information can help people solve some
common tasks such as pattern identification and
explanation of social phenomena.
GPS recorded data, after some post-processing,
provides many of the physical attributes of the
movement – latitude, longitude, time-stamp,
velocity, direction, distance. However, GPS
trajectories lack semantic information. Research
addressed the task of deriving semantic information
from GPS trajectories using the trajectories
themselves as well as further background knowledge
(Baglioni et al., 2009), (Baglioni, et al., 2008),
(Alvares et al., 2007). The automatic annotation of
GPS trajectories can further be advanced by methods
from the field of data mining and machine learning.
Yet, more complicated patterns and information are
hard to extract from raw GPS data. One needs to use
a conversion routine that is closely related to the
specific application of the data, and that also allows
for direct human manipulation and reasoning.
There are many GIS tools that facilitate the
visualization of spatio-temporal data. On the other
hand, recent research efforts (Baglioni et al., 2009),
(Spaccapietra et al., 2008) aimed at supporting
trajectory-based applications with new conceptual
models, where the semantics of movement is
explicitly expressed via application-aware trajectory
modeling, using ontology management applications
or semantic extensions in popular RDBMS. The
purpose of this work is to integrate these approaches
in order to provide a framework that enables the
visual exploration and analysis of semantically
annotated trajectory data. The results from this
326
Bakshev S., Spinsanti L., Antonio Fernandes de Macedo J., Vidal C. and Antonio Casanova M..
TRAJECTORY SEMANTIC VISUALIZATION.
DOI: 10.5220/0003565603260332
In Proceedings of the 13th International Conference on Enterprise Information Systems (ICEIS-2011), pages 326-332
ISBN: 978-989-8425-53-9
Copyright
c
2011 SCITEPRESS (Science and Technology Publications, Lda.)

analysis can be later used to contribute to the
structured knowledge people have about moving
objects application domains.
There are several important questions in
trajectory data visualization and analysis. How to
characterize cluster of trajectories according to
domain knowledge? Why do trajectories indicate
frequent stops at specific places? Are there any
clusters or trends in this distribution? These
questions determine the need for a framework that
enables users to visualize trajectory data taking into
account domain knowledge, which can be either
spatial – the names of points of interest; temporal –
working days, rush hours, etc; spatio-temporal –a car
passing by polluted areas; or neither spatial nor time
related - such as which trajectories indicate tourist
behavior.
Usually, for each application domain, there is a
set of specific features of the trajectory. Even though
the semantic context may facilitate the
understanding of the data, it may vary among
different applications. Each application usually deals
with special concepts that may be structured and
described in various ways. Thus, an approach that
can provide correct visual cues while being able to
integrate with the different semantic data, regardless
of their structures and purposes, is needed.
Furthermore, by using highly interactive computer
interfaces, one may display visual cues that will
allow for further data analysis, knowledge extraction
and decision support, since the data may be
visualized from different perspectives.
Based on the above discussion, this work
proposes a framework that allows users interested in
trajectory data visualization and analysis to describe
the se-mantic context of the available trajectory data,
to identify and to specify interesting queries, and to
visualize and to analyze the results. The main
contributions of this work are the following:
• Trajectory Visualization – a computer
graphics library that allows for 3D visualization in
standard web browsers. It supports various visual
cues that are used to present application specific
concepts in spatio-temporal space;
• Trajectory Analysis – a set of tools and data
access routines that allow for trajectory data
analyses, such as spatial and temporal queries and
OLAP queries based on trajectory aggregations;
• Semantic Annotations – a set of ontological
modules that allow for the creation of platform
independent, application domain models that are
used as metadata description of the raw trajectory
data, allowing for more natural query formulation
and interpretation of the visualized results;
• Automated visual cue matching – a routine
for automatic matching between result datasets
(trajectories and their semantic context) and the
appropriate visual cues (markers, paths, areas, etc).
2 FRAMEWORK
2.1 Visualization Framework Overview
Trajectory datasets are usually huge with respect to
the number of records. In order to enable human
interpretation of trajectory data, it is necessary to
represent the data in a proper visual way (Andrienko
and Andrienko, 2008). The proposed framework
allows users to visualize structured trajectory data
through an interactive Web-based interface.
Trajectory visualization is explicitly done in the
context of trajectory semantics. The set of possible
semantic annotations is not predefined (explicitly
enumerated), as this can limit the use of the
framework in certain situations. For example, street
junctions are important for traffic monitoring
applications to analyze car flow through the crossing
of two streets, but they are not useful in applications
that analyze bird migration. So, only very generic
semantic annotations are predefined, and they can be
used as a basis for new annotations that are more
application-specific.
This work assumes that the semantic attributes of
a trajectory stem from its interaction with real-world
objects that fall into one of the following categories
– spatial, temporal, spatio-temporal and conceptual.
Spatial semantic attributes can be areas or points of
interest that have spatial interaction with the
trajectory. Temporal semantic attributes relate to the
time fraction during which the trajectory took place.
Spatio-temporal semantic attributes indicate the
evolving position of an object over time, or time-
stamped interaction with places of interest.
Conceptual semantic attributes are all attributes that
do not fall into the previous three categories. These
include any physical characteristic of a trajectory or
any externally annotated value.
The framework provides a set of visual cues and
tools that can be used in a variety of cases, without
further implementation efforts. The main plot area
used to visualize the data is a three-dimensional
structure called spatio-temporal cube (Gatalsky et
al., 2004). The spatio-temporal cube consists of
three axes that represent the x-y geographical
location in a given reference system and the time
axis. Using this approach one can represent all
spatial and temporal semantic attributes of a 2D
TRAJECTORY SEMANTIC VISUALIZATION
327

trajectory, allowing the user to selectively focus on
any of them via a rotation of the cube around the
three axes. Some visual cues are presented outside
the cube, such as components that are used to
facilitate selection of data aggregation levels.
A routine for automatic visual cue generation is
also available. Based on additional semantic
metadata, the framework infers the best visualization
technique. Furthermore, the current implementation
allows users to control this process and select which
attributes should be considered during visualization.
For example, the territorial division of a town will
be visualized, by default, as a set of semi-transparent
gray polygons over a geographic map. However
users are free to adjust this representation, simply by
indicating an attribute of those areas, such as
population or size. The representation will change to
a set of polygons whose colour will now represent
the colour-coded value of this attribute.
A general approach to handling large datasets
includes aggregation and summarization.
Aggregation means combining data items that are
close or similar. Summarization means deriving
characteristics of so-formed aggregates (i.e. groups
of data items) from the characteristics of their
members (Andrienko and Andrienko, 2008).
Trajectories sharing a common semantic attribute
are joined together to form a group, such as
grouping all trajectories that took place in a specific
city area. The average speed of those trajectories can
be visualized as polygonal area in the spatio-
temporal cube (since the city area is a spatial
attribute) and the summarized average speed value
can be then color-coded or presented with a chart
over this area.
Once the current set of data is visualized, the
user is able to freely browse and navigate through it.
Suppose that there are trajectories that are located
inside the neighbourhoods of a town. The supported
operations include filtering the data (show only
congested or pedestrian trajectories), drill-down in
the data (show only the trajectories in a given
neighbourhood), roll-up in the data (show data for
the entire town). Once identified using the different
tools to manipulate the visualization, interesting data
can be exported and saved for future references.
Even though the data may be aggregated prior to
visualization, this can still lead to significant
amounts of data that should be transferred over the
network. The data should be efficiently stored and
manipulated with minimum latency. A set of
methods is developed to form an interface for data
access. This allows for remote access to data via
standard protocols and provides optimization
techniques for quick data access and transfer.
2.2 Framework Components
In order to be able to visualize and analyze trajectory
data and its semantic annotations, there is a set of
components that communicate among themselves to
provide a fully functional system, with the
requirements stated in Section 2.1. In this section,
these subsystems are identified, following a bottom
up approach – from raw trajectory data to its visual
representation.
Trajectory data usually comes in the form of
time-stamped coordinate pairs that identify the
current location and the time of each measurement.
This data can be further processed for removing
noise, for identifying gaps or irrelevant data. The
result is a set of identifiable, structured trajectories
that can be efficiently stored and accessed in any
database system, such as Oracle.
However, to be useful, that data should be
integrated with additional semantic data, which is
specific for each application domain. For instance,
this may include not only geographical data, such as
territorial division and points of interest, but also
animal territories, climate zones, pollution areas, etc.
For this purpose, experts in a particular domain may
first identify its main concepts, then enumerate the
relations among those concepts and note their
possible interactions with moving objects. The goal
is to construct an application ontology that explicitly
defines the semantic context of a trajectory in which
the trajectory data should be integrated.
As a last step, the semantic data is integrated
with the trajectory data. There are several
approaches that allow for such integration (Baglioni
et al., 2009), (Baglioni, et al., 2008), (Alvares et al.,
2007). Once both the trajectory data and the
description of its possible semantic attributes are
available, the proposed framework can query and
visualize the data. Even though data can be directly
queried from the database with standard query
languages, there is a possibility to make this process
more tightly coupled with the application domain,
thus making the meaning of the results clearer.
With an application ontology describing the
trajectory data and enumerating the set of
application-specific concepts and the possible
relations among them, it will be convenient to
exploit this information to allow for easier, more
natural formulation of data queries. Assume that a
person wants to visualize all congested trajectories
that passed by a city’s traffic zone. Using the
ontology, a procedure can infer what stands behind
ICEIS 2011 - 13th International Conference on Enterprise Information Systems
328

the concepts of traffic zone and congested trajectory.
This will allow it to get only the relevant data and
know the structure of this data, thus allowing the
framework to provide appropriate visual
representation. The main benefits stemming from
this approach are the following. First, data queries
can be formulated in terms of the application
domain, which means that the same trajectory data
can be used in various applications, where only the
semantic schema will vary. For example traffic
applications can introduce types of trajectories such
as congested, high speed or pedestrian, which pass
through traffic zones, while another application
dealing with studies of people behavior in city areas
can refer to shopping, entertainment and sport
trajectories that reach shops or cinemas. Second, the
visualization of the data can be done directly by the
framework, without the need of additional coding
efforts or explicit specification as to what visual cue
should be used for trajectories or their semantic
attributes. During data identification, the user should
select a list of trajectory semantic annotations that
are of interest to him. When the framework
visualizes the trajectory data resulting from this
query, it will show the trajectories with the relevant
values of their semantic attributes.
This work uses several techniques to display
large numbers of related visual cues even in
relatively small computer displays. These techniques
include three-dimensional visualization that allows
to integrate both spatial and temporal attributes of
trajectories within the spatio-temporal cube;
mapping layers that allow users to get instant, visual
geographic reference of the trajectory data; a multi-
layered perspective view that enables the perception
of many spatial layers at the same time, without
overlapping; freely changing the viewpoint so one
can focus on certain data and notice patterns that are
not easily identifiable from a fixed angle (see Figure
3).
A comparison with the data warehouse
abstraction is possible here. For example, in the
dimensional approach in data warehousing, data is
partitioned into either "facts", which is generally
numeric data, or "dimensions", which are the
reference information that gives context to the facts.
With respect to trajectory data, it can be broken up
into facts, such as movement speed or duration, and
into dimensions, such as points of interest, areas and
dates. Also, the retrieval of data from the data
warehouse tends to be very quick. So, as already
mentioned, by changing the viewpoint in the
visualization, one can focus on a specific dimension
– time (with side view) or points of interest (with top
view).
If the resulting dataset is too large, additional
grouping of the results can be performed using the
relationships among the concepts. For example,
suppose that a traffic analyst identified that
maintenance work (a concept) affected a set of
streets, and that he/she wants to visually analyze the
average speed and the number of trajectories that
passed through those streets during the period when
only part of the streets were closed. Obviously, this
aggregated number will provide some additional
semantic information about the trajectory, meaning –
did this maintenance work cause more congestion
than usual?, or did it make people use alternative
roads instead? Visualizing this type of aggregated
trajectory data and providing the necessary
analytical tools can further enrich the understanding
of the path generated by a moving entity in a given
context.
After a query has been sent for execution, the
results need to be visualized in a proper way. In
general, each query selects a subset of the
dimensions and measures in a predefined trajectory
cube. Thus, the structure of the results can be
inferred directly from this cube, and then can be
further reduced to some basic components needed to
provide proper visualization. Since spatio-temporal
cube is used as primary display to visualize the data
on a two-dimensional map with additional third
dimension for the time, the results need to be
decomposed into basic elements like time instants or
intervals, location points, and scalar values.
This decomposition is done via the ontological
module Visual Cues, represented on Figure 1. The
main map overlays are enumerated and linked to the
Geometry concept from the Movement ontology,
which includes trajectory conceptualization (more
details about Movement ontology can be found in
(Zhixian et al., 2008), via the has Shape property.
Using the fact that each Geometry instance can be
reduced to a set of Points, this provides the
necessary location points on the map. Apart from
that, each Point is time-stamped with Time instance.
As a result it is possible to construct a pattern for the
data that can be visualized by each map overlay. On
the other hand, the data that is returned from a query
to a given trajectory cube can also be reduced to sets
of Points which will form the pattern of the data.
Matching this pattern with the pattern of all overlays
generates the possible visualization technique that is
being applied in the specific case.
This paragraph shortly describes the
correspondences between data patterns and the
available overlays, and also what approach should
TRAJECTORY SEMANTIC VISUALIZATION
329
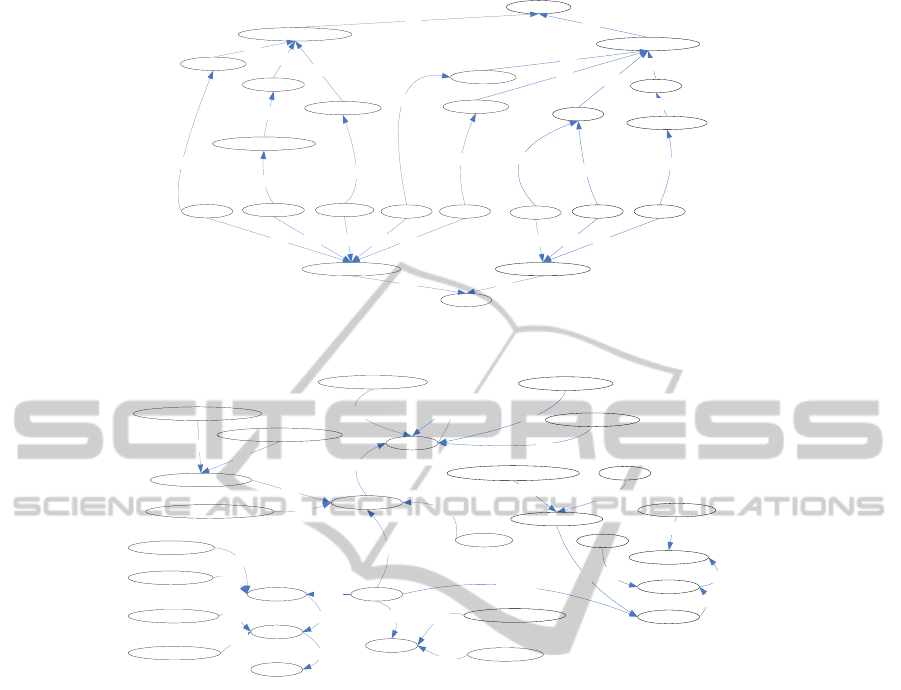
Figure
1: The visual cues ontology.
Figure
2: Structure for the Traffic Management Ontology.
be followed when creating new dimensions. The
Marker overlay visualizes data that represents
location on the map. It can be used to point events,
points of interest or geographical objects. For a
single Marker the data pattern comprises of a Point
instance and a scalar value that can be used to select
a distinct visual hint such as color or icon. The Chart
overlay can be used to present statistical information
that is referred to a single location of area. This can
be the weekly distribution of the number of
trajectories passing through a point of interest or any
other scalar value distribution over a discrete time
interval. The data pattern here requires a Point
instance and a set or multiset of scalar values that
are presented with bar, pie or line chart. The Arrow
overlay is intended to show the characteristics of a
movement between two distinct regions or points in
a geographical region of interest (ROI). These
characteristics can be the main directions of
movements within a city or indicate time intervals
for certain events, by orienting the arrow to be
collinear with the time axis. The pattern required for
this overlay consists of an OrientedLine and a scalar
value that can be mapped to different weights or the
colors of the arrow.
3 EXPERIMENTAL RESULTS
This section presents the visualization results
generated by a case study in the traffic management
domain. Information about trajectories is recorded
and stored in a relational database. First, an
ontological description of this application domain is
presented. This includes identifying some of the
main concepts in traffic management, and
enumerating their properties and relations. Then, it is
shown how to create two distinct data cubes that
help users analyze different aspects of the same
trajectory data. Finally, visual results for several
interesting queries are presented along with some
means that enable users to easily change the visual
representation of the data with simple manipulations
in the ontological description.
Geometry
Point
Polygon
Line
Simple Geometry
Is-a
Is-a
Is-a
Point Bag
Polygon Bag
Line Bag
Complex Geometry
Is-a
Is-a
Is-a
Oriented Line
Oriented Line Bag
Is-a
Is-a
Is-a
Is-a
Overlay
Complex overlay Simple overlay
HeatmapNetwork
AreaPath ArrowChart
Marker
Grid
Is-a Is-a
Is-aIs-a
Is-a
Is-a
Is-a Is-a
Is-a
Is-a
hasShape
hasShape
hasShape
hasShape
hasShape
hasShape
Polyline
Is-a
hasShape
hasShape
ROI
Day
Trajectory
Move
ofTrajectory
passedBy
during
Pedestrian Trajectory
Car Trajectory
Congested Trajectory
Highspeed Trajectory
Is-a
Is-a
Is-a
Is-a
Week Day
Weekend Day
Is-a
Is-a
Street
TwoLaneStreet
House
Trafic area
Neighbourhood
Dense Neighbourhood
Is-a
locatedIn
Is-a
Is-a
intersectsWith
Is-a
movedAlong
Year
Month
during
during
Region
Environment
Area
locatedIn
locatedIn
Summer Month Is-a
Winter Month
Is-a
locatedIn
Maintain activity
includesStreet
ObservationPoint
Is-a
OneLaneStreet
Is-a
Person
hasTrajectory
Town
Is-a
Municipality
Is-a
ICEIS 2011 - 13th International Conference on Enterprise Information Systems
330
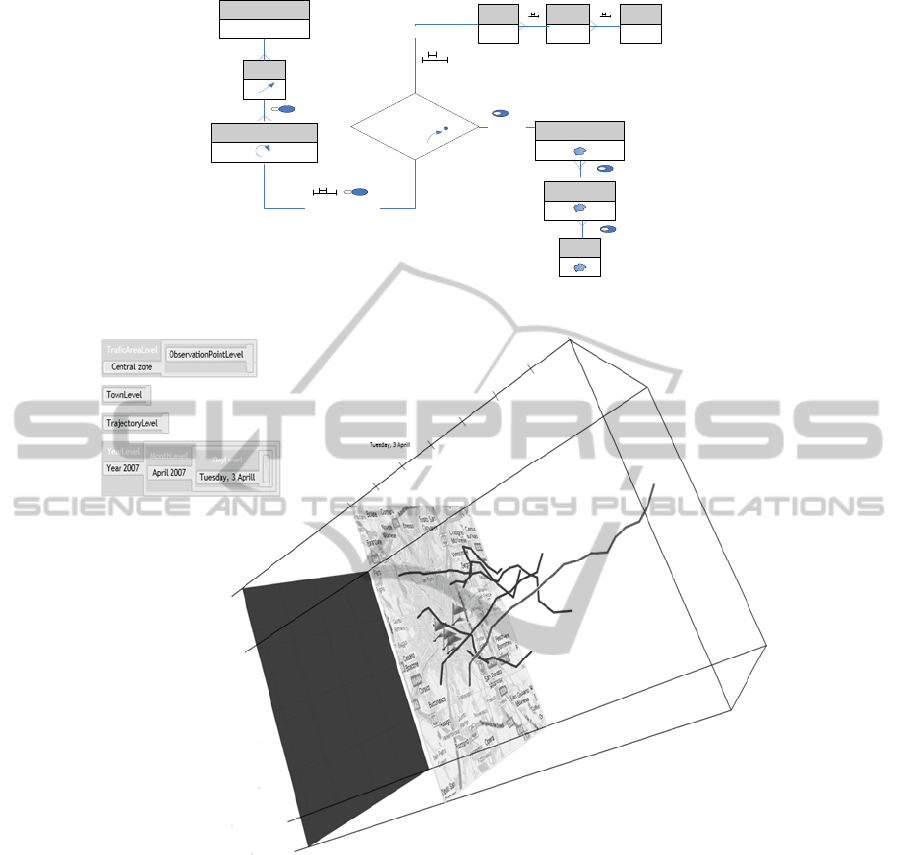
Figure 3: Semantic cube for car trajectories affected by maintenance activities.
Figure 4: Trajectories in city center.
Figure 2 shows the concepts of the traffic
management application. Each Move is assumed to
happen during a particular day and to be located in
one of the predefined areas resulting from the
division of the Town into a set of Neighbourhoods.
The concept of Traffic areas serves as an additional
division of the town into a set of areas that contain
Observation points monitoring the current traffic
conditions. The concept of Maintenance activities is
added to model actions that affect one or several
Streets, which can be One-lane or Two-lane streets.
Time is assumed to be composed of Weekdays or
Weekend days, while the months are either Summer
or Winter months.
In general, each Trajectory in this ontology is
considered to have the following semantic attributes:
it is located in one or several neighborhoods; it took
place during a specific day; and possibly passed by
some observation points located in various traffic
areas. Additionally, a trajectory was generated
during the movement of a specific person, either by
car or by walking, and the person’s movement took
place along streets that might have been affected by
ongoing maintenance activities.
One important point to highlight is the mapping
between trajectory data and domain ontology. It is
assumed that it is feasible to identify all structured
trajectories, with their respective sets of moves and
stops, and the physical characteristics of the move,
such as velocity, distance, location and time. This
Move
Month Year
CarTrajectory
TIME
Day
TRAJECTORY
Street
Town
Municipality
Neighbourhood
SPACE
MaintainActivity
TRAJECTORY SEMANTIC VISUALIZATION
331

data is loaded into the table Moves and is then
enhanced with semantic information about its
spatial, and temporal dimensions and about the ROI
it passed by. The result is a relational schema
populated with trajectory data on top of which it is
now possible not only to add a domain ontology that
describes the data and their relationships, but also to
describe interesting subsets of the data, which can be
automatically visualized and analyzed using the
tools the framework provides.
There are two semantically enriched subsets of
data that can be of interest in this scenario. The first
one helps users identify trajectory (either car or
pedestrian) characteristics in the context of their
temporal distribution among the different traffic
areas in the city. The second will help users follow
the impact that different maintenance activities in
the city had on the movement of cars. The generic
structure for this subset is identified in Figure 3.
Based on those needs, the user can define
trajectory cubes that relate trajectories to the
important semantic dimensions that were indentified
or, in other words, he/she can describe the semantic
annotations that are relevant to each case. Then the
user can arrange them in a multidimensional
structure where each cell contains some physical
characteristic of the trajectories, and each dimension
is related to trajectory interaction with different
traffic domain concepts.
Suppose we want to answer the following query,
“Give me all trajectories that passed by the city
center area”. Figure 4 presents the result of this
query, which is a set of trajectories, whose semantic
type is color-coded. Dark grey lines represent car
trajectories, and light grey lines refer to pedestrian
trajectories. The time period selected is April 3rd.
The user may inspect the relationships among these
trajectories, and the different observation points. The
user may also observe that the pedestrian trajectory
in this case has a longer duration.
4 CONCLUSIONS
This paper presented a framework that allows
semantic visualization of trajectories taking into
account users’ domain knowledge. Using the
expressive power of custom icons, visual styles,
charts and direction indicators, layers and 3D
visualization it is possible to provide meaningful
representations of trajectories and navigate through
different aggregation levels. The domain knowledge
is explicitly modelled with an ontology that
facilitates the understanding of the data and is used
internally for automatic detection of the appropriate
visual representation.
REFERENCES
Alvares L., Bogorny V., Kuijpers B., Macedo J. A. F., B.
Moelans, Vaisman A.: A model for enriching
trajectories with semantic geographical information.
Proc. 15th annual ACM International symposium on
Advances in geographic information systems (2007)
Andrienko N., Andrienko G.: Spatio-temporal aggregation
for visual analysis of movements Visual Analytics
Science and Technology - VAST'08 (2008)
Baglioni, M.; Macêdo, J. A. F.; Renso, C.; Trasarti, R.;
Wachowitz, M. Towards Semantic Interpretation of
Movement Behavior. In: 12th AGILE Int. Conf. on
Geographic Information Science, 2009, Hannover/
Germany. Advances in GIScience – Proc. 12th AGILE
Conference, 2009. p. 271-288.
Baglioni, M.; Macêdo, J. A. F.; Renso, C.; Wachowitz, M.
An Ontology-Based Approach for the Semantic
Modelling and Reasoning on Trajectories. In: 27th Int.
Conf. on Conceptual Modeling - ER2008 Workshops:
Semantic and Conceptual Issues in Geographic
Information Systems (SeCoGIS), 2008, Barcelona,
Espanha. Advances in Conceptual Modeling
Challenges and Opportunities. Heidelberg: Springer
Berlin, 2008. v. 5232. p. 344-353.
Andrienko N., Andrienko G.: EDA: Tasks, Tools,
Principles, Fraunhofer Inst.A IS (2004)
Campora S.: Trajectory Data Warehousing, Master thesis
in LDB, EPFL (2010)
Gatalsky P., Andrienko N., Andrienko G. Interactive
Analysis of Event Data Using Space-Time Cube.
Proc. 8th Int. Conf. on Information Visualization, pp.
145 – 152 (2004)
Güting R. H., Schneider M.: Moving Objects Databases
(2005)
Kuijpers B., Othman W.: Trajectory databases: Data
models, uncertainty and complete query languages In
Thomas Schwentick and Dan Suciu, editors, ICDT,
volume 4353 of Lecture Notes in Computer Science,
pages 224--238. Springer (2007)
Parent C., Spaccapietra S., Zimanyi E., Donini P., Plazent
C., Vangenot C.: Modeling Spatial Data in the MADS
Conceptual Model In Proceedings of the 8th
International Symposium on Spatial Data Handling,
SDH'98, p. 138-150 (1998)
Poggi A., Lembo D., Calvanese D., Giacomo G.,
Lenzerini M., Rosati R. Linking Data to Ontologies. J.
Data Semantics 10: 133-173 (2008)
Spaccapietra S., Parent C., Damiani M. L., Macedo J. A.
F., Porto F, Vangenot C: A conceptual view on
trajectories Data & Knowledge Engineering (DKE)
(2008)
Zhixian Y., Macedo J. A. F., Parent C., Spaccapietra S.:
Trajectory Ontologies and Queries Transactions in
GIS, vol. 12, num. s1, 2008, p. 75-91 (2008).
ICEIS 2011 - 13th International Conference on Enterprise Information Systems
332
