
Several Issues on the Definition of Algorithm for the
Layout of the UML Class Diagrams
Arturs Galapovs and Oksana Nikiforova
Riga Technical University, Faculty of Computer Science and Information Technology
Meza ¼, Riga, LV 1048, Latvia
Abstract. System modeling is one of the important tasks to be solved during
software development. As more complex software systems become as higher
requirements are defined for demonstrative presentation of the system to be de-
veloped. To solve this task the main attention is devoted to the transparency of
the model elements within the graphical presentation of the system. The paper
defines the classification of different types of UML diagrams, which are
created during development of the software system. This classification is based
on the different combinations of nodes and arcs of the diagram graph. The
UML class diagram is selected for deeper analysis to the elements’ layout. Au-
thors offer to use main principles of the genetic algorithm to automate the re-
placement of the diagram created in the manual way. Current results are quite
theoretical yet and authors will continue the research based on the issues de-
fined in this paper.
1 Introduction
System modeling gives software developers an ability to understand system behavior,
structure and its separate elements. System modeling is a way of thinking about
problems using models, which are based on real-world ideas. Models are useful for
understanding problems, communicating with everyone involved within the project
(customers, domain experts, analysts, designers etc), modeling enterprises, preparing
documentation and designing programs and databases. Modeling promotes better
understanding of requirements, more clear designs and more maintainable systems.
Graphical models help to provide a common base for system developers at differ-
ent levels of system domain and are used at different stages of system abstraction. It
is specially pointed to such standardized modeling mean as Unified Modeling Lan-
guage (UML) [1]. The graphical aspect of modeling language turns developers to an
intuitive language semantics and perceptible location of model elements on the dia-
gram. Thus modelers have to decide two main tasks during creation of the diagram: to
think of how to present system functionality by diagram elements and to invent an
optimal placement of diagram boxes and wires. This paper focuses on the placement
aspect of system modeling. It is to try to solve the problem of diagram layout in cor-
respondence with the variety of the UML diagrams.
The paper is structured as follows. In Section 2 the authors discuss main problems
Galapovs A. and Nikiforova O..
Several Issues on the Definition of Algorithm for the Layout of the UML Class Diagrams.
DOI: 10.5220/0003582200680078
In Proceedings of the 3rd International Workshop on Model-Driven Architecture and Modeling-Driven Software Development (MDA & MDSD-2011),
pages 68-78
ISBN: 978-989-8425-59-1
Copyright
c
2011 SCITEPRESS (Science and Technology Publications, Lda.)

of modelers in their working with diagram creation, transformation and export to
other modeling tools and summarizes related works in the area of diagram layout.
Algorithm for layout of the UML class diagram is described in section 3. It is based
on the usage of main principles of the genetic algorithms. The conclusion and main
issues of the current research results are resumed in the last section of the paper.
2 Layout Issues within the Working with Models and Related
Works
Usually system model is organized as a set of diagrams, where specific notation is
defined for each diagram and regulates diagram syntax and semantic. As far as sys-
tem models are abstractions that portray the essentials of a complex problem or struc-
ture by filtering out nonessential details, models are making the problem easy to un-
derstand. One of the tasks of software development is to present different aspects of
the system before developing the software solution for the required system. To solve
this task system modeling became one of the important activities during software
development. Thus the systematic approach to elements placement within the dia-
gram, which is specified as a task of diagram layout, plays an important role in com-
pleting the task of system modeling [2]. What is more, an increasing interest to soft-
ware development within the framework of Model Driven Development turns focus
again to the area of diagram layout, which harmonize with the area of graph theory.
The authors state three major fields of working with diagrams, where the prob-
lems with layout of model elements have to be solved: (1) allocation of elements
during creation of model (in other words self-transformation of the diagram); (2)
transformation of one diagram into another within one modeling environment and (3)
model import from one tool into another (according to the same type and abstraction
level of the diagram).
The graph layout problem is studied by a large research community, which has
developed a wide variety of different layout algorithms. Already in 1985 several
works have been done on ER (Entity-Relationship) diagrams: Batini, Furlani and
Nardelly in [3] described some aesthetics and applied topology- shape-metrics ap-
proach. For network diagrams Kosak, Marks and Shieber in [4] specifies two algo-
rithms respecting certain visual organization features are considered. The first algo-
rithm incrementally augments a drawing by selecting and applying a layout rule until
each node has been positioned. The second is a parallel genetic algorithm. Freivalds
and Kikusts in [5] and along with Dogrusoz in [6] propose new approaches and tech-
niques for graph layout, several principles of it is applicable also for diagram layout.
Several researches have been done for layouts of class diagrams. Early work of
Battista and his colleges explored graph drawing algorithms and aesthetics [7], [8],
[9], [10]. Some new approaches have been proposed for graph layout specifically in
the UML class diagram domain. Eiglsperger et al. in [11] proposed an algorithm
based on the topology-shape-metrics approach for automatic layout of class diagrams,
which works well for class diagrams with pure relationships between classes. Eichel-
berger introduced a layout algorithm according to a large number of aesthetic criteria
of UML class diagrams [12]. Dwyer presented a three-dimensional UML class dia-
69

gram representation using the Force Directed algorithm [13]. Andriyevska and her
colleges give research on positive aspects of diagram’s elements’ layout in [14].
Gutwenger et al. introduced an approach for visualizing UML class diagrams con-
forming to a balanced mixture of aesthetic criteria [15].
Such algorithms have been implemented in commercial tools such as yFiles
(yWorks GmbH) and ILOG JViews [16] as well as non-commercial tools such as
Graphviz [17] and Zest, which is part of the Eclipse Graphical Editing Framework
(GEF). A variant of the hierarchical layout algorithm [18] is also integrated in GMF
(the Arrange All button that appears for GMF diagrams); however, that integration
lacks flexibility and the resulting layouts are not useful in many cases, as seen in Fig.
1a. The Open Graph Drawing Framework (OGDF) is a C++ class library that con-
tains sophisticated graph algorithms for automatic layout [19]. Other approaches for
layout of class diagrams have been proposed by Seemann [20], and Eichelberger [21].
Furmann et al approach to automatic layout of graphical diagrams is better described
as meta-layout [22]: instead of forcing the user to accept a fixed layout algorithm,
they offer a flexible interface that allows set different layout options for each dia-
gram, or even for each part of a diagram. These options include the selection of a
specific layout algorithm, which in turn can be contributed using Eclipse extension
points.
Researches also have been made on other types of UML diagrams. Eichelberger in
[23] gives researches on automatic layout of UML (Unified Modeling Language) use
case diagrams. Bist with MacKinnon and Murphy presents an approach to draw se-
quence diagrams in technical documentation to ease communication between project
members [24]. Poranen with colleges proposes various criteria for drawing a se-
quence diagram based on traditional graph drawing aesthetics and the special nature
of sequence diagrams [25]. Wong and Dabo give requirement set based on cognitive
science for sequence and class diagrams, which can help to improve diagrams’ reada-
bility [26].
The KIEL project [27] evaluated the usage of automatic layout and structure-
based editing in the context of Statecharts. It provided a platform for exploring layout
alternatives and has been used for cognitive experiments evaluating established and
novel modeling paradigms. However, it was rather limited in its scope and applicabi-
lity, hence it has been succeeded by the KIELER project [28], which is the context of
the work presented here. KIELER aims at enhancing the pragmatics of graphical
modeling, i. e. the way to interact with graphical models [29], and implements generic
approaches applicable for a wide variety of graphical model types, including different
UML diagrams. KIELER integrates into the Eclipse platform, which has a large user
community in the modeling domain [30]. It makes use of the projects around the
Eclipse Modeling Framework (EMF) and especially aims at providing its services to
all graphical editors created with the Graphical Modeling Framework (GMF) [22].
Purchase and her colleagues analyzed graph layout aesthetics in UML diagrams,
focusing on user preferences, and conducted empirical studies of human comprehen-
sion to validate those aesthetic criteria and rank their effect [8], [31], [32], [33]. They
also compared various UML notations, and suggested which notations are more un-
derstandable [32]. Since there are so many criteria, with some conflicting with each
other, software engineers and tool designers are often overwhelmed and confused on
choosing the appropriate algorithm to use. Author of [34] have been analyzed several
70

modeling tools, such as ArgoUML, MagicDraw, IBM Rational Software etc. The
result of the experiments with diagram import/ export and evaluation of their layout is
that there are still problems with optimal allocation of diagrams elements. And still
the problem is not solved. Also, [26] observed that little research has been done on
evaluating layout functionality, which is crucial for the efficacy of existing UML
modeling tools. [26] analyzes and classifies key criteria and guidelines for the effec-
tive layout of UML class and sequence diagrams from the perspective of perceptual
theories. [26] illustrates how the criteria can be applied by analyzing and evaluating
the diagram layout in two commercial tools: Borland Together and Rational Rose,
and concludes that both tools are very pure in the layout of elements of the UML
class and sequence diagrams.
The authors of this paper made an observation about the state of the art in the area
of diagram layout and proposed the classification of different types of possible dia-
grams of the system model [2]. As authors are mentioned in the Introduction, the task
of element placement during system modeling has an impact on better understanding
of system model and more effective usage of them during development of the system.
Nowadays one of the leaders in system development is object oriented manner of
software development and object oriented system modeling has its own way for pres-
entation of different aspects of the system. Therefore the classification of diagrams
for solving the problem of diagram layout is described on the example of UML (Uni-
fied Modeling Language) [1], which is declared as a standard for presentation of
software system model and provides a notation, which grows from analysis through
design into implementation in object oriented programming languages. The classifica-
tion is based on the analysis of different combinations of the nodes and edges of the
diagram.
As a notation of system modeling for different aspects of the system, UML intro-
duces different types of diagrams, which can describe system from different points of
view. We can assume that all diagrams more or less are represented in a graph form –
diagram consists of nodes, which are connected with arcs in some manner. However
different diagram types can have different structure: diagram can have different type
of nodes or arcs, diagram should be constructed in some special manner.
UML class diagram have one type of nodes that represent system classes and sev-
eral types of arcs, which show different types of class relationships. It is classified as
a diagram, which requires specific regulations for graph arcs. The next section of this
paper is focused on the definition of algorithm for diagram layout for the UML class,
which is positioned as a graph with specific types of arcs and therefore specific re-
quirements for node’s position under the presentation of relationships between
classes.
3 Algorithm for Automatic Layout of The UML Class Diagram
To specify UML diagrams’ elements’ layout comprehension, possible solutions for
UML diagram transformation from chaos state to normal form have to be defined by
two definitions given in the name of transformation. Dictionaries define chaos as state
of extreme disorder and uncertainty. Taking this definition in the consideration it is
71

possible to conclude that UML diagram in chaos state have low elements’ layout
efficiency. According to Murdock in [35] normal form – in mathematics, object’s
simplified form achieved by transformations, which don’t affects this object’s proper-
ties. The normal form of UML diagram is initial diagram’s transformed state, which
was found applying diagram’s elements’ relocations in space and which layout satisfy
some requirement set. Wong and Dabo introduce idea to base requirements for UML
diagrams layout on perceptual theories in [26]. This give ability to base requirements
set for class diagrams on science. That will provide answers why to use certain re-
quirements and why one requirement is stronger that another. Authors of [26] give
these requirements for class diagrams:
1. Minimize crossings and bends – the number of edge crossings and bends should
be minimized to make edges more continuous and easier to follow. Evaluated by
count of crossing and bends.
2. Exploit proximity – diagrams should be compact for easier viewing, but further
refinements can be made on the spacing of nodes. Evaluated by links’ length devia-
tion from “normal” length. Normal length can be manually defined or calculated
using sizes of nodes.
3. Place parents near children – parent node and its child nodes should be placed
near to each other, because they are closely related. Evaluated by links’ length devia-
tion from “normal” length between parent and child.
4. Avoid overlapping – nodes and edges should not overlap other nodes or edges.
Evaluated by count of overlapping.
5. Position superclasses above subclasses – a superclass should be above its sub-
classes, and the inheritance arrows should point upwards, because people are usually
familiar with putting superior objects above other objects. Evaluated by count of
superclasses above subclasses and their closeness.
6. Employ symmetry – symmetry within the diagram should be used effectively,
since symmetric areas are usually seen as distinct.
7. Draw arcs orthogonally – the edges connecting nodes should be orthogonal. Eva-
luated by links’ angle deviation from normal angle.
8. Enhance flow – since people naturally read text left to right (in most cultures), and
top to bottom, diagrams should have a similar starting point and subsequent flow.
9. Orient labels horizontally – all the labels should be placed horizontally so that
they can be more easily read. Evaluated by orientation of “note node”.
10. Apply horizontal edges for non-inheritance relationships – a common convention
is to place relationships horizontally, except for inheritance. Evaluated by count of
horizontal placed relationships and vertically placed inheritances.
3.1 Used Algorithm
There are 10 requirements introduced for UML class diagrams and each of these
requirements must be considered during layout algorithm work. According to [36]
there is no deterministic algorithm to find optimal solution in case if many require-
ments conflict with each other. Existing approaches often use sets of heuristics that
72

are often not compatible with the current situation on the diagram [36]. For automatic
UML diagram’s elements’ layout will be used evolutionary algorithm. These algo-
rithms can be easily adopted for finding better placement of elements of UML class
diagrams, considers diagram’s current state and make possible user’s intervention.
At initial research stage it is not critical which one evolutionary algorithm will be
used. It is important to provide statistical data, define which requirements defined in
previous section have higher priority and show that evolutionary algorithms are usea-
ble for improvement of diagram’s layout.
Genetic algorithm is most common from evolutionary algorithms family. Accord-
ing to [37] genetic algorithm encode a potential solution to a specific problem on a
simple chromosome-like data structure and apply recombination operations to these
structures so as to preserve critical information. This definition of genetic algorithm is
similar with explanation of chaosnormal form transformation given earlier. Genetic
algorithm has useful positive traits:
1. It can consider as many requirements as needed – each requirement is imple-
mented as fitness function. Each separate fitness function can be part of general fit-
ness function;
2. Can be easily modified in terms of adding or removing some requirements;
3. Can be made adjustable – weight can be assigned to any fitness function. This
weight will define how important specific requirement is. Ability to set weights can
be given to user;
4. Guarantee probabilistic choice – any layout can be produced from the same start-
ing point [36];
5. A set of solutions is evaluated simultaneously and parts of the currently best
solutions are exchanged to produce the next ones [36];
6. Each time full solutions are modified what gives a chance to break the process at
any time (and the solution which is the best one up till that time can be presented to
the user) [36];
7. The currently best solutions are preserved (assuming that the fitness function is
stable) [36];
8. The process of finding layout can be restarted from any point [36].
3.2 Implementation
Each individual in problem of layout of UML class diagrams’ elements can be de-
scribed with coordinates of nodes (classes) and adjacency matrix. Different layouts of
the same UML diagram are seen as separate individuals in terms of genetic algorithm.
Therefore 5 steps of genetic algorithm in the terms of the layout of the UML class
diagram can be defined as follows:
1. Creation of initial population [37]. In problem of UML diagrams’ layout popula-
tion is a set of different layouts of same UML diagram. Creation of initial population
is made by randomizing placement of UML diagram’s elements and taking layout
given by user as it is;
2. Evaluation of all population’s individuals with special fitness function [37]. In this
73
particular implementation general fitness function is equal to ten separate fitness
functions, where each separate fitness function represent one of the defined require-
ments for class diagrams;
3. Selection of individuals for creation of next generation [37];
4. Handling of chosen individuals with genetic operator (mutation, cloning, cros-
sbreed) to get new generation [36];
5. Return of one or several best individuals from given population [36].
Fitness function distinguishes the best layouts from current population. Every fitness
function is sum of negative and positive aspects of given layout multiplied by weight
of this aspect. Examples of negative aspects are: node overlapping, crossings and
bends; positive: links’ orthogonally, close placements of children and parent nodes,
diagram’s compactness, symmetry, superclass and subclass positioning.
Genetic operators help to produce new individuals (new layouts of UML class di-
agrams). [36] distinguishes three genetic operations (mutation, cloning and cros-
sbreed) and introduce its implementation for pure graphs.
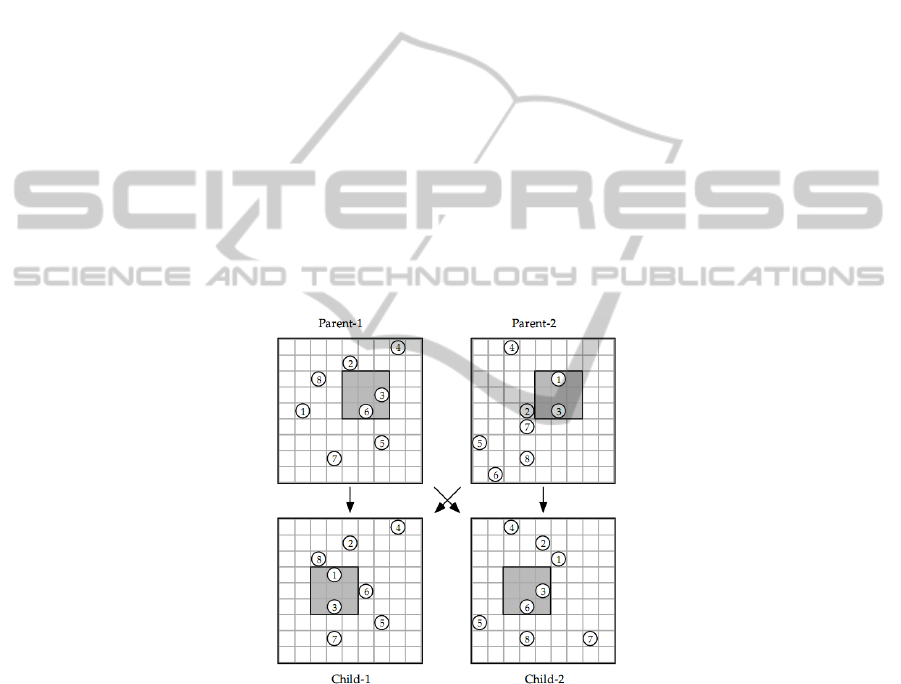
Crossbreeding operation transforms two individuals into two new individuals. In
other words crossbreeding operation makes two offspring from two parents, which
have traits of both parents. [36] introduces RectCrossing function. This function takes
square region in both parents. Then equal square region is taken in offspring. Parents’
nodes that are situated in chosen square areas swop their positions, but all other nodes
stay in the same place. Scheme of this function is shown in Figure 1.
Fig. 1. Scheme of RectCrossing function.
Mutation changes one or several elements of certain individual [37]. [36] propose
8 mutation operations:
1. SingleMutate - choose a random node and move it to a random empty square;
2. SmallMutate - choose randomly two squares from the drawing area such that at
least one of them contains a node. If both contain a node, exchange the nodes. If only
one of them contains a node, then move the node from the present location to the
empty square;
74

3. LargeContMutate - choose two areas of equal size and shape from the grid. Ex-
change the contents of the chosen areas;
4. EdgeMutation-1 - choose a random edge and move it to a random new position.
5. EdgeMutation-2 - like EdgeMutation-1, but the length and angle of the edge is
kept unchanged, if possible;
6. TinyEdgeMove - like EdgeMutation-2, but the edge is moved only at most one
square both horizontally and vertically;
7. TwoEdgeMutation - like EdgeMutation-2, but two edges incident with a same
node are moved;
8. TinyMutate - like SingleMutate, but the node is moved only at most one square
both horizontally and vertically.
All mutation occurs with certain probability, except cases, when mutation is forced.
Mutations tend to fasten process of finding better solution – better layout of UML
diagram.
All 5 steps of genetic algorithm repeats until user stops this process or some re-
quirements are met (for example, better solution was not found for 1 minute). The
application of principles of the genetic algorithm applied for the definition of the
algorithm for the UML class diagram layout is used for layout of class diagram with
about 50 nodes, which are placed in the state of chaos. The defined algorithm put the
diagram straight according to the defined requirements of the UML class diagram
layout. Due to limitations of the paper format the demonstration example is not in-
cluded in the paper.
4 Conclusions
The standardized notation is still one of the main success factors of UML. However,
even after several iterations, the de-facto standard modeling language still comprises
inconsistencies and weaknesses, e.g. in formal semantics. One additional drawback of
UML regarding human communication is the large number of possibilities for design-
ing and displaying models, e.g. presentation options. Graphical modeling languages,
as defined in the UML, are appealing in their relative ease of comprehension. A well-
structured model can provide a compact representation of complex designs. However,
the development of graphical models is still hampered by modeling tools that force
the user to perform low-level graphical editing steps, instead of focusing on the un-
derlying model. Therefore solving the task of automatic diagram layout is of the in-
creasing interest of researchers.
The authors of this paper offer to use the main principles of the genetic algorithms
to overcome the conflicting requirements for placement of different types of the UML
class diagram. The UML class diagram is selected for the deeper research as it is
typical representative of the diagrams containing one kind of nodes in the graph struc-
ture and different kinds of arcs with different requirements to their representation.
The operations defined by the genetic algorithm allow managing the selection of the
more appropriate solution for definition of elements’ placement and finding which
requirements for layout are stronger than others.
75

The presented results are just theoretical findings to prove the authors’ hypothesis
about usability of the genetic algorithm to solving the problem of diagram layout.
Several experiments are made on several combinations of elements’ placement, which
can approve the direction for further research in the area of definition the algorithm
for automatic layout of the UML class diagram as a first, and the rest types of UML
diagram for future investigations.
Acknowledgements
The research reflected in the paper is supported by Grant of Latvian Council of
Science No. 09.1245 "Methods, models and tools for developing and governance of
agile information systems" and by ERAF project “Evolution of RTU international
collaboration, projects and capacity in science and technologies”.
References
1. UML resource page [Online] Available: http://www.uml.org/.
2. Galapov, A., Nikiforova, O.: UML Diagram Layout: the State of the Art. The Scientific
Journal of Riga Technical University, Series Computer Science – Applied Computer Sys-
tems (2011) (in press).
3. Batini, C., Furlani, L., Nardelly, E.: What is a Good Diagram? A Pragmatic Approach.
Entity-Relationship Approach: The Use of ER Concept in Knowledge Representation,
Proc. of the Fourth International Conference on Entity-Relationship Approach, USA, IEEE
Computer Society and North-Holland (1985) 312–319.
4. Kosak, C., Marks, J., Shieber, S.: Automating the Layout of Network Diagrams with
Specified Visual Organization. IEEE Trans. Systems, Man and Cybernetics 24, 3, (1994)
440–454.
5. Freivalds, K., Kikusts, P.: Optimum Layout Adjustment Supporting Ordering Constraints
in Graph-Like Diagram Drawing. Proc. of the Latvian Academy of Sciences (2001) 43–51.
6. Freivalds, K., Dogrusoz, U., Kikusts, P.: Disconnected Graph Layout and the Polyomino
Packing Approach. Proc. of Graph Drawing 2001, Lecture Notes in Computer Science,
Springer-Verlag, (2002), 378-391.
7. Battista, G., Eades, P., Tamassia, R., Tollis, I.: Graph Drawing: Algorithms for the Visuali-
zation of Graphs. Prentice Hall. (1999).
8. Herman, I., Melan¸con, G., Marshall, M.: Graph visualization and navigation in informa-
tion visualization: A survey. 2000. IEEE Transactions on Visualization and Computer
Graphics (2000) 24–43.
9. Kaufmann, M., Wagner, D.: Drawing Graphs: Methods and Models. LNCS. Berlin, Ger-
many: Springer-Verlag, no. 2025, (2001).
10. Junger, M., Mutzel, P.: Graph Drawing Software. Springer (2003).
11. Eiglsperger, M., Kaufmann M., Siebenhaller, M.: A topology-shape-metrics approach for
the automatic layout of UML class diagrams. Proc. of the 2003 ACM Symposium on Soft-
ware Visualization, ACMPress. (2003) 189–198.
12. Eichelberger, H.: Aesthetics of class diagrams. Proc. of the 1st International Workshop on
Visualizing Software for Understanding and Analysis, IEEE Computer Society Press.
(2002) 23–31.
76

13. Dwyer, T.: Three dimensional UML using force directed layout. Australian Symposium on
Information Visualisation, Australian Computer Society, Inc, (2001) 77–85.
14. Andriyevska, O., Dragan, N., Simoes, B., Maletic, J.: Evaluating UML class diagram lay-
out based on architectural importance. Proc. of the 3rd International Workshop on Visualiz-
ing Software for Understanding and Analysis, IEEE Computer Society Press (2005) 14–19.
15. Gutwenger, C., Junger, M., Klein, K., Kupke, J., Leipert, S., Mutzel, P:. A new approach
for visualizing UML class diagrams. Proc. of the 2003 ACM Symposium on Software
Visualization, ACM Press (2003) 179–188.
16. Sander, G., Vasiliu, A.: The ILOG JViews graph layout module. Proc. of the 9th Interna-
tional Symposium on Graph Drawing, ser. LNCS, vol. 2265. Springer-Verlag (2002) 469–
475.
17. Gansner, E., North, S.: An open graph visualization system and its applications to software
engineering. Software—Practice and Experience, vol. 30, no. 11, (2000) 1203–1234.
18. Sugiyama, K., Tagawa, S., Toda, M.: Methods for visual understanding of hierarchical
system structures. IEEE Transactions on Systems, Man and Cybernetics, vol. 11, no. 2,
(1981) 109–125.
19. Chimani, M., Gutwenger, C., Junger, M., Klein, K., Mutzel, P., Schulz, M.: The Open
Graph Drawing Framework. Poster at the 15th Шnternational Symposium on Graph Draw-
ing (GD07), Sydney (2007).
20. Seemann, J.: Extending the Sugiyama algorithm for drawing UML class diagrams: To-
wards automatic layout of object-oriented software diagrams. Proc. of the 5th International
Symposium on Graph Drawing (GD ’97), ser. LNCS, vol. 1353. Springer (1997) 415–424.
21. Eichelberger, H.: Aesthetics and automatic layout of UML class diagrams. Ph.D. disserta-
tion, Bayerische Julius-Maximilians-Universitat Wurzburg (2005).
22. Fuhrmann, H., Spönemann, M., Matzen, M., von Hanxleden, R.: Automatic layout and
structure-based editing of UML diagrams. Proc. of the 1st Workshop on Model Based En-
gineering for Embedded Systems Design, Dresden (March 2010)
23. Eichelberger H.: Automatic layout of UML use case diagrams. Proc. of the 4th ACM sym-
posium on Software visualization (2008) 105-114.
24. Bist, G., MacKinnon, N., Murphy, S.: Sequence diagram presentation in technical docu-
mentation. Proc. of the 22nd Annual International Conference on Design of Communica-
tion, NewYork, NY, USA, ACMPress (2004) 128–133.
25. Poranen, T., Makinen, E., Nummenmaa, J.: How to draw a sequence diagram. Proc. of the
Eighth Symposium on Programming Languages and Software Tools, SPLST 2003, Univer-
sity of Kuopio, Department of Computer Science, (2003) 91–102.
26. Wong, K., Dabo, S.: On evaluating the layout of UML diagrams for program comprehen-
sion. Software Qual J (2006) 233–259.
27. Prochnow, S., von Hanxleden, R.: Statechart development beyond WYSIWYG. Proc. of
the ACM/IEEE 10th International Conference on Model Driven Engineering Languages
and Systems (MoDELS’07), Nashville, TN, USA (2007).
28. KIELER project, the Kiel Integrated Environment for Layout Eclipse Rich Client [Online]
Available http://www.informatik.uni-kiel.de/rtsys/kieler
29. Fuhrmann, H., von Hanxleden, R.: On the pragmatics of model-based design. Choppy, C.,
Sokolsky, O. (eds.) Foundations of Computer Software. Future Trends and Techniques for
Development. LNCS, vol. 6028, Springer, Heidelberg (2010) 116-140.
30. Eclipse [Online] Available: http://www.eclipse.org/modeling/
31. Purchase, H. C.: Which aesthetic has the greatest effect on human understanding? Proc. of
the 5th International Symposiumon Graph Drawing, Springer-Verlag (1997) 248–261.
32. Purchase, H. C., Allder, J. A., Carrington, D. A.: Graph layout aesthetics in UML dia-
grams: User preferences. Journal of Graph Algorithms and Applications (2002) 255–279.
77

33. Purchase, H. C., McGill, M., Colpoys, L., Carrington, D.: Graph drawing aesthetics and the
comprehension of UML class diagrams: an empirical study. CRPITS 2001: Australian
Symposium on Information Visualisation, Australian Computer Society, (2001) 129–137.
34. Gulbis, I.: Analysis of Model Interchange Standard in the Context of Model Driven Soft-
ware. Master thesis, Riga Technical University (2010).
35. Murdock, J.: Normal forms. [Online] Available: http://www.scholarpedia.org/article/
Normal_forms.
36. Hofman, P., Piasecki, M.: Automatic Improvement of UML Diagrams Layout. (2006).
37. Zuters, J.: Genetic Algorithms and Neuron Nets. [Online] Available http://www.
zuters.com/courses/eanns/annsgenetic.pdf.
78
