
AUTOMATED ORDER-PICKING WORKSTATION HANDLING
OUT-OF-SEQUENCE PRODUCT ARRIVALS
R. Andriansyah, L. F. P. Etman, I. J. B. F. Adan and J. E. Rooda
Department of Mechanical Engineering, Eindhoven University of Technology, Den Dolech 2, Eindhoven, The Netherlands
Keywords:
End-of-aisle, Warehouse, Order-picking, Workstation, Picking policy, Simulation.
Abstract:
A novel design of an automated order-picking workstation processing multiple orders is proposed for a ware-
house with an end-of-aisle order-picking system. A typical problem at this workstation is the out-of-sequence
arrival of products, assuming the workstation receives products for multiple orders simultaneously. As mul-
tiple products are present, the picking sequence at the workstation affects the system throughput. The order
throughput performance of three picking policies is compared under different extents of out-of-sequence ar-
rivals. Experimental results show the capability of the workstation to handle an arbitrary extent of out-of-
sequence arrival of products. Noteworthy insights for design considerations of such systems are drawn.
1 INTRODUCTION
Warehouses nowadays are operating in a more-than-
ever challenging environment. Internet orders are
forcing warehouses to keep greater varieties of SKUs
(Stock Keeping Units) and to deliver low-volume or-
ders more frequently. Moreover, retailers are setting
tighter order delivery schedules, so as to avoid out-
of-stock situations. These challenges combined with
fierce market competition call for a more efficient
order-picking operation. After all, order-picking, the
process of retrieving products from the storage area
to fulfill customer orders, is estimated to account for
55% of the total warehouse operating cost (Tompkins
et al., 2003).
Warehouse automation is becoming a common
practice to respond to these challenges. This can be
seen from the notable growth in sales of automated
material handling systems in recent years (Baker and
Halim, 2007). Different sorts of automated picking
technologies are continuously being introduced to the
market. Each technology is typically designed by
considering factors such as the number of SKUs and
the expected picking volume, among others. A selec-
tion methodology (Dallari et al., 2009) can be used to
determine the most suitable order-picking system for
a given set of warehouse requirements.
The current study focuses on a particular class of
order-picking systems, namely an end-of-aisle order-
picking system. This system is typically composed of
separate processing units including a storage area and
an order-picking workstation, which are connected by
a transportation unit such as a closed-loop conveyor.
Such configuration is capable of processing a signifi-
cantly large number of SKUs.
For such a system it is desirable to process multi-
ple orders at the same time to gain high throughput.
To do so, products for the multiple orders must be re-
trieved simultaneously from the storage area. This,
however, poses a threat to the system performance.
Ideally, products required for the earliest order re-
leased arrive earlier at the workstation than any other
products. However, due to factors such as the num-
ber of storage racks, the composition of SKUs across
the storage racks, and the retrieval time of products,
products may not arrive completely in the same se-
quence as requested by the workstation. This situation
is referred to as out-of-sequence arrivals of products.
Combined with inefficient picking operations at the
workstation, such situation deteriorates the through-
put performance of the order-picking system.
In this paper we study an automated order-picking
workstation that is able to deal with out-of-sequence
arrivals. A novel workstation design with an inte-
grated carrousel mechanism is proposed, where mul-
tiple orders can be processed simultaneously. The de-
sign is capable of handling arbitrary out-of-sequence
arrival distributions. While there are a number of fac-
tors that affect the workstation performance, the focus
of our study is on the picking policy for the proposed
workstation design. We consider three picking poli-
cies and show that a significant gain in throughput can
283
Andriansyah R., F. P. Etman L., J. B. F. Adan I. and E. Rooda J..
AUTOMATED ORDER-PICKING WORKSTATION HANDLING OUT-OF-SEQUENCE PRODUCT ARRIVALS.
DOI: 10.5220/0003599902830292
In Proceedings of 1st International Conference on Simulation and Modeling Methodologies, Technologies and Applications (SIMULTECH-2011), pages
283-292
ISBN: 978-989-8425-78-2
Copyright
c
2011 SCITEPRESS (Science and Technology Publications, Lda.)
be realized by applying a proper picking policy.
The paper is organized as follows. Section 2 elab-
orates the configuration of the order-picking worksta-
tion under study. Section 3 describes the three picking
policies. In Section 4 a number of simulation exper-
iments are performed to see the performance of the
workstation under different settings. Finally, Section
5 concludes the paper.
2 AUTOMATED WORKSTATION
The automated order-picking workstation discussed
in this paper is part of a larger order-picking system,
which typically also comprises of a pallet storage area
and conveyors. In this order-picking system, product
pallets are retrieved from the pallet storage area us-
ing an AS/RS (Automated Storage/Retrieval System).
Each product pallet contains a number of items from
one SKU only. These pallets are transported using
conveyors from the storage area to one of the picking
workstations. At the workstation, items on product
pallets are picked onto order pallets to fulfill orders.
Product pallets that have been processed but still con-
tain some items left are returned to the storage area.
An order pallet corresponds to one order. Multiple or-
ders are present and each order requires a number of
SKUs, which is referred to as the order length.
We require the automated order-picking worksta-
tion to be capable of handling different extents of out-
of-sequence arrivals. This is because the AS/RS at the
storage area is assumed to be the bottleneck of the en-
tire order-picking system. Hence, the AS/RS should
operate at its maximal capacity without taking into ac-
count the issue of out-of-sequence arrivals. The auto-
mated order-picking workstation should therefore be
configured such that it is able to operate even under
a high extent of out-of-sequence arrivals. Further-
more, a well-defined picking policy is required. This
is because products for multiple orders are present
at the workstation. A picking policy prescribes the
sequence in which products should be picked to ful-
fill orders. The desired picking policy is the one that
gives a high order throughput under arbitrary out-of-
sequence arrival distribution.
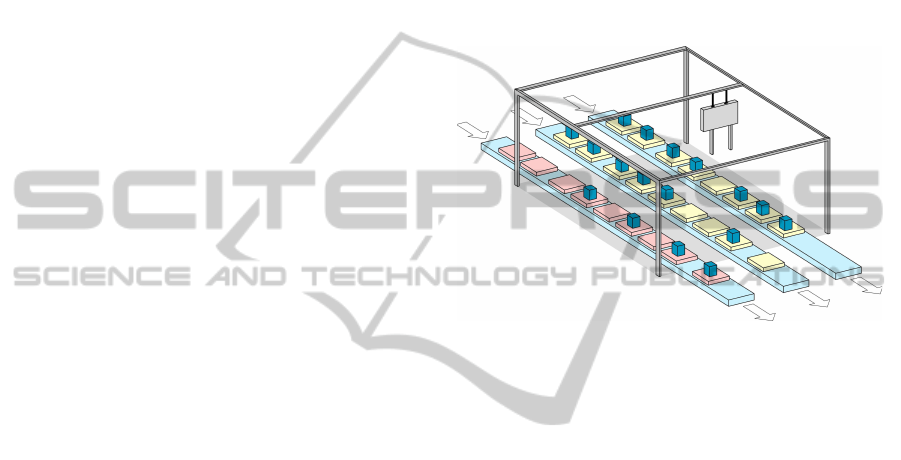
The basic configuration of the automated order-
picking workstation is shown in Figure 1. There are a
number of conveyors that act as buffer lanes. The lay-
out of Figure 1 has one order buffer and two product
buffers. These buffers follow a first-in-first-out prin-
ciple; only pallets located at the head of the buffers
(foremost) can leave the workstation. A robot picks
items from a product pallet and drop them onto the
corresponding order pallet. This robot has a limited
operating area referred to as the pickable area. Only
pallets inside the pickable area are accessible to the
robot. Once picked, a product pallet may leave the
workstation, if possible. An order pallet may only
leave if it already contains all SKUs required by the
order. Once a pallet leaves the workstation, all re-
maining pallets in the same buffer shift one position
forward. It is possible, however, that a picked pallet
cannot leave the workstation because there is another
pallet in front of the picked pallet. The picked pallet
is then referred to as a blocked pallet.
Figure 1: Layout of the automated order-picking worksta-
tion. One buffer lane is used for order pallets (red) and two
buffer lanes are used for product pallets (yellow). The pick-
able area is the area inside the frame. The arrows denote the
direction of pallets movements.
Other issues relevant to this automated order-
picking workstation are the pipeline capacity and sys-
tem deadlock. The pipeline capacity is the maximum
number of pallets that can be simultaneously on the
way to the workstations. It is crucial that the pipeline
is sufficiently filled. This reduces the interarrival time
of product pallets at the workstation, hence provid-
ing the robot with enough work. Furthermore, the
workstation needs an additional mechanism to avoid
deadlock. Due to the out-of-sequence arrivals, sys-
tem deadlock may occur namely when the buffers are
full and the pallets at the heads of all product and
order buffers cannot be picked. A proper design of
such end-of-aisle workstation should therefore take
this eminent problem into account.
A conceptual design of the workstation that avoids
such a deadlock situation is proposed in Figure 2. The
workstation is comprised of four buffers, namely or-
der bufferOP, productbufferPP, recirculated product
buffer rPP, and carrousel buffer cPP. The buffers rPP
and cPP are actually parts of a carrousel. These two
buffers can rotate independently in one direction, al-
lowingproduct pallets to exchangeplaces between the
buffers. The robot can only pick/drop items from/to
pallets within the pickable area, which is depicted by
SIMULTECH 2011 - 1st International Conference on Simulation and Modeling Methodologies, Technologies and
Applications
284
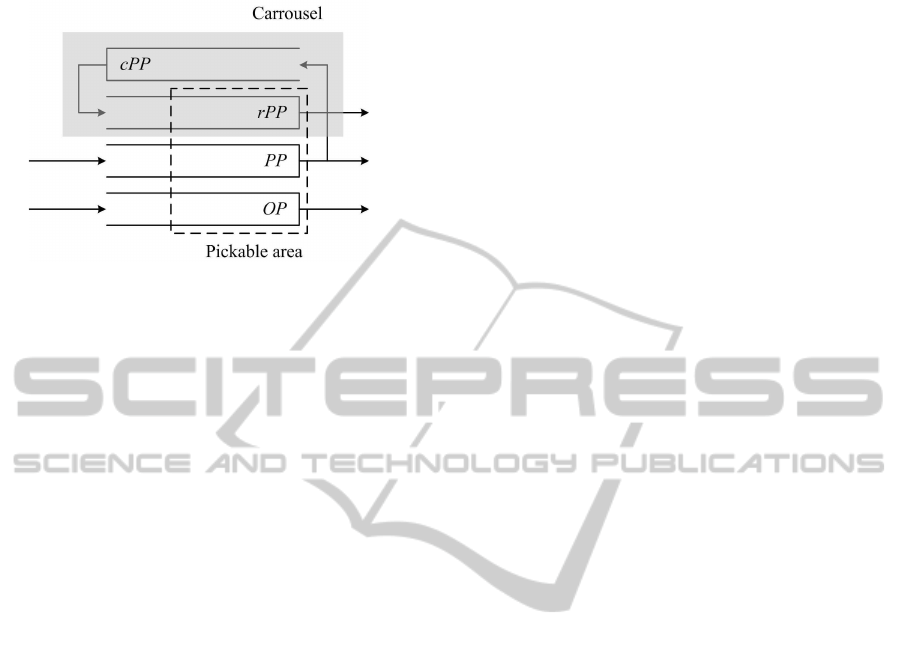
the striped line in Figure 2.
Figure 2: Conceptual design of the automated order-picking
workstation.
The system works as follows. Products retrieved
from the storage area arrive at the product buffer PP.
Each product has an identification number (ID) that is
equal to the ID of the order to which the product be-
longs. The robot then selects a product pallet inside
the pickable area of product buffers PP or rPP, picks
an item from the product pallet, and drops the item
onto the corresponding order pallet in OP. Only prod-
uct pallets with IDs that belong to one of the pickable
orders can be selected as the next pallet to be picked.
A pickable order is an order whose order pallet and
at least one of the corresponding product pallet are
located inside the pickable area.
There are two operations involving the carrousel:
1. Inserting a Product Pallet into the Carrousel.
A product pallet is inserted if no product pallet in
rPP, cPP and inside the pickable area of PP is
required by the order pallets inside the pickable
area of OP. A product pallet is inserted from PP
to the carrousel buffer cPP. This also means that
the product pallet has been recirculated. Subse-
quently, if there is a space available in rPP, the
product pallet is immediately moved from cPP to
rPP.
2. Rotating the Carrousel.
The carrousel is rotated if no product pallet inside
the pickable area of PP and rPP is required by the
order pallets inside the pickable area of OP, but
such a required product pallet is present in cPP
or outside the pickable area of rPP. During the
rotation, one product pallet is moved from rPP to
cPP and one product pallet is moved from cPP to
rPP.
3 PICKING POLICY
The robot in the workstation selects the next prod-
uct pallet to be picked based on a predefined picking
policy. Three picking policies are distinguished as
nearest-to-the-head, nearest neighbor, and dynamic
programming picking policies.
All picking policies use the information about the
product and order pallets inside the pickable area of
product buffers PP, rPP, and order buffer OP. First,
the content of rPP and OP is evaluated. If there is
a product pallet that can be picked in rPP, then the
robot picks an item from the product pallet and put
it into its corresponding order pallet in OP. Other-
wise, the content of PP and OP is evaluated. Sim-
ilarly, if there is a product pallet that can be picked
in PP, then the robot picks an item from the product
pallet and put it into its corresponding order pallet in
OP. That is, priority is given to picking a product pal-
let from rPP. In case no product pallet can be picked
from both rPP and PP, one of the two carrousel oper-
ations is performed. The following section elaborates
for each policy the criteria used for selecting the prod-
uct pallets to be picked.
3.1 Nearest-to-the-Head
The nearest-to-the-head picking policy aims at an un-
interrupted flow of product pallets at the workstation.
Recall that a product pallet can only leave the work-
station once it has been picked and is located at the
head of the product buffer. Once a product pallet
leaves, all remaining product pallets in the buffer shift
one position forward and a new product pallet can
enter the workstation. Therefore, giving priority to
picking the product pallet located at the head of the
product buffer supports a continuous flow of product
pallets at the workstation.
The nearest-to-the-head picking policy requires
the robot to pick the product pallets according to their
sequence in the buffer. It evaluates first whether the
product pallet at the head of the product buffer can be
picked. If this is not possible, then the product pallet
located at the second position in the buffer is evalu-
ated next. This evaluation is performed continuously
until either a pickable order is found or the end of the
pickable area is reached.
3.2 Nearest Neighbor
One of the most serious pitfalls of the nearest-to-the-
head picking policy is that it may cause the robot to
travel without carrying any item from the current po-
sition of the robot to the head of the product buffer.
AUTOMATED ORDER-PICKING WORKSTATION HANDLING OUT-OF-SEQUENCE PRODUCT ARRIVALS
285

Such travel consumes time, but is a non-value-added
process; it is thus detrimental to the order through-
put of the workstation. The nearest neighbor picking
policy is proposed, which minimizes the distance in
which the robot travels without carrying any item.
The nearest neighbor picking policy requires the
robot to pick the product pallet located nearest to the
current position of the robot. If there is more than one
pickable order with the same distance to the robot,
then the robot picks the pallet that is located closer to
the head of the buffer.
3.3 Dynamic Programming
Given an unlimited supply of product and order pal-
lets at the workstation, the order throughput of the
workstation depends on the robot processing time; a
lower processing time leads to a higher throughput.
The robot processing time consists of a travel time,
pick time, and drop time. Assuming a relatively con-
stant pick and drop time, one can increase the work-
station throughput by reducing the travel time, which
is a function of the robot travel distance.
The dynamic programming policy constructs a
picking trip that minimizes the robot travel distance
based on the current content of product and order
buffers. The robot then picks a number of orders in
a sequence as indicated in the picking trip. Once a
product or an order pallet leaves the workstation, the
buffer content changes. In this case, a new picking
trip is constructed using the dynamic programming
approach based on the new content of the product and
order buffers.
The robot travel distance depends on the sequence
of picking a number of orders. When picking one
order, the robot travels from its current position to
a product pallet (picking an item) and finally to the
corresponding order pallet (dropping the item). Fol-
lowing a picking process, the robot thus always starts
a new picking process from the location of the previ-
ously served order pallet.
A dynamic programming policy is formulated to
minimize travel distance D to reduce the travel time
and consequentlyto increase the workstation through-
put, where:
D =
m
∑
i=1
(|y
i−1
− x
i
| + |x
i
− y
i
|), (1)
where:
x
i
= position of product pallet of the order picked
at the ith step.
y
i
= position of order pallet of the order picked
at the ith step.
y
0
= current position of the robot.
In the above formulation, m is the number of orders
picked within a picking trip, which is referred to as
the trip length. Note that travel distance D increases
with trip length m. Therefore, the optimal trip is the
one that minimizes travel distance D per order, so the
one minimizing D/m.
The first step in constructing a picking trip that
minimizes travel distance D is evaluating the pallets
contained in the product and order buffers. Recall that
each product pallet has an identification number rep-
resented by the ID of the order to which the product
belongs. Let
P be the set of IDs of product pallets within the
pickable area
Q be the set of IDs of order pallets within the
pickable area
Then R = P ∩ Q gives the IDs of pickable orders.
These are the orders whose product and order pallets
are both located inside the pickable area. Let S ⊆ R
be the IDs of target orders. These are the pickable or-
ders whose product and/or order pallets are located at
the head of the buffer. A target order is the last order
to be picked in a picking trip because picking a target
order causes a product and/or an order pallet to leave
the workstation. With this regard, x
m
and y
m
in (1) are
the positions of the product pallet and the order pallet
for the target order, respectively. Picking a target or-
der leads to a new content of either a product buffer
or the order buffer, or both. Hence, a new picking trip
needs to be constructed.
Having a target order is a requirement for con-
structing a picking trip. Recall that there are two prod-
uct buffers namely rPP and PP evaluated against the
order buffer OP. If both rPP and PP contain at least
one target order, then a picking trip is constructed
from rPP. That is, rPP has priority over PP. If only
one product buffercontains a target order, then a pick-
ing trip is constructed from that product buffer. Oth-
erwise, if none of the two product buffers contains a
target order, then one of the two carrousel operations
explained previously is performed.
Figure 3 shows an example of the content of
product buffer PP and order buffer OP. Assume
now that product buffer rPP does not contain a tar-
get pallet and therefore is disregarded from the fig-
ure. Based on this figure, P = {11,12,14, 15,18},
Q = {11,12,13, 14,15}, R = {11, 12,14,15},and S =
{11}.
Constructing a picking trip can be regarded as a
Traveling Salesman Problem (TSP). That is, given
trip length m, pickable orders R, target orders S, and
current position of robot y
0
, determine the sequence
of picking m pickable orders involving one and only
one s ∈ S, which starts at y
0
and ends at s such that D
SIMULTECH 2011 - 1st International Conference on Simulation and Modeling Methodologies, Technologies and
Applications
286
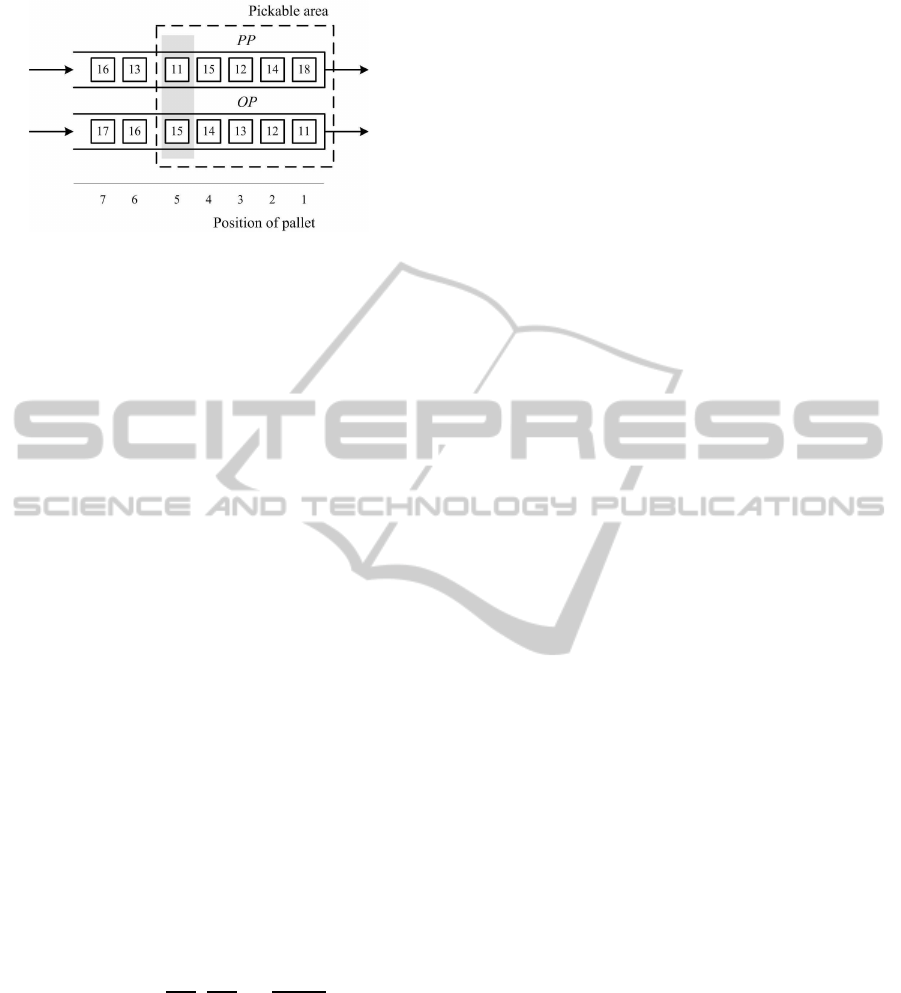
Figure 3: An example of the content of product (PP) and
order (OP) buffers. The numbers represent the IDs of pal-
lets. A product pallet at PP belongs to an order pallet at OP
with the same ID. The robot is currently at position 5.
as given in Equation (1) is minimized.
Note that given R there are many TSPs of length m
that contain one s ∈ S. Each TSP has to be separately
solved. That is, for m = 1,...,m
max
the TSPs of length
m are generated, and subsequently solved. Herein, the
maximum trip length m
max
follows from the number
of elements in R excluding S and subsequently adding
one element of S in the trip. Hence, the maximum trip
length is m
max
= |R|−|S|+1, where |R| and |S| denote
the number of orders in R and S, respectively.
In the example of Figure 3 where R =
{11, 12,14,15} and S = {11}, the maximum trip
length is 4, resulting in eight TSPs that contain one
s ∈ S, each of which is a subset of R, namely for
m = 1: {11}; for m = 2: {11,12}, {11,14}, {11,15};
for m = 3: {11,12,14}, {11,12,15}, {11,14,15}; and
for m = 4: {11,12,14,15}. The number of TSPs in-
creases exponentially with the number of pickable or-
ders. With |R| = 10 and |S| = 1, as many as 512 TSPs
need to be solved.
The optimal picking trip given R, S, and y
0
is the
one that minimizes travel distance per order, i.e., the
one minimizing D/m. Let r
∗
m
be the picking trip min-
imizing the travel distance D from all TSP of length
m as a subset of R. Let D
r
∗
m
be the resulting travel
distance for r
∗
m
. The optimal picking trip is
r
∗
= argmin{
D
r
∗
1
1
,
D
r
∗
2
2
,...,
D
r
∗
m
max
m
max
}. (2)
We use dynamic programming for TSP (Bellman,
1962) to solve each TSP. With dynamic programming,
a TSP is handled in smaller parts by solving sub-
problems sequentially. The solutions to these sub-
problems are then stored for future use. Larger sub-
problems are solved by a recursion formula from the
smaller subproblems. The complete solution for the
TSP is obtained through backtracking the solutions
of the subproblems. Note that there are a number
of TSP heuristics other than dynamic programming
available in the literature. For a review of the perfor-
mance of various TSP heuristics we refer to (Johnson,
1990). A description of the dynamic programming
for TSP is provided in the Appendix. For the exam-
ple in Figure 3, the optimal picking trip is found to be
y
0
→ 12 → 14 → 15 → 11.
4 SIMULATION EXPERIMENTS
We investigate the performance of the automated
order-picking workstation under all three picking
policies for single and multiple products per order.
The performance measures of interest is the order
throughput. A method to model the out-of-sequence
arrival of products is proposed.
4.1 Modeling Out-of-Sequence Arrivals
An example of out-of-sequence arrival of product pal-
lets at the workstation can also be seen from Figure 3.
In this example we assume that each order pallet in
buffer OP requires one product (that is, order length
k = 1). Each order pallet has an ID, where lower IDs
represent orders that are released earlier. A product
pallet in PP with the same ID as an order pallet in OP
means that the product pallet is required for the order
pallet. Ideally, product pallets arrive in the same se-
quence as the order pallets, namely products for older
orders arrive first. However, products arrive out-of-
sequence, where e.g., product pallet 18 arrived earlier
than the product pallets for orders 11,12,...,17. That
is, product pallet 18 overtakes seven product pallets.
The number of overtaken products is calculated for
each incoming product pallet. This gives an overtak-
ing distribution that characterizes the out-of-sequence
arrival of products.
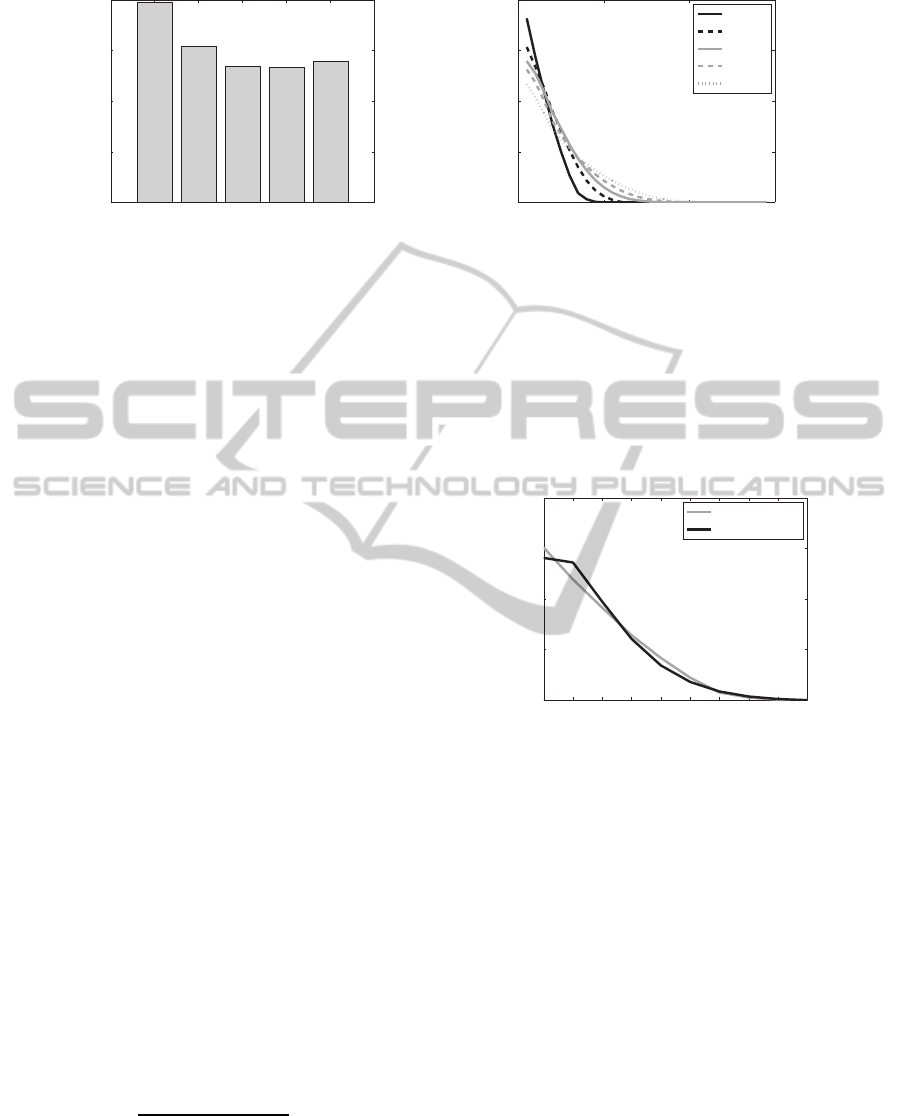
An overtaking distribution is obtained by measur-
ing the overtaking from a detailed simulation model
of an AS/RS. The AS/RS system consisted of five
storage racks from which products were retrieved. A
total of 10,000 SKUs were contained in the storage
racks; each SKU was contained only on one prod-
uct pallet. This setting represents a warehouse that
serves slow moving products. The cranes of the stor-
age racks had a retrieval batch size of four pallets.
That is, the cranes wait until there is a retrieval com-
mand for four SKUs before it starts retrieving the
SKUs. The maximal pipeline capacity is N product
pallets. These are the product pallets that have been
retrieved by the AS/RS and are on their way to (but
have not entered) the workstation buffer. Figure 4
shows the overtaking distributions measured from the
AUTOMATED ORDER-PICKING WORKSTATION HANDLING OUT-OF-SEQUENCE PRODUCT ARRIVALS
287
10 15 20 25 30
0
0.1
0.2
0.3
0.4
N
p(X=0)
(a) Probability of no overtaking.
0 10 20 30
0
0.05
0.1
0.15
0.2
x
p(X = x | x > 0)
N = 10
N = 15
N = 20
N = 25
N = 30
(b) Probability of overtaking x products.
Figure 4: Measured overtaking distribution from a detailed simulation model.
detailed simulation model for different pipeline ca-
pacities N = {10, 15,20,25,30}.
We used Figure 4(b) as inspiration to develop an
analytical function to represent the overtaking. Let
random variable X be the number of overtaken prod-
ucts, which can take a value of {0,1,2,3, ..., N − 1}.
Let
P(X > 0) = p,
P(X = 0) = 1− p.
(3)
Here, P(X = 0) is the probability that a certain prod-
uct does not overtake other products. In the case of
overtaking (X > 0) the possible number of overtaken
products is {1, 2,3,...,N − 1}. To obtain a shape of
the overtaking distribution similar to Figure 4, we de-
termine the probability of overtaking x products as:
P(X = x | x ∈ Y) = f(x) = (ax+ b) xe
−cx
, (4)
where Y = {1, 2, 3,...,N − 1}. There are three param-
eters in the function, namely a,b, and c. The values
of a and b are calculated given c. Since the maximal
number of overtaken products is N − 1, it is known
that:
P(X = N) = (aN + b) Ne
−cN
= 0. (5)
Furthermore, the sum of all probabilities of overtaken
products is equal to 1. That is:
N
∑
x=1
f(x) = 1. (6)
From (5) and applying (5) in (6), we obtain:
b = −aN.
a =
1
∑
N
x=1
(x− N) xe
−cx
.
Hence, parameters p and c determine the overtaking
distribution given by (3) and (4).
To illustrate the proposed overtaking distribution,
we have fitted function (4) to data measured from the
detailed simulation model. The value of parameter
c, also referred to as the shape parameter, is deter-
mined using the nonlinear regression fitting method
in Matlab. Figure 5 shows the comparison of overtak-
ing from simulation data and from the fitted function
for N = 10.
1 2 3 4 5 6 7 8 9 10
0
0.1
0.2
0.3
0.4
x
p(X = x | x > 0)
simulation
fitted function
Figure 5: Comparison of overtaking from a detailed simu-
lation and from the fitted overtaking function.
The shape parameter c can be changed for ex-
perimental purposes. Figure 6 shows several shapes
of the overtaking distribution given various c values
for N = 10. In general, larger c leads to smaller
mean number of overtaken products, given that there
is overtaking. By using different settings for overtak-
ing probability p and shape parameter c, we are able
to analyze the performance of the automated order-
picking workstation under different extents of out-of-
sequence product arrivals.
4.2 Assumptions and Settings
The following assumptions apply to all simulation ex-
periments. The product buffer, the recirculated prod-
uct buffer, and the order pallet buffer have a finite ca-
pacity of 10 pallets. A new product pallet is gener-
ated into the product buffer as soon as a space in the
SIMULTECH 2011 - 1st International Conference on Simulation and Modeling Methodologies, Technologies and
Applications
288
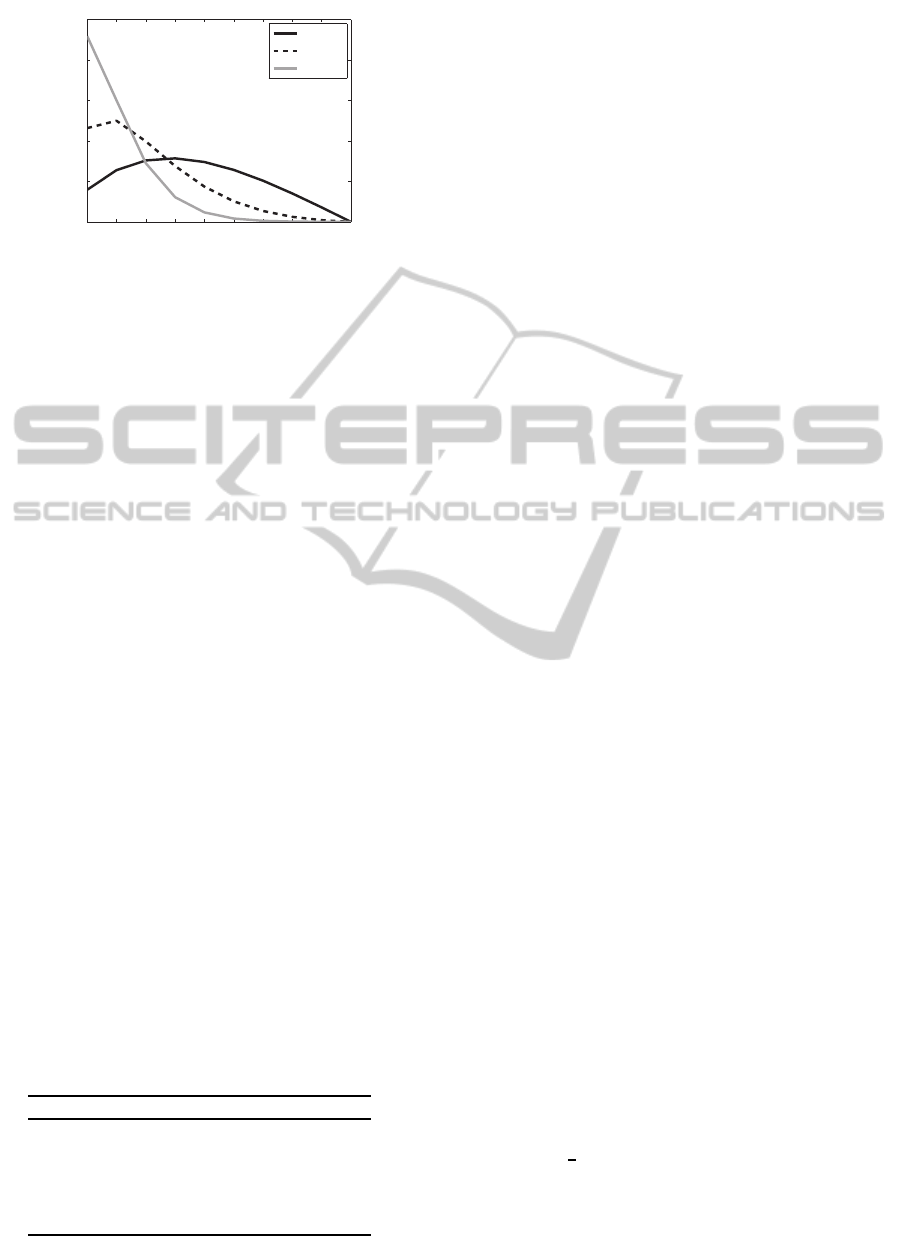
1 2 3 4 5 6 7 8 9 10
0
0.1
0.2
0.3
0.4
0.5
x
p(X = x | x > 0)
c = 0.1
c = 0.5
c = 1.0
Figure 6: Comparison of overtaking distributions with dif-
ferent values of shape parameter c.
buffer becomes available. That is, there is no interar-
rival time involved in generating a new product pallet.
The processing time of the robot is comprised of pick
time, travel time, and drop time. The travel time de-
pends on the travel distance D (in pallets) that covers
the cycle: current position - product pallet - order pal-
let. We assume that the robot requires 0.25 seconds
to travel a distance of 1 pallet measured in horizontal
direction only. That is, the movement from product
to order pallet and vice versa is performed during the
horizontal movement. The pick and drop time is as-
sumed to be constant at 2 seconds each. Hence, the
processing time t
e
of the robot is (in seconds)
t
e
= 0.25 D+ 4. (7)
It is assumed that rotating the carrousel costs 2 sec-
onds per rotation and that shifting the pallets forward
in the buffer take place while the robot is traveling.
Table 1 gives a list of parameters that are used in
the experiments. Overtaking probability p and over-
taking shape parameter c are used to create an over-
taking distribution (see Section 4.1), representing the
out-of-sequence arrivals of products. Order length k
represents the number of SKUs required for an or-
der, which equals to the number of required product
pallets given that a product pallet contains one SKU
only. The maximum number of product pallets that
are on their way to the workstation simultaneously is
denoted by N, which is the pipeline capacity. The size
of pickable area L gives the number of pallets that are
within reach of the robot.
Table 1: List of parameters.
Parameter Notation
Overtaking probability p
Overtaking shape parameter c
Order length k
Size of pickable area L
Pipeline capacity N
All simulation experiments have been performed
using process algebra based discrete-event simulation
language χ (Chi) 1.0. We refer to (Hofkamp and
Rooda, 2008) for a definition of this language. A tu-
torial of the language is provided by (Rooda and Ver-
voort, 2007).
The following setup is used for all experiments.
Each experiment consists of 50 simulation runs ex-
cluding a warm-up period of 30,000 time units.
This warm up period was determined using Welch’s
method (Welch, 1983) based on the combination of
parameters that leads to the highest overtaking con-
sidered, namely p = 0.8, c = 0.1, k = 1, L = 1, and
N = 30. The resulting warm-up period is then used for
all experimental settings. A simulation run is termi-
nated after 100,000 product pallets have been picked.
Out-of-sequence arrivals are generated in the sim-
ulation model as follows. A generator of product
pallet holds a list of product pallets to be generated
for orders in order buffer OP. For example, the list
[11,12, 13,14, 15,16,17] contains 7 product pallets
each for a different order as denoted by the ID num-
bers. Each time a product pallet is generated, it is
determined whether or not the new product pallet will
overtake other product pallets based on the value of
parameter p. In case of overtaking, the number of
overtaken pallet x is sampled. Subsequently, the first
x product pallets in the list is skipped and the product
pallet at position x + 1 in the list is generated. In the
previous list example, if x = 2 then product pallet 13
is generated. The updated list excludes this pallet.
4.3 Experimental Results
4.3.1 Single Product per Order
First, we consider the case where each order consists
of exactly one product (k = 1) and the pipeline ca-
pacity N = 10. Only one item is required from each
product pallet. The effect of the overtaking distribu-
tion on the order throughput is investigated. The size
of pickable area L = 10. Figure 7 depicts the order
throughput of the workstation as a function of over-
taking shape parameter c given overtaking probability
p = {0.2,0.5, 0.8}. Note that the straight line in this
figure is the maximal order throughput without out-
of-sequence arrival (p = 0.0). In this case, the robot
stays at the head of the buffer causing the travel dis-
tance to become zero. Thus, the maximal throughput
is constant at
1
4
× 3600 orders/hr = 900 orders/hr.
The nearest-to-the-head picking policy performs
well only when the product pallets arrive relatively
in a good sequence, that is, with a low probability of
overtaking. As products arrive more out-of-sequence,
AUTOMATED ORDER-PICKING WORKSTATION HANDLING OUT-OF-SEQUENCE PRODUCT ARRIVALS
289
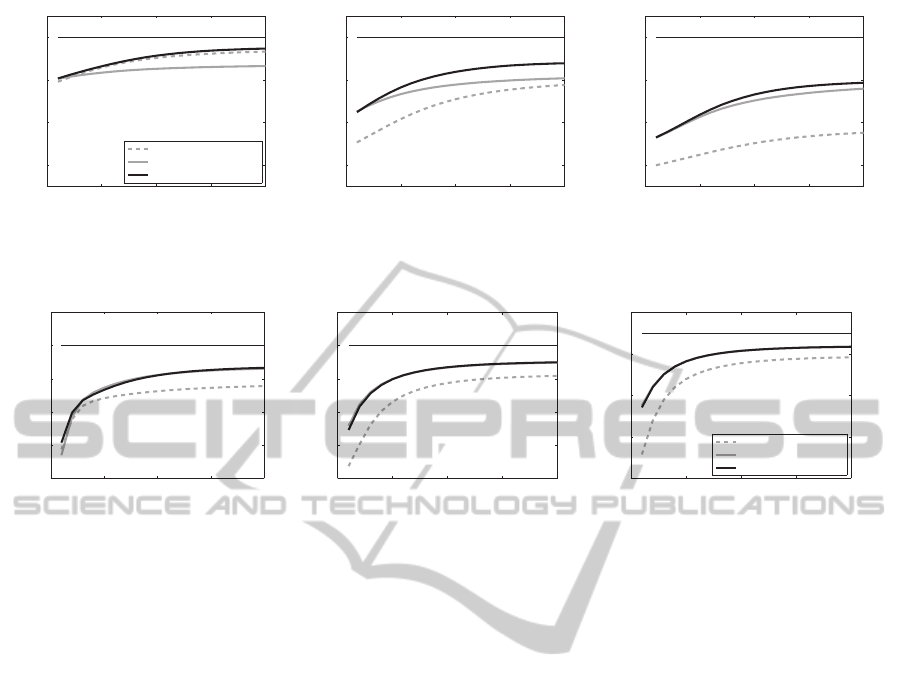
0 0.5 1 1.5 2
600
700
800
900
c
Throughput [orders/hr]
nearest−to−the−head
nearest neighbor
dynamic programming
(a) p = 0.2.
0 0.5 1 1.5 2
600
700
800
900
c
Throughput [orders/hr]
(b) p = 0.5.
0 0.5 1 1.5 2
600
700
800
900
c
Throughput [orders/hr]
(c) p = 0.8.
Figure 7: Order throughput for k = 1, L = 10, N = 10.
0 0.5 1 1.5 2
250
300
350
400
450
500
c
Throughput [orders/hr]
(a) k = 2.
0 0.5 1 1.5 2
70
75
80
85
90
95
c
Throughput [orders/hr]
(b) k = 10.
0 0.5 1 1.5 2
38
40
42
44
46
c
Throughput [orders/hr]
nearest−to−the−head
nearest neighbor
dynamic programming
(c) k = 20.
Figure 8: Order throughput for variable order length k, p = 0.8, L = 5, N = 30.
the performance of the nearest-to-the-head picking
policy deteriorates compared to the other policies.
With high overtaking, the resulting order throughput
from the nearest-to-the-head policy may even be 17%
lower than that of the dynamic programming policy.
The reason is that with high overtaking, the nearest-
to-the-head policy requires the robot to return to the
first position in the buffer after picking. This return
trip is performed without picking any other product
pallets. Hence, the extra traveling without picking de-
teriorates order throughput. However, when products
arrive at the buffer in a good sequence, most picking
under nearest-to-the-head picking policy takes place
at the foremost position in the buffer. No extra travel-
ing occurs, which results in a high order throughput.
Contrary to the nearest-to-the-head policy, the
nearest neighbor policy performs better at a high ex-
tent of out-of-sequence arrivals. This policy pre-
vents the robot to travel empty by picking whichever
product pallet nearest to the current location of the
robot. Such way of working is advantageous partic-
ularly when products and orders are not sequenced
neatly in the buffer. However, with low overtaking
it may happen that the robot skips the product pal-
let at the foremost position of the product buffer and
picks the product pallets in the rest of the buffer. The
robot eventually returns to the foremost position of
the product buffer. This return trip is performed with-
out picking, causing extra traveling that deteriorates
order throughput.
The dynamic programming policy perform supe-
rior to the nearest-to-the-head and nearest neighbor
policies. In general, the added value of the dynamic
programming policy is larger at high overtaking. An
optimal picking trip that minimizes the robot travel
distance results in a high throughput under arbitrary
extent of out-of-sequence arrivals.
Figure 7 also shows the effect of out-of-sequence
arrivals. This can be seen by comparing the straight
line (the maximal throughput when all pallets arrive
in a good sequence) with the other lines in the fig-
ure. When 20% of all product pallets arrive out-of-
sequence (Figure 7(a)), the decline in order through-
put may already reach 11%. It is therefore beneficial
to have a mechanism at the AS/RS that prevents out-
of-sequence arrivals of products at the workstation.
However, considering that the AS/RS is typically the
bottleneck of the order-picking system, such mecha-
nism should not compromise AS/RS throughput.
4.3.2 Multiple Products per Order
Now we assume that each order requires more than
one product. Multiple product pallets are needed for
an order, but each product pallet is only picked once
(one item per product). As a worst-case scenario we
study the system performance under high overtaking
p = 0.8 with a large pipeline capacity N = 30.
SIMULTECH 2011 - 1st International Conference on Simulation and Modeling Methodologies, Technologies and
Applications
290
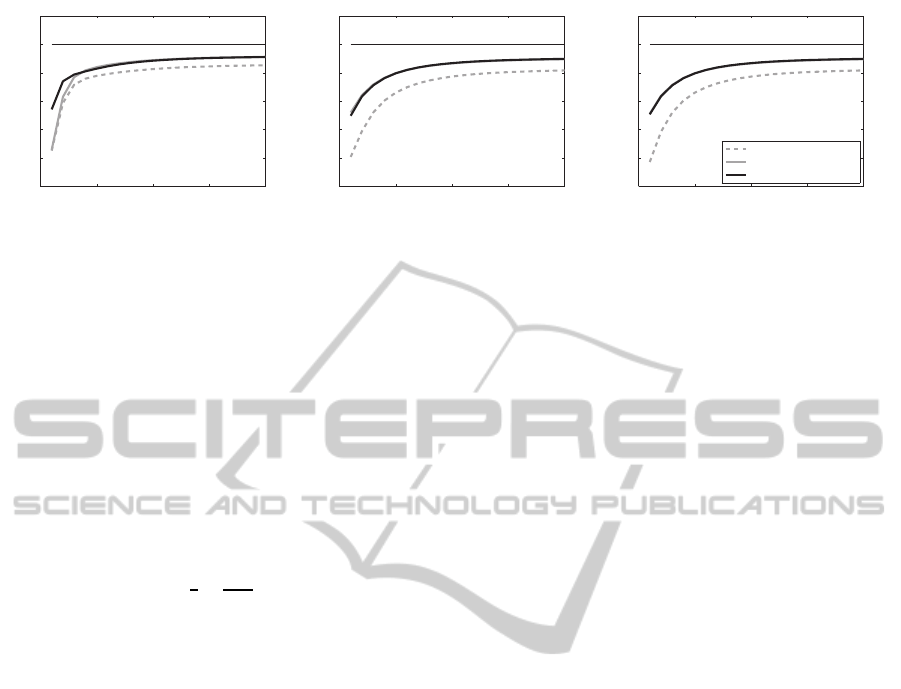
0 0.5 1 1.5 2
65
70
75
80
85
90
95
c
Throughput [orders/hr]
(a) L = 2.
0 0.5 1 1.5 2
65
70
75
80
85
90
95
c
Throughput [orders/hr]
(b) L = 6.
0 0.5 1 1.5 2
65
70
75
80
85
90
95
c
Throughput [orders/hr]
nearest−to−the−head
nearest neighbor
dynamic programming
(c) L = 10.
Figure 9: Order throughput for variable pickable area size L, p = 0.8, k = 10, N = 30.
Figure 8 shows the resulting order throughput
when the order lengths are fixed at k = {2,10,20} for
all three policies. The dynamic programming pick-
ing policy consistently gives a high order through-
put, which is not the case for the other two policies.
This is also true given different sizes of pickable area
L = {2,6,10}, as depicted in Figure 9. That is, the
dynamic programming policy is robust to the order
length and the pickable area size. Note that in Fig-
ures 8 and 9 the straight lines give the maximal or-
der throughput when all product pallets arrive in a
good sequence (p = 0.0). In this case, the maximal
throughput is constant at
1
4
×
3600
k
orders/hr.
5 CONCLUSIONS
The performance of a novel conceptual design for an
automated order-picking workstation processing mul-
tiple orders has been studied. We highlighted the typ-
ical problem of out-of-sequence arrival of products at
the workstation. This has been modeled using a so-
called overtaking function. Furthermore, three pick-
ing policies have been evaluated. The picking policy
based on dynamic programming gives the highest or-
der throughput. Therefore, the use of dynamic pro-
gramming picking policy in such a workstation is ad-
vocated.
The conceptual design of the workstation includes
a carrousel. This is actually a built-in solution of the
workstation to overcome deadlock situation due to the
out-of-sequence arrival of products. Having this car-
rousel, we do not require products to be delivered
in a good sequence, nor do we require a sequencer
(e.g., vertical buffer) in front of the workstation to re-
arrange product arrivals at the workstation. Such an
extra hardware is typically expensive.
The proposed overtaking function is a simple
function that requires only two parameters. This func-
tion is capable of modeling different extents of out-
of-sequence arrivals. Such a function is practical for
performance evaluation when factors influencing out-
of-sequence arrivals change.
A significant improvement in throughput can be
gained by applying a smart picking policy at the
workstation processing multiple orders. This is par-
ticularly the case when the number of pickable orders
in the buffer at any time is large and there is a high
extent of out-of-sequence arrival of products. Experi-
mental results showed that the dynamic programming
policy, which strives to minimize the travel distance
of the robot during a sequence of picking, perform
well under low, medium, and high extent of out-of-
sequence arrivals.
ACKNOWLEDGEMENTS
This work has been carried out as part of the FAL-
CON project under the responsibility of the Embed-
ded Systems Institute with Vanderlande Industries as
the carrying industrial partner. This project is par-
tially supported by the Netherlands Ministry of Eco-
nomic Affairs under the Embedded Systems Institute
(BSIK03021) program.
REFERENCES
Baker, P. and Halim, Z. (2007). An exploration of ware-
house automation implementations: cost, service and
flexibility issues. Supply Chain Management: An In-
ternational Journal, 12.
Bellman, R. (1962). Dynamic programming treatment of
the travelling salesman problem. Journal of the ACM,
9(1):61–63.
Dallari, F., Marchet, G., and Melacini, M. (2009). Design
of order picking system. International Journal of Ad-
vanced Manufacturing Technology, 42(1-2):1–12.
Hofkamp, A. T. and Rooda, J. E. (2008). Chi 1.0 reference
manual. Systems Engineering Report 2008-04, Eind-
hoven University of Technology, Eindhoven.
AUTOMATED ORDER-PICKING WORKSTATION HANDLING OUT-OF-SEQUENCE PRODUCT ARRIVALS
291

Johnson, D. S. (1990). Local optimization and the traveling
salesman problem. In Automata, Languages and Pro-
gramming, volume 443 of Lecture Notes in Computer
Science, pages 446–461. Springer Berlin / Heidelberg.
Rooda, J. E. and Vervoort, J. (2007). Analysis of Manufac-
turing Systems. Eindhoven University of Technology,
Eindhoven.
Tompkins, J. A., White, J. A., Bozer, Y. A., Frazelle, E. H.,
and Tanchoco, J. M. A. (2003). Facilities Planning.
John Wiley and Sons, New Jersey, 2 edition.
Welch, P. (1983). The statistical analysis of simulation re-
sults. In Computer Performance Modeling Handbook.
Academic Press.
APPENDIX
Dynamic Programming for TSP
Let R be the set of pickable orders, S ⊆ R denotes
set of target orders. These are pickable orders whose
product and/or order pallets are located at the head of
the buffer. Let U be a subset of R containing m or-
ders and one s ∈ S; this is a TSP of length m. The
robot initial position is y
0
. A distance matrix is con-
structed based on the position of product and order
pallets whose IDs are contained in U. Distance d
ij
is
the distance traveled by the robot when picking one
order, and is defined as
d
ij
= |y
i
− x
j
| + |x
j
− y
j
| (8)
for any i, j ∈ U and i 6= s, where:
x
i
= position of product pallet with ID i
y
i
= position of order pallet with ID i
This formulation covers the distance from the pre-
vious order pallet i (current robot position) to the cur-
rent product pallet j (pick item) and finally to the cur-
rent order pallet j (drop item; new robot position).
Additionally, we set an artificial distance d
sj
> 2× L,
where L is the size of the pickable area. This way, we
prevent target order s to be picked in the middle of
the picking trip and ensure that the target order is the
last order picked in the picking trip. The following
recursion is used to solve U, a TSP of length m.
1 For all i ∈ U:
2 g(i,
/
0) = 0
3 For n = 1 to m− 1:
4 For all subsets V ⊆ U containing n orders:
5 For all i /∈ V and i ∈ U:
6 g(i,V) = min
j∈V
{d
ij
+ g( j,V \ { j})}
where:
g(i,V) = the shortest total distance for picking all or-
ders in V starting from order i.
Once g(i,V) is obtained, p(i,V) is determined as
the first order to pick after picking order i that gives
g(i,V).
Finally, the optimal picking trip r
m
given m orders
in U requires a travel distance of:
D
r
m
= g(y
0
,U) = min
j∈U
{d
y
0
j
+ g( j,U \ { j})} (9)
The minimum travel distance is the distance from the
current robot position plus the shortest total distance
for picking all orders in U starting from order j.
The optimal picking trip D
r
m
for set U is ob-
tained from sequencing the values of p. The first
order to be picked from the current robot position
y
0
is p(y
0
,U) = k
1
. This order k
1
is actually or-
der j that gives D
r
m
in (9). The second order to be
picked is p(y
0
,U \ {k
1
}) = k
2
, where U \ {k
1
} con-
tains m − 1 orders. The third order to be picked is
p(y
0
,U \ {k
1
,k
2
}) = k
3
, where U \ {k
1
,k
2
} contains
m − 2 orders. This way of working is continued un-
til a picking trip r
m
= {k
1
,k
2
,k
3
,...,s} has been con-
structed, which gives the sequence of order picking
for the robot.
The recursion is only used for solving a TSP with
length m > 1, that is, U ⊆ R and |U| > 1. For m = 1
the solution is picking target order s ∈ U.
Note that the above description of dynamic pro-
gramming is based on the assumption that each or-
der requires exactly one product. In this case, each
product pallet is uniquely identified by the order ID
to which the product belongs. If an order consists of
multiple products, each product pallet can be identi-
fied uniquely by the order ID and the position of each
product pallet for that order at the buffer.
SIMULTECH 2011 - 1st International Conference on Simulation and Modeling Methodologies, Technologies and
Applications
292
