
THE RESEARCH OF PAPER REVERSE LOGISTIC NETWORK
OPTIMIZATION ON THE LOW-CARBON ECONOMY
Wu Rongxu, Ru Yihong, Wu Shengna
Beijing Jiatong University, Beijing, China
Su Chang
Beijing Jiatong University, Beijing, China
Keywords: Low-carbon economy, Reverse logistics, Network optimization, Paper reverse, Carbon emission.
Abstract: As the contradiction between natural resources and economic development become more and more serious,
people in the 21
st
century is facing a new revolution of the method of the economic development, with low
fuel consumption, low recourse consumption, low gas emission, and low environmental pollution, low-
carbon economy is a new choice for the future economic development. This paper firstly introduces the
current study status of low-carbon economy and reverse logistics network, then by taking the paper reverse
industry as an example, defines the mathematic relationship between reverse logistic network optimization
with the help of the relationship between paper and tree, and finally demonstrate the feasibility in the
combination of the low-carbon economy and reverse logistics network, making a model that maximizes the
benefits and minimizes the carbon emission. This paper provides a valuable reference for the subsequent
research.
1 CURRENT STATUS OF THE
STUDY
As low-carbon economy is on the rise globally,
many scholars made attribution to the study within
related fields. Currently low-carbon economic
researches have mainly focused on the macroscopic
policy and transition of renewable energy resources.
The research of reverse logistic network is also
wide, most of which analyze from the theoretical
view, including the mode, decisional problem and
network construction of the reverse logistics to
resolve the problem about location and transport
routes.
2 APER REVERSE LOGISTICS
NETWORK
Under the new social situation reverse logistics
network planning should meet the higher demands,
especially the paper recycling network which cost a
large amount of waste the resource .This research
has been carried out in the area of reverse logistics
of the paper recycling industry. Paper reverse
logistics network belongs to recycling reverse
logistics. Our national waste paper recycling
network is now inefficient. There are some cross
exist among main body of every level in the
network, and the waste paper recovery is fragmented
and complex.
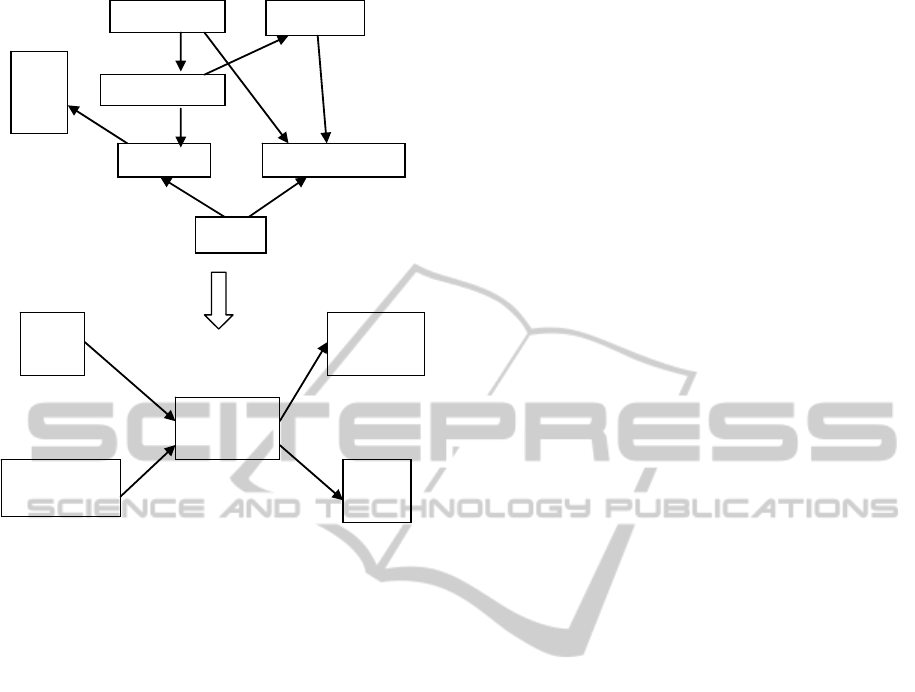
This article is based on the existing problems in
the waste paper recycling system and the reverse
network. Simplification of the network is on the
table. The primary level is consists of scattered
customers and trash treatment plants. The second
level contains waste pretreatment plants waste
recycling companies. The third includes the Second-
handed market and Paper Mill. The network of three
levels is as below:
336
Rongxu W., Yihong R., Shengna W. and Chang S..
THE RESEARCH OF PAPER REVERSE LOGISTIC NETWORK OPTIMIZATION ON THE LOW-CARBON ECONOMY.
DOI: 10.5220/0003604403360340
In Proceedings of the 13th International Conference on Enterprise Information Systems (BIS-2011), pages 336-340
ISBN: 978-989-8425-54-6
Copyright
c
2011 SCITEPRESS (Science and Technology Publications, Lda.)
Garbage
Wastetransfer
Paperdisposal
Waste
disposa
l
plant
custome
Wasterecycling
Recycling
k
Customer
Wastedisposal
plants
Reprocessed
center
Secondary
market
Paper
mill
Figure 1: Paper reverse network.
The network set rules about specifications and
responsibilities of each main body while more
attention is distribute to the optimization of garbage
recycling network. In this way, it achieves higher
recycling rate and standard rules in waste recycling
field.
3 FEASIBILITY ANALYSIS IN
THE COMBINATION OF THE
LOW-CARBON ECONOMY
AND REVERSE LOGISTICS
NETWORK
At present, researches in low-carbon economy and
the reverse logistics network is plenty ,but little in
the coordination with both low-carbon economy and
the reverse logistics network.
This article takes the paper recycling reverse
logistics network as an example. With the analyses
of the relevance between them while taking the
carbon as the carrier, we realize the coordination
between the optimization of reverse logistics
network and the low-carbon economy. It mainly
displays in the following two aspects specifically.
First, the recycling of waste paper can reduce
carbon emissions. From the ecological footprint
analysis, the footprint of woodlands is based on the
original wood. With the consumption of wood-pulp
paper the paper trail, the waste paper recovery and
carbon emissions reduction of the relationship is a
sign of the waste paper recycling of paper
consumption .To begin with, proportion of pulp and
paper is about 0.9:1.
With the pulp of recovery which would be based
on carbon emissions and the recovery paper analyses
per ton saved carbon emissions. One ton per
recycling of waste paper can be made in 0.85 million
tons of paper and timber while three tons of a little
off the tree grown tall tree.
Secondly, the reverse logistics network can also
reduce carbon emissions. This process through the
path that rearrangement of transportation planning
and waste paper recovery is in a network, including
the customer and processing center, the secondary
market and paper. This four nodes can help
determine the location of the vehicle the transport
lines and reduce the amount of fuel as well as the
carbon emissions.
Low-carbon economic rely mainly on carbon
emissions reduction and waste paper recovery by the
reverse logistics network analysis. So that the
reverse network for the carbon emissions reduction
has a positive role and low carbon economic and
reverse the integrated logistics network show
feasibility.
4 MODEL BUILDING
4.1 Model Specification
With general consideration of the costs 、benefits
and carbon emissions. This article sets two goals: the
maximization of benefits and the minimization of
carbon emission.
With the control and action of pretreatment
centers number and current capacity of each node,
this study count out the location of customers,
garbage recycling centers, second-handed markets
and paper mills under the goals while it is also
capable to trace out the plan of recycling center
construction and capacity during the transportation.
4.2 Model Assumption
(1) Customers as well as trash treatment plant
quantity is acknowledged and each customer as
well as recycling production output of trash
treatment plant and price is known;
THE RESEARCH OF PAPER REVERSE LOGISTIC NETWORK OPTIMIZATION ON THE LOW-CARBON
ECONOMY
337

(2) All recycling product’s quality is the same while
part of them is secondary markets, carries on the
restoration a part to the paper mill;
(3) The location of each pretreatment center is
acknowledged, so as its fixed investment and
capability.
(4) The location and capability of each second-
handed market is acknowledged, so as each
Paper Mill.
(5) The costs of each processing step and carbon
emission from the three spots is known.
(6) Freight for each unit and carbon emission from
each node of the network is acknowledged.
(7) The number of pretreatment centers is restricted.
(8) Only a single-round static model
4.3 Model Establishment
(1) Symbols
I
: Collection of costumer
J
: Collection of garbage recycling centers
P
: Collection of splitting treatment centers
S
: Collection of second – handed markets
H
: Collection of paper mill
s
S
W
: Unit income from paper sold from the second –
handed market
h
H
W
: Unit income from paper sold from the paper
mill
s
S
X
: Output of paper from the second – handed
market
h
H
X
: Output of paper from the paper mill
0
C
: Reverse costs from reprocessed center to
customers
1
C
: Reverse costs from reprocessed center to paper
recycling center
ip
A
1
: Unit transport costs from customer I to
reprocessed center p
jp
A
2
: Unit transport costs from paper recycling j to
reprocessed to reprocessed center p
sp
A
3
:Unit transport costs from reprocessed center p
to paper recycling s
ph
A
4
: Unit transport costs reprocessed center p to
paper mill h
ip
D
1
: Distance from customer i to reprocessed center
p
sp
D
2
: Distance from paper recycling center to
reprocessed center p
sp
D
3
: Distance from reprocessed center p to
secondary markets s
ph
D
4
: Distance from reprocessed center p to paper
mill h
p
f
: Fixed cost of the reprocessed center p per year
*
D
C
: Carbon emission from each unit of transport
λ
: Coefficient of carbon emission of one ton
waste paper
P
p
α
: Recovery rate of treatment center
H
h
α
: Production rate of paper mill
P
p
Q
: Operational capacity restrictions of treatment
center
S
s
Q
: Operational capacity restrictions of second –
handed market
H
h
Q
: Restoration ability limitation of paper mill
γ
: Restiction of the number of Treatment center
M
: Carbon emissions from transportation before
optimization
(2) Decision variable
p
P
: 0-1 variable, 1 represents to buid reprocessed
center, 0 represents not
p
i
I
X
: the amount of paper reversed from reprocessed
p to costumer i
p
j
J
X
: the amount of paper reversed from costumer p to
recycling center j
ip
X
1
: the amount of paper reversed from customer I to
reprocessed center p
jp
X
2
: the amount of paper reversed from recycling
center j to reprocessed center p
sp
X
3
: the amount of paper reversed from reprocessed
center p to secondary market s
ph
X
4
: the amount of paper reversed from reprocessed
center p to paper mill h
(3) Objective function
∑
−
∑
−
∑∑∑
−
∑∑ ∑∑ ∑∑
−−−−
∑∑
−−
∑
+
∑
+
∑
+
∑
+−
∑∑
+
∑∑
+
∑∑
+
∑∑
H
p
P
p
f
H
h
H
X
h
C
P
p
P
X
p
C
PH
ph
X
ph
D
ph
A
IP JP PS
ps
X
ps
D
ps
A
jp
X
jp
D
jp
A
ip
X
ip
D
ip
A
IJ
j
J
XC
i
I
XC
h
H
X
H
h
H
W
s
S
X
S
s
S
W
h
h
H
X
s
S
S
XM
PH
PH
D
PS
PS
D
JP
JP
D
IP
IP
DMax
*
4
*
34
*
4
*
4
3
*
3
*
32
*
2
*
21
*
1
*
1
*
1
*
0
**
6.48*)](
4321
[
λ
(4) Constraints
∑
=
P
ip
X
I
X
i
1
(1)
∑
=
P
jp
X
J
X
j
2
(2)
∑
∑
∑
∑
+=+
SH
ph
X
ps
X
IJ
jp
X
ip
X
P
p 43
)
21
(
α
(3)
s
S
X
P
ps
X ≤
∑
3
(4)
ICEIS 2011 - 13th International Conference on Enterprise Information Systems
338

h
H
X
P
ph
X
H
h
=
∑
4
α
(5)
p
P
P
p
Q
J
jp
X
I
ip
X *
21
≤+
∑∑
(6)
∑
≤
P
S
s
Q
ps
X
3
(7)
∑
≤
P
H
h
Q
ph
X
4
(8)
γ
≤
∑
p
p
P
(9)
Pp
p
P ∈∀= 1,0
(10)
0≥∀X
(11)
Constraints (1) ~ (5) is for the customers,
garbage collection center, processing center, the
second-handed market and paper mill .Five points in
the flow of conservation are based on the type
constraint; (6)~ (9) are based on the limitation
of processing center, the second-handed market and
paper mill. (10) ~ (11) concerns on variable value.
5 ANALYSIS
A waste paper recycling centre of the network has
three large waste treatment centre: a seconded
market, one paper mill, waste paper from one
customer and a garbage collection centre.
The treatment center’s recycling rate is 70%
while the production rate of the paper mill is
35%.The recovery for customer and garbage
collection centre from the pretreatment is 39000 tons
and 91000 tons. The second-handed market and
paper mill can get 44,000 tons and 59000 tons from
the pretreatment center.
The second-handed market’s selling price of
paper is 1500 Yuan per ton while the paper mill’s is
1300 Yuan. The transportation costs from the
pretreatment center to the second-handed market are
1.3 Yuan while one from pretreatment center to the
paper mill is 1.2 Yuan. The transportation costs from
the customer to the pretreatment center is 1.2 Yuan
while one from recycling center to pretreatment
center is 1.1 Yuan. Cost of customer and recycling
centers to be dealt with the transportation is 1.1 and
1.2 billion Yuan. In the past, emissions of carbon
from transportation was 620 tons a year while
transportation of carbon emissions from 0.00042
tons for a ton and paper for discharge coefficient is
0.0026 one unit of data.
Table 1: Distance among customers, recycling center,
reprocessed center and paper mill.
Distance
(Km)
Distance
(Km)
Distance from
customer to
reprocessed
center 1
3 Distance from
reprocessed
center 1 to
recycling
center
15
Distance from
customer to
reprocessed
center 2
2 Distance from
reprocessed
center 2 to
recycling
center
20
Distance from
customer to
reprocessed
center 3
5 Distance from
reprocessed
center 3 to
recycling
center
10
Distance from
recycling center
to reprocessed
center 1
15 Distance from
reprocessed
center 1 to
paper mill
20
Distance from
recycling center
to reprocessed
center 2
10 Distance from
reprocessed
center 2 to
paper mill
23
Distance from
recycling center
to reprocessed
center 3
20 Distance from
reprocessed
center 3 to
paper mill
15
Table 2: The maximum processing ability ofreprocessed
center, secondary market and paper mill.
PPP
1
i
I
X
2
i
I
X
3
i
I
X
1
i
I
X
2
i
I
X
3
i
I
X
0 0 1 0 0 39000 0 0 91000
1 0 0 39000 0 0 91000 0 0
1 1 0 14500 24500 0 91000 0 0
0 1 0 0 39000 0 0 91000 0
0 1 1 0 12500 26500 0 78500 12500
With the data for the objective function and
constraints, we use lingo11. 0 to achieve the result :
Recycling centre will only transport waste paper to the
further processing center while customers sent the waste to
THE RESEARCH OF PAPER REVERSE LOGISTIC NETWORK OPTIMIZATION ON THE LOW-CARBON
ECONOMY
339

the waste treatment centre 1 and 2. Finally, the maximum
income is 2670000 Yuan. Results shown in Table 3:
Table 3: Results of the modelling.
results(ton)
Maximum ability of
reprocessed center
150000
Maximum ability of
secondary market
100000
Maximum ability of
paper mill
120000
Figure of table 3 shows that the number of
Figure of table 3 shows that the number of
pretreatment center is two at most. Customers can
deliver waste to pretreatment centre 1 and 2 while
waste paper recycling centre will always be handled
by the central treatment centre. 1 and 2 will be sent
to the second-handed market. The waste paper from
the pretreatment center 2 of the waste treatment
centre will be sent to paper mill.
6 CONCLUSIONS
On the basis of the low-carbon economy and reverse
logistic network, this article works on the waste
paper recovery and recycling network .It takes waste
paper recycling reverse logistic network as example
as well. It argues for the feasibility of the model in
which low-carbon economic and the optimization of
the reverse logistics network can perfectly combine.
With the construction of the model, it can achieve
the two goals while it is also effective.
However, this article is base on the assumption
of the maximize benefit from each node in the
supply chain and the minimization of carbon
emission, which leads to the contradiction that either
the whole or the each node can achieve the
maximize profit. Therefore, the next step may be
based on this and focus on the benefit distribution in
the method the Nash Equilibrium, a principles of
economics.
REFERENCES
Stock J. R. Development and implementation of reverse
logisties Programs. Oakbrook , IL: Council of
logisties management,1998.
Fleisehmanna M,Krikke H. R.,Dekker R.,et al. A
characterization of logisties networks for Product
recovery. Omega, 2000,Vol.28(6):653-666.
达庆利等.逆向物流系统结构研究的现状及展望.中国管
理科学,2004,vol.12(l):131-138.
Fleiselllnarin M. Reverse logistics network structures and
design. Erim report series research in management,
2001.
Jayaraman V.,Guide J. V.,Srivastava R. A closed-loop
logisties model for remanufacturing . Journal of the
operational research society,1999,Vol.50:497-508.
秦小辉.废旧电子产品逆向物流网络优化设计研究.西南
交通大学,2008,vol.29(128):14-16.
Listes O. A decomposition approach to a stochastic model
for supply-and-return network design. Econometric
Institute Reports EI2002-43.
马祖军,张殿业,代颖.再制造逆向物流网络优化设计
模型研究. 交通运输工程与信息学报,2004 ,
Vol.2(2):53-58.
赵宜,尹传忠,蒲云.回收物流设施多层选址模型及其
算法.西南交通大学学报,2005,Vol.40(4):530-534
邢继润.发展低碳经济的公共政策研究:[D].华中科技大
学,2009
Neto J. Q. F., Bloelnhof-Ruwaard J. M.,van Nunen J. A.
E. E. et al. Designing and evaluating sustainable
logistics networks. Erasmus research institute of
management report series research in management,
ERS-2006-003-LIS,2006.1.
Bloelnhof-Ruwaard J. M. , Wassenhove L. N. Van ,
Gabel H. L. , et al. An environmental life cycle
optimization model for the European pulp and paper
industry,Omega
,
Intemational joumal of manage-
ment science, 1996,Vol.24(6):615-629
ICEIS 2011 - 13th International Conference on Enterprise Information Systems
340
