
KNOWLEDGE ORGANIZATION IN CONCEPT MAPS
Teacher Students’ Representations of the Relatedness of Physics Concepts
Maija Nousiainen and Ismo T. Koponen
Department of Physics, University of Helsinki, Helsinki, Finland
Keywords:
Knowledge organization patterns, Concept maps, Directed networks, Learning.
Abstract:
Conceptual understanding of physics is based on understanding what the key concepts are and how they are
related. In learning and teaching connections which tie concepts to each other give direction of progress - there
is a flux of information. We discuss here how such ordering of concepts can be made visible by using concept
maps and how the maps can be used in analysing the students’ views and ideas about the inherent logic of
the relatedness of concepts. The approach discussed here is informed by the recent cognitively oriented ideas
of knowledge organization concentrating on simple knowledge-organization patterns and how they form the
basis of more complex concept networks. The results show that even in well connected maps there can be
abrupt changes in the information flux in the way knowledge is passed from the initial levels to the final levels.
This suggests that handling the information content is very demanding and perhaps a very difficult skill for a
teacher student to master.
1 INTRODUCTION
Good conceptual understanding is based on under-
standing what the key concepts are and how these
concepts are connected. This kind of relational struc-
ture of knowledge can be presented as a network
of concepts or as concept maps(Novak, 2002; Ruiz-
Primo and Shavelson, 1996; Liu, 2004; Koponen and
Pehkonen, 2010). Moreover, research on the structure
of the students’ concept maps suggests that a good
cocnceptual understanding is reflected as intercon-
nected and web-like structures (Kinchin et al., 2000;
Koponen and Pehkonen, 2010).
We concentrate here on the problem of how the
relational structure of physics concepts can be rep-
resented for purposes of making plans for teaching.
The context of making plans to teach is interesting,
because it is such a context that the relational struc-
ture of concepts must be approached from the view-
point of how to motivate and justify the introduction
of new concepts on the basis of concepts which have
already been learned. Consequently, the connections
which tie concepts to each other quite naturally pro-
vide a comprehensible direction for progress - there is
”flux of information” so that what was learned before
is the basis for learning new ideas. In this study we
discuss how student teachers (in physics) represent
their views about the relatedness of physics concepts
by using specially designed concept maps, which pay
attention to the experiments and models in linking
the concepts (Koponen and Pehkonen, 2010). The
maps discussed here have been used in teacher edu-
cation as tools to represent knowledge and they are
simple enough node-link-node representation to ex-
press the most evident connections between concepts.
There exist richer representational tools, for example
the Concept Graphs (Sowa, 2008) but they would be
too elaborate for purposes of teachers.
The approach discussed here is informed by the
recent cognitively oriented ideas of knowledge or-
ganization around basic knowledge-organization pat-
terns and how they form the basis of more com-
plex concept networks (Kemp et al., 2007; Kemp and
Tenenbaum, 2008; Duong et al., 2009). The analysis
of such concept networks is then very naturally based
on the use of network theory through analysis of the
concept maps made by the students. Here six cases
(five student maps and one “master map”) are studied
from a general viewpoint (although the context is spe-
cific, namely electricity and magnetism). The analy-
sis reveals the important features of the inherent con-
nectedness, ordering and the flux of information re-
lated to the progress in introducing the new concepts
in the pre-service teachers’ plans made for physics
teaching. This information is relevant for pre-service
teachers themselves as well as for the instructors.
139
Nousiainen M. and Koponen I..
KNOWLEDGE ORGANIZATION IN CONCEPT MAPS - Teacher Students’ Representations of the Relatedness of Physics Concepts.
DOI: 10.5220/0003615801390144
In Proceedings of the International Conference on Knowledge Engineering and Ontology Development (KEOD-2011), pages 139-144
ISBN: 978-989-8425-80-5
Copyright
c
2011 SCITEPRESS (Science and Technology Publications, Lda.)

2 THEORY
Cognitively oriented studies of knowledge formation
suggest that procedures of knowledge construction
and processing may be simple ones, reducible to ba-
sic patterns, even in those cases where the result-
ing structures are complex. Of particular importance
are different types of hierarchies, cliques, transitive
and cyclical patterns (Kemp et al., 2007; Kemp and
Tenenbaum, 2008; Duong et al., 2009). Apparently,
many aspects of knowledge can then also be repre-
sented in terms of such patterns. On this basis, we
seek here an understanding of the students’ ideas con-
cerning how physics concepts are related and how
they can be introduced in teaching.
In teaching physics the experiments and mod-
elling are two basic procedures used to introduce new
concepts or to show how they apply in different sit-
uations. It is to be expected that the relations be-
tween the concepts are then guided by the inherent
logic of constructing physics experiments and using
models to describe and explain the experimental re-
sults (Safayeni et al., 2005; Koponen and Pehkonen,
2010). The operationalising experiment is frequently
used in advanced-level physics instruction. In this
case the concept is operationalized (i.e. made mea-
surable) through pre-existing concepts. The new con-
cept C is constructed sequentially, starting from the
already existing ones A and B which provide the basis
for an experiment’s design and interpretation. In that
process, it often happens that new connection between
A and B is also established. Due to this interdepen-
dence of concept contained in this procedure, it cre-
ates the basic triangular-like pattern A → C ← B ← A
between the concepts (Safayeni et al., 2005; Koponen
and Pehkonen, 2010). The modelling procedures may
also create similar triangular patterns (Koponen and
Pehkonen, 2010).
In practice, the students use these procedures
when they link concepts and represent the relations
between the concept in form of concept maps. They
draw concept maps representing how they would pro-
ceed in introducingnewconcepts in their teaching and
in what order the concepts are introduced.
The concept maps made by the physics teacher
students represent not only the relatedness of con-
cepts, but they also represent how concepts are intro-
duced in teaching. This means that, in a sense, net-
works also represent the ”flux of information” which
takes place in teaching or, rather, which teacher stu-
dents have planned to take place in their teaching. In
well-planned teaching there should naturally be a reg-
ular flux of new information (in order that new knowl-
edge is learned), but no abrupt changes in that flux
(otherwise there are fluctuations in demandingness),
and no uncontrollable reductions in the flux (which
would give a feeling that learned knowledge is not
needed in further learning). The information flux is
closely related to the possibility of navigating in the
network or going from a givennode to another node in
the network. Therefore, the ordering of nodes, which
comes from the ordering of the procedures, has a cen-
tral role to play in determining the information flux.
3 THE EMPIRICAL DATA
The cases studied here consist of fivestudent maps, all
of which are rather rich in their structure. These maps
are typical to students, who had completed the task
with thought and had taken time to construct the maps
(altogether we have 70 maps and this feature charac-
terises about half of them). The number of the con-
cepts was limited to n=34 most central concepts and
laws of electromagnetism, but students were free to
introduce as many links as they found necessary. One
example of the designed maps is shown in Fig. 1. For
purposes of comparison and reference, we have also
constructed a ”master map”, where all well-motivated
and well-justified connections that are found in the
student maps are collated into one map.
Figure 1: An example of students’ concept maps (Gs) for
n = 34 concepts in electromagnetism. The map shows con-
cepts (boxes), laws and principles (boxes with thick bor-
ders). Links are either operationalising experiments (E) or
modelling procedures. The nodes are numbered in the order
in which they are introduced through experiments.
In order to visualise the relevant topological fea-
tures of the maps, it is useful to make the visual
appearance of the maps comparable by removing
any ambiguity associated with the graphical layout.
KEOD 2011 - International Conference on Knowledge Engineering and Ontology Development
140
This can be done by redrawing the maps so that the
same rules for ordering the nodes are used in all
cases. In graph theory this is called embedding of the
graph (Kolaczyk, 2009). For the embeddings several
well-defined methods are available. The embedded
maps include the same information as do the origi-
nals (i.e. they are isomorphic representations). We
use here ”spring-embedding”, which serves the pur-
pose of revealing visually how tightly certain con-
cepts are connected, so it is suitable for visual inspec-
tion of the clustering due to triangular patterns. The
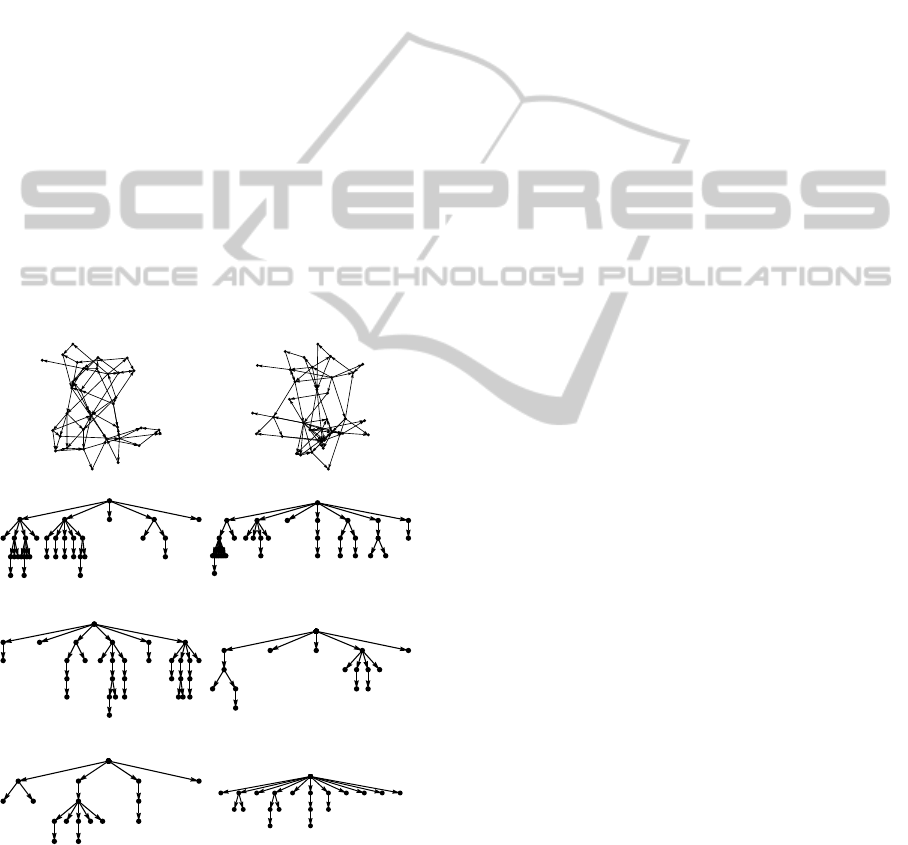
spring-embedded visualizations expose much about
the structure of the concept maps, and more is learned
of the structure through the tree embeddings. For ex-
ample, in Fig. 2 (first row) tree embeddings are shown
when one node is chosen as a starting point. Then it
is seen just how many hierarchical levels there are in
the ordering, and how nodes in these levels can be
reached. Then again a node in the hierarchical level
is chosen, and yet another ordering is revealed, with a
new set of hierarchical levels. When repeated (shown
as rows 2 and 3 in Fig. 2), the number of nodes which
can be arranged in such a way is reduced as shown in
Fig. 2.
1
2
3
4
5
6
7
8
9
10
11
12
13
14
15
16
17
18
19
20
21
22
23
24
25
26
27
28
29
30
31
32
33
34
1
2
3
4
5
6
7
8
9
10
11
12
13
14
15
16
17
18
19
20
21
22
23
24
25
26
27
28
29
30
31
32
33
34
1
2
3
4
5
6
7
8
9
10
11
12
13
14
15
16
17
18
19
20
21
22
23
24
25
26
27
28
29
30
31
32
33
34
1
2
3
4
5
6
7
8
9
10
11
12
13
14
15
16
17
18
19
20
21
22
23
24
25
26
27
28
29
30
31
32
33
34
123
4
5
6
7
8
9
10
11
12
13
14
15
16
17
18
19
20
21
22
23
24
25
26
27
28
29
30
31
32
33
34
1234
5
6
7
8
9
10
1112131415161718192021
22
2324
25
26
27
28
29
30
31
32
33
34
123456789
101112131415161718
19
20
21
22
23
24
25
26
27
28
29
30
31
32
33
34
123456789
101112131415
16
17
18
19
20
21
22
23
24
25
26
27
28
29
30
31
32
33
34
Figure 2: The ”master map” (Gm, left) and one students’
map (G1, right) in spring-embedded form (first row). In
each case, three examples are given of all 34 possible tree-
embedded forms (three rows).
The visualization provides, in principle, all neces-
sary information of the structures. However, on the
basis of visualizations alone it is still difficult to get
any idea of ordering and relatedness of concepts or
how information is passed from the starting level to
the final levels. In order to describe such features, we
need to develop suitable quantitative measures to de-
scribe the structure and information flux.
4 METHOD OF ANALYSIS
The concept maps are basically node-link-node net-
works or graphs and can be analyzed as such. In a
map (network) of n nodes, the variables a
ij
indicate
the connections between nodes i and j so that if nodes
are connected, then a
ij
= 1 and if there is no connec-
tion, then a
ij
= 0. These elements are the independent
variables and they form a nxn dimensional matrix, the
so-called adjacency matrix a. All quantities (depen-
dent variables) of interest can now be calculated from
the matrix a, and they are as follows (detailed mathe-
matical definitions are given in Table 1):
1. The degree k
i
of the node, which is the number
of the incoming and outgoing links k
in
and k
out
,
respectively. The average degree is denoted by D.
The degree describes the connectivity of the map.;
2. The clustering coefficient C
i
, which is the ratio
of triangles to all the triply connected neighbours
around a given concept.The clustering measures
the probability that the neighbours of the given
concept are also connected i.e. it is a measure for
transitive cliques. ;
3. Flux into the nodes (Flux-I) Φ
i
, which gives the
total number of links terminating at the given node
k from all levels j < k. This quantity describes
how nodes k < j (i.e. concepts introduced earlier)
support the introduction of node k. In the present
case, it directly describes the ”information” flow-
ing from the previously introduced nodes to ones
introduced later;
4. Flux around the nodes (Flux-A) Ψ
k
, which gives
the total number of links bypassing the given node
k from all levels j < k. This quantity describes
what fraction of nodes k < j (i.e. concepts intro-
duced earlier) is not used to support the introduc-
tion of node k, but which bypasses the node to
higher levels.
The above-defined quantities have a meaning,
which is closely connected to the topology of the net-
work. They are also discussed extensively within the
literature of network theory, in particular the cluster-
ing C as an important measure to characterize the lo-
cal connectedness of the network (Kolaczyk, 2009).
The fluxes Φ and Ψ, on the other hand, directly de-
scribes the ”information” flowing from the previously
KNOWLEDGE ORGANIZATION IN CONCEPT MAPS - Teacher Students' Representations of the Relatedness of
Physics Concepts
141
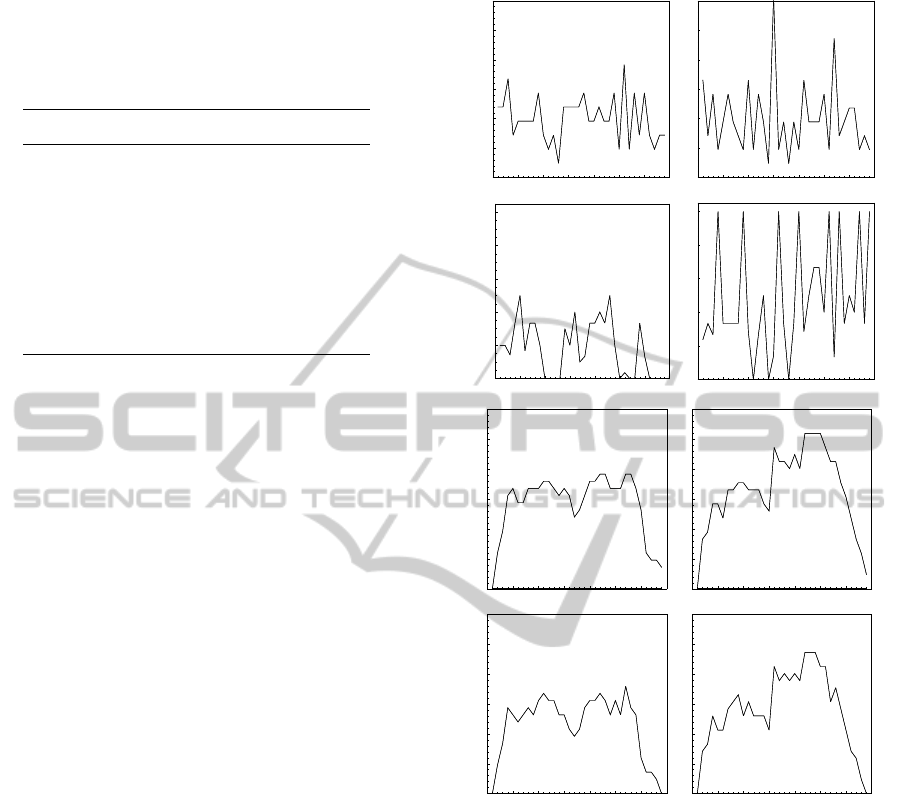
Table 1: Definitions of the quantities characterizing the
topology of the concept networks. In the definitions a
ij
is
the element of the adjacency matrix a. The quantities are
defined for a given node i. The average number of links per
node (average degree) is D.
Quantity Definition
k
in
i
∑
j
a
ji
k
out
i
∑
j
a
ij
k
i
∑
i
k
i
in
+ k
i
out
C
i
∑
j
′
> j
a
ij
a
j j
′
a
ij
′
/
∑
j
′
> j
a
ij
a
ij
′
Φ
i
∑
i−1
j=1
k
out
j
−
∑
i−1
j=1
k
in
j
/D
Ψ
i
∑
i−1
j=1
k
out
j
−
∑
i
j=1
k
in
j
/D
introduced nodes to ones introduced later (Karrer and
Newman, 2009) and they are therefore for our present
purposes the most important and interesting quanti-
ties.
5 RESULTS
Five cases of students’ concept maps are discussed in
terms of the structural measures and the information
fluxes. The selected cases are typical, in the sense
that the features found in them can be found also in
all similar, richly connected maps. About half of the
cases appear to be these types of maps (the total sam-
ple of maps collected consists of about 70 in number).
The quantitative analysis of the maps is carried out by
using the quantities defined in Table 1. These quan-
tities were constructed so that they correspond to the
properties of interest: connectivity, relative amount of
transitive triangular cliques and information fluxes.
The average values of the clustering and fluxes are
given in Table 2 for the maps Gm and G1 shown in
Fig. 2 and for other four maps G2-G5. These val-
ues are representative for larger class of maps (about
one half). In general, the student maps, which have
high clustering and connectedness, are all very sim-
ilar in the level of averaged values, detailed differ-
ences becoming apparent only in node-by-node anal-
ysis. On average the clustering attains values around
0.15-0.30, which is common to networks designed
for purposes of passage of information (Kolaczyk,
2009). Large values of clustering indicate that there
are appreciable connections also between concepts
connected to a given concept, i.e. an abundance of
the nearest neighbour connections. In a more tradi-
tional view of concepts maps, this means an apprecia-
ble number of cross-links and thus shortcuts within a
given level of hierarchy (Ruiz-Primo and Shavelson,
è
è
è
è
è
è
è
è
è
è
è
è
è
è
è
è
è
è
è
è
è
è
è
è
è
è
è
è
è
è
è
è
è
è
ø
ø
ø
ø
ø
ø
ø
ø
ø
ø
ø
ø
ø
ø
ø
ø
ø
ø
ø
ø
ø
ø
ø
ø
ø
ø
ø
ø
ø
ø
ø
ø
ø
ø
Gm, D=4.18
0
5
10
15
20
25
30
35
0.0
0.5
1.0
1.5
2.0
2.5
3.0
Number of links kD
è
è
è
è
è
è
è
è
è
è
è
è
è
è
è
è
è
è
è
è
è
è
è
è
è
è
è
è
è
è
è
è
è
èèèè
ø
ø
ø
ø
ø
ø
ø
ø
ø
ø
ø
ø
ø
ø
ø
ø
ø
ø
ø
ø
ø
ø
ø
ø
ø
ø
ø
ø
ø
ø
ø
ø
ø
Gs, D=4.24
0
5
10
15
20
25
30
35
0.0
0.5
1.0
1.5
2.0
2.5
3.0
è
è
è
è
è
è
è
è
è
è
è
è
è
è
è
è
è
è
è
è
è
è
è
è
è
è
è
è
è
è
è
è
è
è
ø
ø
ø
ø
ø
ø
ø
ø
ø
ø
ø
ø
ø
ø
ø
ø
ø
ø
ø
ø
ø
ø
ø
ø
ø
ø
ø
ø
ø
ø
ø
ø
ø
ø
0
5
10
15
20
25
30
35
0.0
0.2
0.4
0.6
0.8
1.0
Clustering C
è
è
è
è
è
è
è
è
è
è
è
è
è
è
è
è
è
è
è
è
è
è
è
è
è
è
è
è
è
è
è
è
è
è
ø
ø
ø
ø
ø
ø
ø
ø
ø
ø
ø
ø
ø
ø
ø
ø
ø
ø
ø
ø
ø
ø
ø
ø
ø
ø
ø
ø
ø
ø
ø
ø
ø
ø
0
5
10
15
20
25
30
35
0.0
0.2
0.4
0.6
0.8
1.0
è
è
è
è
è
è
è
è
è
è
è
è
è
è
è
è
è
è
è
è
è
è
è
è
è
è
è
è
è
è
è
è
è
è
ø
ø
ø
ø
ø
ø
ø
ø
ø
ø
ø
ø
ø
ø
ø
ø
ø
ø
ø
ø
ø
ø
ø
ø
ø
ø
ø
ø
ø
ø
ø
ø
ø
ø
0
5
10
15
20
25
30
35
0
1
2
3
4
5
6
Flux-I D F
è
è
è
è
è
è
è
è
è
è
è
è
è
è
è
è
è
è
è
è
è
è
è
è
è
è
è
è
è
è
è
è
è
è
ø
ø
ø
ø
ø
ø
ø
ø
ø
ø
ø
ø
ø
ø
ø
ø
ø
ø
ø
ø
ø
ø
ø
ø
ø
ø
ø
ø
ø
ø
ø
ø
ø
ø
0
5
10
15
20
25
30
35
0
1
2
3
4
5
6
è
è
è
è
è
è
è
è
è
è
è
è
è
è
è
è
è
è
è
è
è
è
è
è
è
è
è
è
è
è
è
è
è
è
ø
ø
ø
ø
ø
ø
ø
ø
ø
ø
ø
ø
ø
ø
ø
ø
ø
ø
ø
ø
ø
ø
ø
ø
ø
ø
ø
ø
ø
ø
ø
ø
ø
ø
0
5
10
15
20
25
30
35
0
1
2
3
4
5
6
Node
Flux-A D Y
è
è
è
è
è
è
è
è
è
è
è
è
è
è
è
è
è
è
è
è
è
è
è
è
è
è
è
è
è
è
è
è
è
è
ø
ø
ø
ø
ø
ø
ø
ø
ø
ø
ø
ø
ø
ø
ø
ø
ø
ø
ø
ø
ø
ø
ø
ø
ø
ø
ø
ø
ø
ø
ø
ø
ø
ø
0
5
10
15
20
25
30
35
0
1
2
3
4
5
6
Node
Figure 3: Node-by-node (nodes 1-34) values of degree D,
clustering C, and fluxes Φ and Ψ. The first column shows
the values for master map Gm and the second column for
the student map Gs=G1.
1996; McClure et al., 1999). However, the clustering
must not be too large, because otherwise the naviga-
bility and the passing of information in the maps is
difficult.
The information fluxes are rather large in all stud-
ied cases. The fluxes are given as a total flux per
expected number of links (total flux divided by av-
erage value D of links per node, see Table 1 for def-
inition. The results reveal that typically, per one link
connected to a given node, there are from three to
four links coming from the lower levels. This means
that each node is rather well supported by the many
previous nodes - the meaning content of the concept
KEOD 2011 - International Conference on Knowledge Engineering and Ontology Development
142

(node) is supported or backed up by knowledge con-
tained on the network existing before the introduc-
tion of the new node. This, quite evidently, is one
characteristic of well-planned teaching. In the sample
of 70 maps there are, however, several cases which
are nearly chain-like and very poorly connected with
D < 2 and fluxes of order Ψ ≈ 1 and Φ ≈ 1. It should
be noted that not only in poorly connected maps in-
formation flux is low. In a well-connected network,
though one which is poorly ordered or directed, the
fluxes would be also very small and the passage of
information would be nearly hindered. In terms of
the inherent logic of how concepts are introduced, this
type of situation would indicate either: 1) circular rea-
soning, or 2) constant reference backwards.
In clustering and the fluxes there are large node-
by-node variations. The large variability from node to
node indicates that there is a tendency for certain con-
cepts to gather more links than other concept would
do. A suitable quantity characterizing the relative
variation is the dispersion of the variable defined as
δX = σ
X
/X, where X is the variable’s average value
and σ
X
is the standard deviation. Interestingly, the
dispersions for D, C and fluxes Φ and Ψ given in Ta-
ble 2 show that in student maps there is more varia-
tion than in the ”master map”, which means that stu-
dent maps are not equally regular and balanced as the
master map. This of course is related to the fact that in
student maps there are abrupt changes in the informa-
tion fluxes; some concepts become very central and
much effort goes into their introduction. This, on the
other hand, is somewhat awkward for teaching, be-
cause it means that demandingness of learning may
increase in an uncontrollable way. The master map
does not have such abrupt changes; instead, it dis-
plays a rather steady flux of information throughout
the whole concept network. The results suggest that
rich concept maps not only have large values of clus-
tering and fluxes but, in addition, the node-by-node
values do not vary much. This means that all con-
cepts are roughly similar in the degree of importance
for the whole structure. This, of course, is required
from well-planned teaching, where most of the topics
discussed should appear to be of importance for a stu-
dent. Maintaining small node-by-node variability is
relatively demanding, perhaps owing to the fact that it
apparently requires evaluating the functionality of the
structure as a whole instead only of locally.
6 CONCLUSIONS
We have explored physics teacher-student plans for
the teaching of physics (electricity and magnetism),
Table 2: Average degree D, clustering C and fluxes Ψ and
Φ for master map Gm and student maps G1-G5. The dis-
persions δX of the variables X (see text) are also given.
Gm G1 G2 G3 G4 G5
D 4.18 4.24 3.47 3.06 3.18 3.18
δD 0.38 0.60 0.62 0.54 0.66 0.59
C 0.18 0.48 0.25 0.15 0.25 0.16
δC 0.90 0.69 1.28 1.94 1.39 1.91
Φ 2.82 3.31 3.00 2.76 2.97 3.12
δΦ 0.37 0.40 0.48 0.47 0.60 0.46
Ψ 2.32 2.81 2.51 2.26 2.47 2.62
δΨ 0.43 0.46 0.56 0.53 0.70 0.48
carried out in a physics-teacher preparation course.
The plans were represented in the form of concept
maps. The concept maps were made such that each
link between concepts needed to be justified either
through an experimental or modelling procedure, and
they were explained in a written report coming with
the map. The aspects of interest in these plans are the
relatedness of concepts, and how the ordering of the
concept allows the introductionof new concepts in the
maps. We have introduced here a new method, which
can be used to analyse the students’ plans so that their
inherent logic, ordering and the way to use the infor-
mation in the plans is revealed. These aspects, we
believe, are of importance for understanding and eval-
uating students’ view of how concepts are related and
how they can be introduced in teaching physics.
The structural analysis of the concept maps is
based on the identification of the basic knowledge-
ordering patterns. The pattern of most importance is
a triangular pattern, connected to the procedures of
experiments and modelling. However, the analysis of
the plans for teaching show that even in cases where
the maps have a rich set of connections, and when
concepts are well connected, the inherent logic and
the way knowledge is passed from the initial levels
to the final levels may be awkward and that there are
often abrupt changes in the information flux. Inter-
estingly, when all valid connections found in the stu-
dents’ maps are combined and reorganized, the result-
ing map shows a very regular and steady information
flux. This suggests that handling the information con-
tent is very demanding and perhaps one of the most
difficult skills for a teacher student to master. This no-
tion has direct implications for teacher education and
it also calls for methods to monitor this kind of devel-
opment. The method of analysis introduced here is a
step in this relatively unexplored direction.
KNOWLEDGE ORGANIZATION IN CONCEPT MAPS - Teacher Students' Representations of the Relatedness of
Physics Concepts
143

ACKNOWLEDGEMENTS
This work has been supported by the Academy of Fin-
land through grant SA133369.
REFERENCES
Duong, T. H., Jo, G. S., Jung, J. J. and Nguyen, N. T.
(2009). Complexity Analysis of Ontology Integra-
tion Methodologies: A Comparative Study. Journal
of Universal Computer Science, 15, 877–897.
Karrer, B. and Newman, M. E. J. (2009). Random graph
models for directed acyclic networks. Physical Review
E, 80, 046110-1-12.
Kemp, C., Perfors, A. and Tenenbaum, J. B. (2007). Learn-
ing Overhypotheses with Hierarchical Bayesian Mod-
els. Developmental Science, 10, 307-321.
Kemp, C. and Tenenbaum, J. B. (2008). The Discovery of
Structural Form. PNAS, 105, 10687–10692.
Kinchin, I. M., Hay, D. B. and Adams, A. (2000). How a
Qualitative Approach to Concept Map Analysis Can
Be Used to Aid Learning by Illustrating Patterns of
Conceptual Development. Educational Research, 42,
43–57.
Kolaczyk, E. D. (2009). Statistical Analysis of Network
Data. New York: Springer.
Koponen, I. T. and Pehkonen M. (2010). Coherent Knowl-
edge Structures of Physics Represented as Concept
Networks in Teacher Education. Science & Educa-
tion, 19, 259–282.
Liu, X. (2004). Using Concept Mapping for Assessing and
Promoting Relational Conceptual Change in Science.
Science Education, 88, 373–396.
McClure, J. R., Sonak, B. and Suen, H. K. (1999) Concept
Map Assesment of Classroom Learning: Reliability,
Validity, and Logistical Practicality. Journal of Re-
search in Science Teaching, 36, 475–492.
Novak, J. (2002). Meaningful Learning: The Essential Fac-
tor for Conceptual Change in Limited or Inappropriate
Propositional Hierarchies Leading to Empowerment
of Learners. Science Education, 86, 548–571.
Ruiz-Primo, M. A. and Shavelson, R. J. (1996). Problems
and Issues in the Use of Concept Maps in Science As-
sessment. Journal of Research in Science Teaching,
33, 569–600.
Safayeni, F., Derbentseva, N. and Ca˜nas A. J. (2005). A
Theoretical Note on Concepts and the Need for Cyclic
Concept Maps. Journal of Research in Science Teach-
ing, 42, 741–766.
Sowa, J. F. (2008). Conceptual Graphs. In van Harmelen,
F., Lifschitz, V. and Porter, B. (Eds.), Handbook of
Knowledge Representation, (pp. 213–237), Amster-
dam:Elsevier.
KEOD 2011 - International Conference on Knowledge Engineering and Ontology Development
144
