
RETRIEVING AEROSOL CHARACTERISTICS FROM
SATELLITE OCEAN COLOR MULTI-SPECTRAL SENSORS
USING A NEURAL-VARIATIONAL METHOD
D. Diouf
1
, S. Thiria
2
, A. Niang
1
, J. Brajard
2
and M. Crepon
2
1
Ecole Supérieure Polytechnique, Université Cheikh Anta Diop de Dakar, BP 5085, Dakar Fann, Sénégal
2
IPSL/LOCEAN, Université Paris 6, 75252, Paris, France
Keywords: Multi-layer perceptrons, Atmospheric correction, Variational inversion.
Abstract: We present a new algorithm suitable for retrieving and monitoring Saharan dusts from satellite ocean-color
multi-spectral observations. This algorithm comprises two steps. The first step consists in classifying the
TOA spectra using a neuronal classifier, which provides the aerosol type and a first guess value of the
aerosol parameters. The second step retrieves accurate aerosol parameters by using a variational
optimization method. We have analyzed 13 years of SeaWiFS images (September 1997-December 2009) in
an Atlantic Ocean area off the coast of West Africa. As the method takes into account Saharan dusts, the
number of pixels processed is an order of magnitude higher than that processed by the standard SeaWiFS
algorithm. We note a strong seasonal variability. The Saharan dust concentration is maximal in summer
during the rainy season and minimal in autumn when the vegetation bloom due to the rainy season prevents
soil erosion by the wind.
1 INTRODUCTION
Aerosols are an important component of the Earth
climate system. They reflect the downwelling solar
radiations and thus contribute to cooling the
atmosphere on the one hand and on the other hand,
they may also absorb infrared radiation emitted by
Earth, thus contributing to warming the atmosphere
depending on their quality. A good knowledge of
aerosol properties is therefore necessary for
understanding climate variability and modeling it.
The mass concentration of aerosols is closely related
to the optical thickness
τ
, which is a measure of the
light attenuation. Aerosols are also characterized by
their type (dust, maritime, soot ...).
A major source of aerosols is the Sahara desert,
which seeds the tropical Atlantic atmosphere with
Saharan dusts, which are absorbing aerosols.
These aerosols cross the Atlantic Ocean transported
by the trades winds and may be detected as far away
as the Caribbean Island and South America (Moulin
et al, 1997).
During the last 15 years, several satellites
carrying multi-spectral radiometers dedicated to
ocean-color observation have been launched. They
provide a daily global coverage of Earth at a scale of
some kilometers. These ocean-color radiometers
also provide information about aerosol parameters,
since the atmosphere is located between the ocean
and the satellite. Ocean color radiometer signals
have been intensively used to monitor aerosol
parameters over the ocean (Gordon and Wang,
1994); (Tanré et al., 1997) and to retrieve their most
significant parameters.
The standard aerosol products provided by Space
Agencies such as the SeaWiFS products distributed
by NASA are limited to a quite low optical thickness
(less than 0.35). Moreover, the algorithms used for
SeaWiFS products are not able to deal with
absorbing aerosols nor to retrieve the aerosol
typology.
This paper presents a new method for deriving
aerosol characteristics including those of absorbing
aerosols, from satellite ocean-color data.
2 DATA SETS
2.1 The SeaWiFS Data Set
For this study we use daily luminance measurements
made by the SeaWiFS sensor off the West Africa
297
Diouf D., Thiria S., Niang A., Brajard J. and Crepon M..
RETRIEVING AEROSOL CHARACTERISTICS FROM SATELLITE OCEAN COLOR MULTI-SPECTRAL SENSORS USING A NEURAL-VARIATIONAL
METHOD.
DOI: 10.5220/0003638802970303
In Proceedings of the International Conference on Neural Computation Theory and Applications (NCTA-2011), pages 297-303
ISBN: 978-989-8425-84-3
Copyright
c
2011 SCITEPRESS (Science and Technology Publications, Lda.)

coast in an area between 8°-24°N and 14°-30°W.
These measures extend the period of 1997-2009.
Luminances are at wavelengths 412nm, 443nm,
490nm, 510nm, 555nm, 670nm.765nm and 865nm.
For each wavelength
λ
, the TOA reflectance
ρ
is
computed.
According to Gordon and Wang (1994) the Top
Of the Atmosphere (TOA) reflectance
ρ
is the sum
of several components that can be computed
separately: the Rayleigh multiple scattering (air
molecules) in the absence of aerosols, can be
accurately computed by using the atmospheric
pressure, and the whitecap contribution by taking
into account the wind speed. We removed pixels
contaminated by the sun glitter, using a geometrical
mask. The signal that was finally used in our
classification method was therefore:
ρ
used
=
ρ
a
+
ρ
ra
+
t
ρ
w
(1)
where
ρ
a
is the reflectance resulting from multiple
scattering of aerosols in the absence of the air,
ρ
ra
is
the interaction term between molecular and aerosol
scattering,
ρ
w
, is the contribution of the water and t
is the transmittance of the atmosphere at a given
wavelength (
λ)
.
In equation (1),
ρ
w
is small in the red and near-
infrared, so that
ρ
used
mainly depends on the
aerosol term
raa
ρ
ρ
+
at 670, 765 and 865 nm. For
the other visible bands, it is expected that the aerosol
term remains large enough in most situations to
allow us to retrieve pertinent information (in
particular absorption capability) about the particles
at these wavelengths.
We used satellite data sets comprising ten
dimensional vectors, whose components are eight
wavelengths measured by the radiometer and two
viewing angles since the reflectance spectra depend
on the geometry of the measurement. These angles
are the sun zenith angle
θ
s
and the scattering angle
γ
defined as:
()
ΔΦ+−= cossinsincoscosarccos
svsv
θ
θ
θ
θ
γ
(2)
where
ΔΦ
=
φ
o
-
φ
v
is the azimuth angle difference
between the satellite and the sun, and
θ
v
is the
viewing zenith angle.
Each vector, whose components correspond to
the SeaWiFS wavelengths, represents a
used
ρ
spectrum.
2.2 The Learning Data Set
The learning data set consists of observed
obs
used
ρ
ex-
tracted from pixels of SeaWiFS images off the West
Africa coast during the year 2003 and two associated
viewing angles (i.e., the sun zenith angle
θ
s
and the
scattering angle
γ
). All the available daily SeaWiFS
images were homogeneously sampled (one pixel-
line over 10) providing 426,117 clear-sky spectra
of
obs
used
ρ
. The learning dataset Data
obs
is thus
composed of ten component vectors i.e. the eight
wavelengths measured by the radiometer and the
two viewing angles.
2.3 The Labeling Data Set
The second data set, Data
expert
consists of the
ρ
used
expert
computed at eight wavelengths with a 2-layer
radiative transfer model (Gordon & Wang, 1994) for
various optical thickness values, chlorophyll content
and geometry of the measurement and for five
aerosol models. Each Data
expert
vector comprises
eight spectral components (
ρ
used
expert
) and two
geometry components which are the sun zenith angle
s
θ
and the scattering angle
γ
. To these ten
components which were used for the labeling the
referent vectors provided by the unsupervised
classification, we added the aerosol type and the
optical thickness
τ
at 865 nm. Data
expert
comprises
6,000,000 simulated vectors using four aerosol
models and one absorbing aerosol (Moulin et al,
2001). The five aerosol models were computed at
four different relative humidity (70%, 80%, 90%,
99%). Data
expert
was used in order to introduce the
expertise and to retrieve the aerosol type and the
optical thickness values.
3 THE METHOD
In this study, we used two successive statistical
models for analyzing the Data
obs
images; the Self
Organizing Map (SOM, Kohonen, 2001) model and
the NeuroVaria method (Jamet et al., 2005); (Brajard
et al., 2006). We first processed the images with a
SOM model, which is well suited for visualizing and
clustering a high-dimensional data set. We denoted
this topological map as SOM-A-S (SOM-Angle-
Spectrum). In the light of the results obtained by
Niang et al., (2006), we chose a similar architecture
for SOM-A-S: a two-dimensional array with a large
number of neurons (20 x 30 = 600). SOM-A-S was
learned on the Data
obs
of the year 2003. The vectors
of the learning data set were thus clustered into 600
groups, allowing a highly discriminative
NCTA 2011 - International Conference on Neural Computation Theory and Applications
298

representation of Data
obs
. The second dataset,
Data
expert
, representing the expertise, was used to
decode the SeaWiFS images. The principle of the
method is to compare the ten-component vectors of
Data
expert
whose associated parameters are known,
with those of the neurons of SOM-A-S according to
a distance. At the end of the labeling, each neuron of
SOM-A-S map has captured a set of
ertexp
ρ
and
takes a label, which is extracted from that set
according to the procedure described in Niang et al.,
(2006). The only difference between the two
versions being that the old one uses a first map to
determine 10 different classes of angles, each one
giving rise to a dedicated SOM map for the
classification of the reflectance spectra, while SOM-
A-S uses a unique map doing a data fusion between
the viewing angles and the spectra. By using a
unique map, we avoided the threshold effect that is
induced by the two steps classification (angle and
then reflectance) and the eleven SOM maps
described in Niang et al., (2003).
Each neuron is therefore associated with an
atmospheric and ocean physical parameters (
τ,
C)
and an aerosol type. The SOM-A-S map being
labelled, we are able to analyze a satellite image by
projecting the ten component vector (reflectances
and viewing angles) associated with each pixel on
the SOM-A-S map. Pixels captured by a neuron are
assigned to the aerosol type and optical thickness
associated with this neuron. For monthly
climatology images, the aerosol type is estimated as
the median of the types of the images considered.
The second statistical model improves the
retrieval of the optical thickness. We used a neuro-
variational algorithm, called NeuroVaria, that is able
to provide accurate atmospheric corrections for
inverting satellite ocean-colour measurements. The
algorithm minimizes a weighted quadratic cost
function, J, by adjusting control parameters
(atmospheric and oceanic) such as
τ
and C (Brajard
et al., 2008). J describes the difference between the
satellite measurement
ρ
obs
and a simulated
reflectance
ρ
sim
computed using radiative transfer
codes modelled by supervised neural networks (the
so called Multi-Layer-Perceptrons, MLP). The
minimization implies the computation of the
gradient of J with respect to the control parameters
and consequently of the derivatives of the MLPs,
which is done by the classical gradient back-
propagation algorithm (Bishop, 1995). The novelty
of the version of NeuroVaria developed in this work
is that the MLPs modelling the radiative transfer
codes were specially designed to take African dusts
into account. Moreover we used the atmospheric
parameter values given by SOM-A-S and validated
using in situ data (see section 4), as first guesses of
the NeuroVaria algorithm minimization. Since the
efficiency of a minimizing procedure depends on the
first guesses of the control parameters, we expect to
improve the accuracy of the retrieved parameters.
Using these two statistical models sequentially is
indeed a mixed neuro variational method. We
denoted it in the following by SOM-NV.
4 VALIDATIONS OF THE
AEROSOL PARAMETERS
USING SOM-A-S
As SOM-A-S takes into account Saharan dusts, the
number of pixels processed is an order of magnitude
higher than that processed by the standard SeaWiFS
algorithm. As an example, on October 07 2003,
SOM-A-S processed 29,083 pixels while SeaWiFS
processed 16,193 pixels only; on October 12 SOM-
A-S processed 30,300 pixels and SeaWiFS 3,338
only. Besides a statistical comparison between the
SOM-A-S and SeaWiFS algorithms was made for
values of
τ
<0.35. The Mean Relative Error (MRE)
remains low (22.88% for October 07 2003 and
16.16% for October 12 2003) and the Root Mean
Square Error (RMSE) was less than 0.04 for both
days. As a preliminary conclusion, the values
retrieved by SOM-A-S seem consistent with and
very close to those retrieved by the classical
algorithm of SeaWiFS for
τ
<0.35.
The Angström exponent
α
(500,870) provided by
AERONET, allows us to attempt to validate the dust
aerosol type provided by SOM-A-S. Since the sun
photometer does not give the aerosol type, it is
thought possible to validate the dusts by studying the
behavior of
α
(500,870). The low
α
(500,870)
values (
α
<0.5) result from the presence of large
particles typical of desert dusts (Nobileau et al.,
2005). In Figure 1 we show the distribution of the
α
(500,870) of the Dakar-M’Bour AERONET
measurements for the dusty and the non-dusty days
determined by SOM-A-S on the SeaWiFs collocated
pixels. The confidence interval of the average value
of
α
(500,870) calculated by SOM-A-S from
SeaWiFs measurements for the dusty days was
between 0.40 and 0.47, whereas it was between
0.61-0.79 for non-dusty days. This means that the
dust classification provided by SOM-A-S is in
agreement with the AERONET measurements,
which permits us to distinguish the dust absorbing-
aerosols from the non-absorbing ones by processing
RETRIEVING AEROSOL CHARACTERISTICS FROM SATELLITE OCEAN COLOR MULTI-SPECTRAL SENSORS
USING A NEURAL-VARIATIONAL METHOD
299
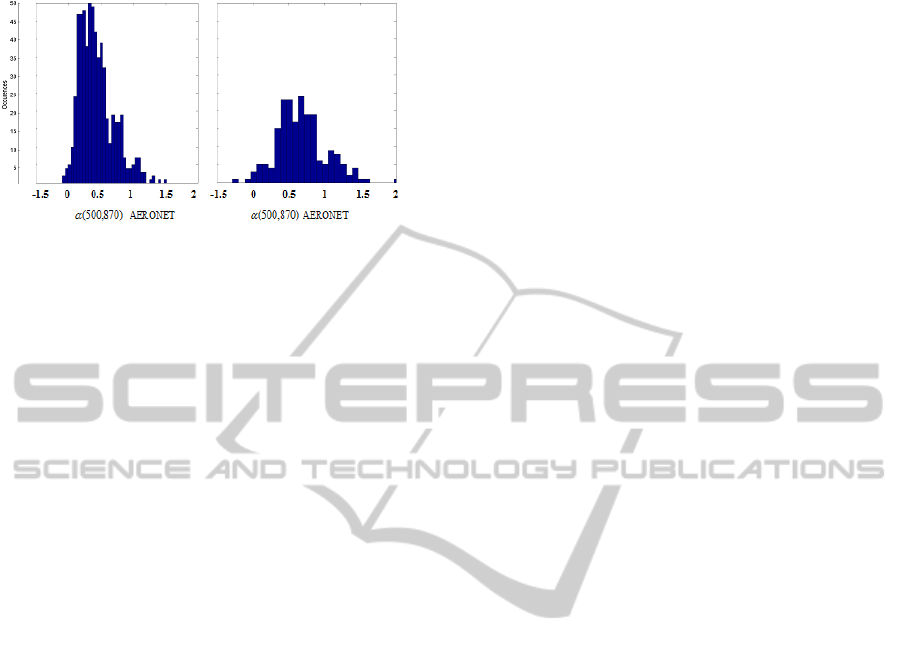
the SeaWiFs observations with SOM-A-S.
Figure 1: Comparison of the
α
(500, 870) values
measured
at the Dakar AERONET station for dusty days (left) and
for non-dusty days (right). For dusty days, most of the
α
(500, 870) values are less than 0.5.
5 IMPROVING ATMOSPHERIC
RESTITUTION WITH SOM-NV
We processed the 13 year data set of SeaWiFS
imagery with SOM-NV. This data set presents a
well-marked seasonal variability. Figure 2 shows, as
an example, the monthly situations during winter
(January), spring (March), summer (July) and
autumn (November) of the year 2006 decoded with
SOM-NV for the aerosol optical thickness and with
SOM-A-S for the aerosol type. In winter (January),
the northern part of the studied domain was free of
dusts and the optical thickness was almost zero; in
the southern part, we observed the presence of
Saharan dusts with a small concentration (small
optical thickness). In spring, the Saharan dusts
moved northward and their concentration (optical
thickness) increased. In summer, the Saharan dusts
invaded the entire domain and their concentration
was maximal. In autumn, the Saharan dusts
disappeared but we noted a low optical thickness in
the whole domain due to the presence of non-
absorbing aerosols. The year 2006 represents a
typical year of the data set concerning the seasonal
variability, which is observed every year.
During winter, spring and summer, the presence
of Saharan dusts is linked to the westward wind,
eroding the Sahara ground and transporting dusts
over the Atlantic, as seen in Figure 2. The extent of
Saharan dust is maximal in summer when the Inter
Tropical Convergence Zone (ITCZ) is at its
maximum latitude. The situation in autumn is
puzzling. The wind is still blowing westward in the
southern part of the domain but we do not detect any
Saharan dust. A possible explanation might be due
to the fact that in autumn, the vegetation has
developed following the summer rain, (summer is
the rainy season). The vegetation and soil humidity
inhibit the erosion of the ground in the southern
region of the Sahara, which might explain the
absence of dust south of 20°N in autumn.
A validation can therefore be made by
comparing the optical thickness values retrieved by
SOM-NV and the SeaWiFS algorithm and those
measured at the AERONET stations of Dakar and
Cabo Verde, respectively denoted
τ
SOM-NV
,
τ
SeaWiFS
and
τ
AERO
.
We determine
τ
, by taking the mean value of
the five SeaWiFS measurements surrounding the
AERONET ground stations.
We ended up, at the two ground stations, with
1,288 measurements collocated for SOM-NV
retrievals and 623 measurements collocated for the
standard SeaWiFS algorithm (fewer because of the
dust mask). We compared the RMSE and the MRE
of
τ
SOM-NV
and
τ
SeaWiFS
with respect to the observed
τ
AERO
.
The results for the AERONET measurements
collocated with those of SeaWiFS and the SOM-NV
for which the SeaWiFS optical thickness value was
less than 0.35 (SeaWiFS critical value) are presented
in Table 1. Table 2 shows comparisons for the
AERONET measurements collocated with those of
the available SOM-NV, which only include
measurements for which the optical thickness value
was higher than 0.35.
The correlation coefficient between
τ
SOM-NV
and
τ
AERO
is higher than that between
τ
SeaWiFS
and
τ
AERO
showing the good performances of the SOM-NV
method. This is confirmed by the scatter plot of
τ
SOM-NV
and
τ
AERO
, and
τ
SeaW
and
τ
AERO
(Figure 3 for
Dakar, Figure 4 for Cabo Verde). But it is also
important to note that the SOM-NV neural decoding
allows the retrieval of high optical thickness values
(i.e., greater than 0.35, above which the SeaWiFS
algorithm does not work) with a good accuracy.
6 CONCLUSIONS
We have developed an original and efficient two-
step method for retrieving optical properties (type
and optical thickness) from TOA reflectance
measured by satellite-borne multi-spectral ocean-
color sensors. The method is based on a combination
of a neural network classification and a variational
optimization. It makes use of the full spectrum and
two viewing angles of measurements to perform the
aerosol identification.
NCTA 2011 - International Conference on Neural Computation Theory and Applications
300
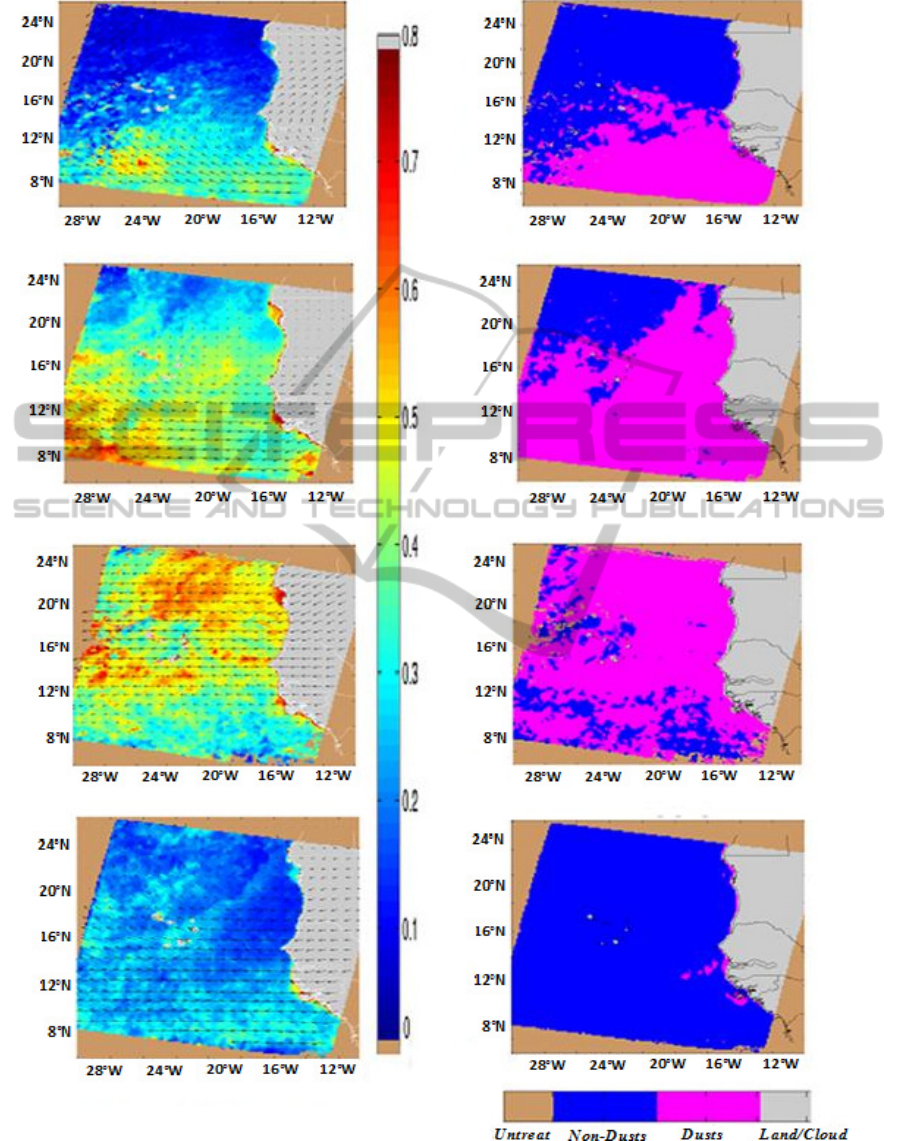
Figure 2: Monthly map of optical thickness (left panels) computed with SOM-NV and extent of Saharan dust (right panels)
for (from top to bottom) January, March, July and November 2006 computed with SOM-A-S.
RETRIEVING AEROSOL CHARACTERISTICS FROM SATELLITE OCEAN COLOR MULTI-SPECTRAL SENSORS
USING A NEURAL-VARIATIONAL METHOD
301
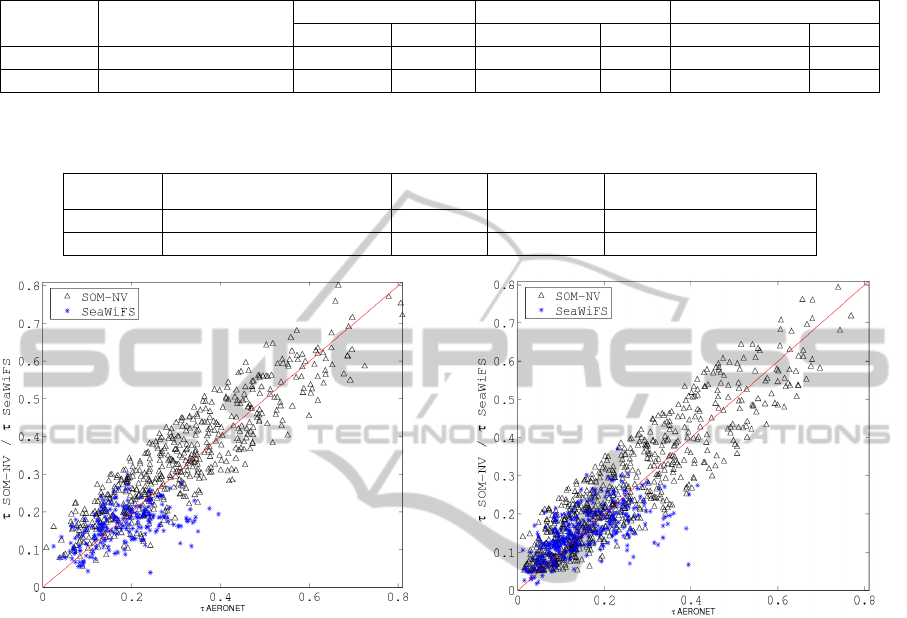
Table 1: Comparison of the performances (RMSE and MRE) obtained on the optical thickness (< 0.35) computed by the
SOM-NV and the SeaWiFS product with respect to the concomitant AERONET measurements at Dakar (M’Bour) and
Cabo Verde (Sal Island) averaged for the 12 years from 1997 to 2009.
Station Number of
Collocated data
RMSE
MRE (%) Correlation coefficient
SOM-NV SeaW. SOM-NV SeaW. SOM-NV SeaW.
Dakar 232 0.023 0.025 33.8 32.6 0.83 0.69
Cap-Vert 391 0.017 0.018 42.2 40.8 0.79 0.70
Table 2: Performances (RMSE and MRE) obtained on the optical thickness computed by the SOM-NV for
τ
>0.35 only,
with respect to AERONET measurements at Dakar (M’Bour) and Cabo Verde averaged for the 12 years.
Station Number of Collocated data RMSE
MRE (%) Correlation coefficient
Dakar 338 0.025 21.9 0.88
Cap-Vert 327 0.024 25.2 0.91
Figure 3: Scatter plot of the optical thickness
measurements computed by SOM-NV (Δ) and the
SeaWiFS product (*) with respect to the AERONET
measurements at Dakar.
This new method allows retrieval of the aerosol
optical properties from the statistical properties of
the data and for the first time the identification of the
aerosol type. Besides, it gives accurate results for
optical thickness values greater than 0.35, which is
not the case for the standard SeaWiFS product. This
allowed us to substantially increase the number of
pixels processed with respect to the standard
SeaWiFS algorithm by an order of magnitude as
shown in Table 1 and Table 2. Moreover, the
method permits detection of absorbing aerosols,
such as Saharan dusts, which is still a challenge.
The monthly mean optical thickness measured by
the SeaWiFS sensor is strongly correlated with the
ground based measurements (AERONET stations),
which validates the pertinence of the method.
Analysis of the 13 years of observation show an
important seasonal variability associated with the
wind direction and intensity. The Saharan dust con-
Figure 4: Scatter plot of the optical thickness
measurements computed by SOM-NV (Δ) and the
SeaWiFS product (*) with respect to the AERONET
measurements at Cabo Verde.
centration is maximal in summer when the ITCZ is
at its maximum latitude and minimum in autumn
when the vegetation bloom reduces the soil erosion
by the wind. This 13 year climatological data set
available at http://www.locean-ipsl.upmc.fr/
~POACC/ may be used to assess the seasonal
variability of the mass of Saharan dust transported
by the wind over the Atlantic Ocean. This new
method can be easily implemented. Climatologists
will get a better estimate of the aerosol concentration
over the ocean and will have access to the aerosol
type, which is important to understand their impact
on climate.
ACKNOWLEDGEMENTS
We are grateful for the support we received from
CNES and IRD. We thank Dr. H. R. Gordon and C.
NCTA 2011 - International Conference on Neural Computation Theory and Applications
302

Moulin for providing the synthetic database. We
thank the AERONET team and Dr. Tanré from LOA
(Lille) for kindly providing the sun-photometer data
at Dakar and Cabo Verde.
REFERENCES
Bishop, C. (1995). Neural networks for pattern
recognition. Oxford University Press.
Brajard, J., Jamet, C., Moulin, C. and Thiria, S. (2006).
Use of a neuro-variational inversion for retrieving
oceanic and atmospheric constituents from satellite
ocean colour sensor: Application to absorbing
aerosols. Neural Networks 19, 178-185.
Brajard, J., Niang, A., Sawadogo, S., Fell, F., Santer, R
and Thiria, S. (2007). Estimating Aerosol parameters
from MERIS ocean colour sensor observations by
using topological maps. Intern. J. Remote Sensing ,
Vol28, N° 3-4 pp 781-795.
Gordon, H. R. & Wang, M. (1994). Retrieval of water-
leaving radiances and aerosol optical thickness over
the oceans with SeaWiFS: A preliminary algorithm.
Applied Optics, 33(3), 443-453.
Holben, B., Eck, T., Slutsker, I., Tanré, D., Buis, J. P.,
Setzer, A., et al. (1998). AERONET. A federated
instrument network and data archive for aerosol
characterization. Remote Sensing of Environment,
Vol. 66, n
o
1, p. 1-16.
Husar, R., Stowe, L. and Prospero, J. (1997).
Characterization of tropospheric aerosols over the
oceans with NOAA advanced very high resolution
radiometer optical thickness operational product.
Journal of Geophysical Research, 102(16), 889-909.
Jamet, C., Thiria, S., Moulin, C., and Crepon, M. (2005).
Use of a neuro-variational inversio for retrieving
oceanic and atmospheric constituents from ocean color
imagery. A feasibility study. Journal of Atmospheric
and Oceanic Technology, 22(4), 460-475.
Doi:10.1175/JTECH1688.1
Kohonen, T. (2001). Self organizing maps (3
rd
ed.). Berlin
Heidelberg: Springer Verlag. p. 501. Moulin, C.,
Lambert, C. E., Dulac, F. and Dayan, U. (1997).
Control of atmospheric export of dust from North
Africa by the North Atlantic Oscillation. Nature, 387,
691-694.
Moulin, C., Gordon, H. R., Banzon, V. F., and Evans, R.
H. (2001). Assessment of Saharian dust absorption in
the visible from SeaWiFS imagery. Journal of
Geophysical Research, 106, 18239-18250.
Niang, A., Badran, F., Moulin, C., Crépon, M. & Thiria, S.
(2006). Retrivial of aérosol type and optical thickness
over the Mediterranean from SeaWiFS images using
an automatic neural classification method. Remote
Sensing of Environment, Vol. 100, n
o
1, p. 82-94.
Nobileau, D. and Antoine, D. (2005). Detection of blue-
absorbing aerosols using near-infrared and visible
(ocean color) remote sensing observations. Remote
Sensing of Environment, Vol. 95, n
o
3, p. 368-387.
Tanre, D., Deroo, C., Duhaut, P., Herman, M., Morcrette,
J., Perbos, J. and Deschamps, P. Y. (1997).
Description of a computer code to simulate the
satellite signal in the solar spectrum: 5s code.
International Journal of Remote Sensing, 11 : 659-
668.
RETRIEVING AEROSOL CHARACTERISTICS FROM SATELLITE OCEAN COLOR MULTI-SPECTRAL SENSORS
USING A NEURAL-VARIATIONAL METHOD
303
