
DIAGRAMMATIC KNOWLEDGE MODELING FOR MANAGERS
Ontology-based Approach
Dmitry Kudryavtsev
Intelligent Computer Technologies Dpt., Saint-Petersburg State Polytechnic University, Saint-Petersburg, Russia
Tatiana Gavrilova
Graduate School of Management, Saint-Petersburg State University, Saint-Petersburg, Russia
Keywords: Knowledge visualization, Diagram, Visual modelling language, Ontology, Ontology design pattern,
Business.
Abstract: Diagrams are an effective and popular tool for visual knowledge structuring. Managers also often use them
to acquire and transfer business knowledge. There are many currently available diagrams or visual modeling
languages for managerial needs, unfortunately the choice between them is frequently error-prone and
inconsistent. This situation raises the next questions. What diagrams/ visual modeling languages are the
most suitable for the specific type of business content? What domain-specific diagrams are the most suitable
for the visualization of the particular elements of organizational ontology? In order to provide the answers,
the paper suggests light-weight specification of diagrams and knowledge content types, which is based on
the competency questions and ontology design patterns. The proposed approach provides the classification
of qualitative business diagrams.
1 INTRODUCTION
Knowledge visualization proved to be an effective
tool for knowledge creation, acquisition and transfer
(Eisenstadt et al., 1990); (Eppler and Burkhard,
2007); (Gavrilova and Voinov, 1998). Diagrams
constitute the basis for visual knowledge
representation and elaborated diagrammatic
techniques typically form visual modeling languages
(Harel and Rumpe, 2000). The focus of this paper is
put on the realm of management. Managers also
frequently use diagrams in their work (Lengler and
Eppler, 2007), but the choice of diagrams is often
error-prone and inconsistent.
For the effective choice of the visualization
method, several perspectives should be considered
(Eppler and Burkhard, 2007). Type of content or
knowledge type is one of the perspectives and is the
focus of the paper. Any complex entity can be
represented from several aspects (facets) and at
different strata (layers) (Gavrilova and Voinov,
1998); (Zachman, 2003). The following “7W”
question-based aspects can be proposed and
differentiated (Eppler and Burkhard, 2007);
Gavrilova and Voinov, 1998); (Kipling, 1912);
(Zachman, 2003): WHAT-, WHAT_FOR-, HOW-,
WHO-, WHERE-, WHEN- and WHY-knowledge
types.
Today, there is no validated prescriptive
framework that links business diagrams with the
“7W” knowledge types and that offers specific
diagram for every knowledge type. The problem is
accentuated by the lack of knowledge types’
specifications. This defines the first research
question: What diagrams/ visual modeling
languages are the most suitable for the specific
type of knowledge (content)?
The second research question stems from the
task of ontology visualization within different
applications. Ontology is a formal, explicit
specification of a shared conceptualization.
Traditional graphical representations of ontologies
do not consider a domain specific meaning (Katifori,
et al., 2007). Special ontology-based frameworks are
developed to visualize ontology using domain-
specific notations (Karagiannis and Kühn, 2002);
(Kudryavtsev and Grigoriev, 2011). Some of these
frameworks are oriented towards managers. It
defines the second research question: What
386
Kudryavtsev D. and Gavrilova T..
DIAGRAMMATIC KNOWLEDGE MODELING FOR MANAGERS - Ontology-based Approach.
DOI: 10.5220/0003640103860389
In Proceedings of the International Conference on Knowledge Engineering and Ontology Development (KEOD-2011), pages 386-389
ISBN: 978-989-8425-80-5
Copyright
c
2011 SCITEPRESS (Science and Technology Publications, Lda.)
diagrams/ visual modeling languages are the most
suitable for the visualization of the particular
ontology view?
2 RELATED WORK
Periodic table of visualization methods (Lengler and
Eppler, 2007) provides a good top-level diagrams
overview for managers. Lohse et al. (Lohse et al.,
1994) reported a structural classification of visual
representations. Some of the diagramming tools,
such as Visio, Smartdraw, provide its own
classifications of the templates. Also there exist
several enterprise architecture based classifications,
e.g. Archimate (Jonkers et al., 2003), MEMO
(Frank, 2002), IBM Enterprise framework or
populated Zachman Framework. But these
classifications and frameworks do not include all the
types of diagrams used by managers and are rather
IT-oriented.
Unfortunately these classifications either are too
general, or have rather inconsistent classification
criterias, or have limited set of diagrams, which do
not cover all the “7W” knowledge types. Besides the
suggested categories are specified insufficiently, and
it is quite hard to add new diagram into the existing
classification.
3 METHODOLOGY AND
RESULTS
We suggest using ontology-based specifications for
knowledge types and diagrams. This approach will
provide opportunity to select the diagram for the
specific knowledge types, competency question and
for the visualization of the required ontology view
(elements of ontology).
To describe informally the knowledge types we
suggest to use competency questions technique
(Gómez-Pérez et al., 2008).
Ontology-based knowledge types specification
consists of a set of Ontology Design Patterns (ODP)
(Gangemi and Presutti, 2009). ODP - a modeling
solution to solve a recurrent ontology design
problem. It is a template that represents a schema for
specific design solutions (http://ontologydesign
patterns.org/). Some ODPs can be extracted from
enterprise-related ontologies, (Filipowska et al.,
2009); (Uschold et al., 1998).
Ontology-based diagram specification is based on
the ideas of (Guizzardi et al., 2006), but we suggest
to use “light-weight” specifications of only the core
diagram elements.
The following steps and their results summarize
the suggested ideas:
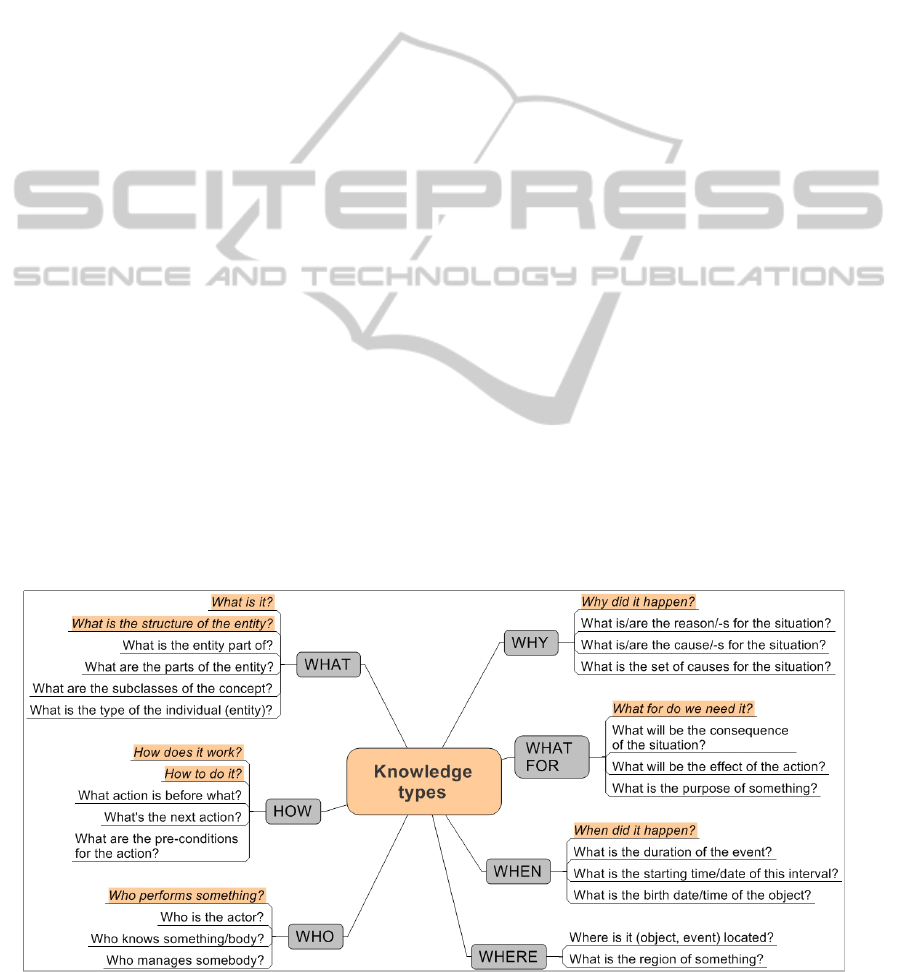
1. Define the knowledge types using competency
questions. The resulting informal description of the
knowledge types is represented in Figure 1 (it
includes just the main representative questions);
2. Specify the knowledge types using ODPs. The
specifications include the lists of corresponding
ODPs and their descriptions, e.g. “WHAT-
knowledge” type can be specified using “part-of”,
“classification”, “subclass” and “type” ODPs from
http://ontologydesignpatterns.org/.
3. Identify and specify diagram types, which will
*non-specific competency questions are highlighted (won’t be directly relate to ODPs)
Figure 1: Knowledge types description using competency questions.
DIAGRAMMATIC KNOWLEDGE MODELING FOR MANAGERS - Ontology-based Approach
387
potentially correspond to the suggested knowledge
types. Ontology-based specification of diagrams also
includes the list of corresponding ODPs and
competency questions.
4. Align ontology-based specifications of
knowledge types and diagrams. Example alignment
between ontology-based specifications of knowledge
type and diagram is shown in Table 1.
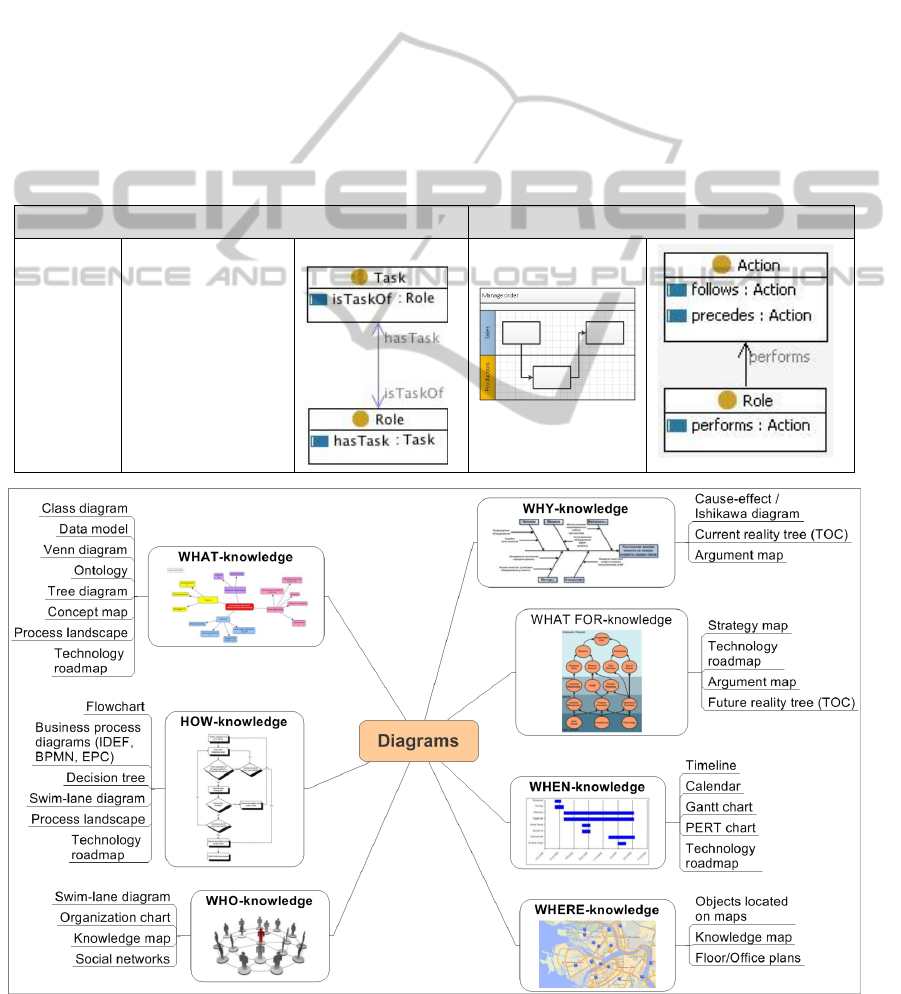
5. Classify diagrams according to knowledge types
based on the ODP alignment. The resulting
classification may be useful for the practitioners in
selecting the appropriate business diagram type
(Figure 2).
The research findings correspond to this 5-step
process and its results, both intermediate and final,
and are represented below.
4 SCENARIOS OF RESULTS
USAGE
The described approach allow us to sketch some
patterns of use which may enhance the effectiveness
of visual modeling. Thus we can introduce three
possible scenarios of results usage.
Scenario A. The user choose the diagrams based on
the competency questions only. These questions will
either lead to diagrams directly, or will point to the
required knowledge type with a list of associated
diagrams.
Scenario B. The advanced user may choose the
diagrams using ODPs and the competency questions
can be used for preliminary filtering.
Table 1: Example alignment between WHO-knowledge and swim-lane diagram specifications.
Knowledge type specification Diagram type specification
WHO Competency
question/-s:
Who performs
smth? (informal)
What roles are this
task (action) of?
“Role task” ODP Swim-lane diagram
Figure 2: Diagrams vs. knowledge types.
KEOD 2011 - International Conference on Knowledge Engineering and Ontology Development
388

Scenario C. The user or service wants to represent
his/her ontology using domain-specific visual
language. Then service aligns ontology, which must
be represented, with ontology-based diagrams’
specifications and then selects the appropriate
diagrams for the ontology based on the alignment.
5 DISCUSSION AND
CONCLUSIONS
The main research results of our paper are:
Specifications for the “7W” knowledge types;
Diagrams systematization, which is grounded on
ontological specifications. Obviously, this
classification is only the attempt as the list of
diagrams for knowledge types is incomplete.
5-step process which makes it possible to extend
knowledge types’ specification and to classify new
diagrams based on the content perspective.
Creation of the extended catalogue/repository for
diagrams should be a collaborative effort based on
the proposed 5-step process.
The main result of our papers for final user
(manager) is the mapping between knowledge types
and popular business diagram types. Such the
mapping together with the suggested informal
descriptions of knowledge types can support
managers, while working with visual models.
The ODP-based approach can be considered as
the first step towards pure ontologically founded
usage of diagrams among managers. The ultimate
goal is the design of a consistent organizational
ontology or ontology network behind a collection of
diagrams. This will allow organizations to have
comprehensive ontology-based knowledge
repository with domain-specific visual views.
REFERENCES
Eisenstadt, M., Domingue, J., et al.. 1990. Visual
knowledge engineering. IEEE Transactions on
Software Engineering, 16(10), 1164-1177.
Eppler, M., & Burkhard, R., 2007. Visual representations
in knowledge management: framework and cases. J/ of
Knowledge Management, 11(4), 112-122.
Filipowska, A., Hepp, M., et al., 2009. Organisational
Ontology Framework for Semantic Business Process
Management. In W. Abramowicz (Ed.), Business
Information Systems, Vol. 21, 1-12. Springer Berlin
Heidelberg.
Frank U., 2002. Multi-Perspective Enterprise Modeling
(MEMO) - Conceptual Framework and Modeling
Languages. In Proceedings of the 35th Annual Hawaii
International Conference on System Sciences, 35,
1258–1267.
Gangemi, A., & Presutti, V., 2009. Ontology Design
Patterns. In Steffen Staab & Rudi Studer (Eds.),
Handbook on Ontologies, 221-243.
Gavrilova, T., & Voinov, A., 1998. Work in progress:
Visual specification of knowledge bases. In A. Pasqual
del Pobil, et al. (Eds.), Tasks and Methods in Applied
Artificial Intelligence, Vol. 1416, 717-726.
Guizzardi, G., Pires, L. F., & Sinderen, M., 2006.
Ontology-Based Evaluation and Design of Domain-
Specific Visual Modeling Languages. In A. G.
Nilsson, et al. (Eds.), Advances in Information Systems
Development, 217-228.
Gómez-Pérez, A., Suárez de Figueroa Baonza, M. C., &
Villazón, B., 2008. NeOn Methodology for Building
Ontology Networks: Ontology Specification.
Harel, D., & Rumpe, B., 2000. Modeling Languages:
Syntax, Semantics and All That Stuff, Part I: The
Basic Stuff.
Jonkers, H., Burren, R. van, Arbab, F., Boer, F. de,
Bonsangue, M., Bosma, H., et al., 2003. Towards a
language for coherent enterprise architecture
descriptions. Seventh IEEE Int. Enterprise Distributed
Object Computing Conf., 28-37.
Karagiannis, D. and K¨uhn, H., 2002. Metamodelling
Platforms. Proceedings of the 3
rd
International
Conference EC-Web 2002 - Dexa 2002, Aix-en-
Provence, France. Lecture Notes in Computer Science,
vol. 2455, 182–196.
Katifori, A., Halatsis, C., Lepouras, G., Vassilakis, C., &
Giannopoulou, E., 2007. Ontology visualization
methods - a survey. ACM Comput. Surv. 39, 4, 1–43.
Kipling, J. R., 1912. The Elephant's Child," in The Just So
Stories, The Country Life Press, Garden City, NY.
Kudryavtsev, D., & Grigoriev, L., 2011. The Ontology-
based Business Architecture Engineering Framework.
Accepted paper for The 10th International Conference
on Intelligent Software Methodologies, Tools and
Techniques, SOMET 2011. P. 21.
Lengler, R., & Eppler, M., 2007. Towards a Periodic
Table of Visualization Methods for Management.
Proc. of the Conference on Graphics and
Visualization in Engineering, 2007, 1-6.
Lohse, G. L., Biolsi, K., Walker, N., & Rueter, H. H.,
1994. A classification of visual representations.
Communications of the ACM, 37(12), 36-49.
Uschold, M., King, M., Moralee, S., & Zorgios, Y., 1998.
The Enterprise Ontology. The Knowledge Engineering
Review, 13(1), 31-89.
Zachman, J., 2003. The Zachman Framework for
Enterprise Architecture: A Primer for Enterprise
Engineering and Manufacturing.
DIAGRAMMATIC KNOWLEDGE MODELING FOR MANAGERS - Ontology-based Approach
389
