
INTRODUCTION OF RFID TECHNOLOGIES
IN A MANUFACTURING SYSTEM
A Discrete Event Simulation Approach
Lobna Haouari, Nabil Absi and Dominique Feillet
Ecole des Mines de Saint-Etienne, CMP Site Georges Charpak, 880 route de Mimet, F-13541 Gardanne, France
Keywords:
RFID, Simulation, Discrete event simulation, Manufacturing, Resource allocation.
Abstract:
Radio-Frequency IDentification (RFID) is a set of technologies which allow rapid, effective and nearly er-
rorless identification of products. It is often compared to identification by bar code, and is considered as an
evolution of the latter. In this paper, we discuss the introduction of RFID in a real manufacturing entity which
produces Configured-To-Order (CTO) printers. A discrete event simulation model of the factory is developed
in order to evaluate the impact of the technology on processes and system performance. Results show that
processing time savings and resource reallocation triggered by RFID use, have an influence on yield, cycle
times and rate of late orders.
1 INTRODUCTION
Radio-Frequency IDentification is a set of technolo-
gies which allow rapid and effective identification of
products. Information that allows object identification
is stored in a tag.
Main advantages of Radio-Frequency IDentifica-
tion are:
• Remote, without line of sight and simultaneous
products identification.
• Individual identification of each tagged object, by
contrast to bar codes which generally identify an
object type and not the object itself.
• Possibility of editing of the information which is
stored in tags.
RFID, or more precisely ancestors of it, exist since
the second world war (Landt, 2005), but, only in re-
cent years, it gained significant interest from indus-
tries and academics (Sarac et al., 2010). Based on
(Rogers, 1962)’s description of diffusion of innova-
tions, (Housseman, 2011) says that we are probably
witnessing the beginning of a real maturation of RFID
technologies.
Wal-Mart and the US Department of Defense
RFID adoption cases are often cited in the literature,
partly because they were the pioneers. In 2005, Wal-
Mart required its top 100 suppliers to use RFID tags
on shipping crates and pallets (Roberti, 2003).
(Sarac, 2010) gives examples of RFID potential
benefits in supply chains: Reduction of inventory
losses, shrinkage, and misplacement errors, reduction
of theft, reduction of Bullwhip effect, increase of pro-
cesses efficiency and speed, improvement of infor-
mation accuracy... However, radio-frequency identi-
fication is not exclusive to supply chains, studies on
the impact of these technologies covers a wide range
of domains such as healthcare systems (Housseman
et al., 2011), maintenance activities in the aeronautics
industry (Jimenez et al., 2010) and insect tracking in
biology (Vinatier et al., 2010)...
In this paper, we address the issue of RFID in-
troduction in a manufacturing case. Main advantages
of the technology, in this study, are processing time
reduction or suppression and possibility of resource
reallocation thanks to the first advantage. Therefore,
a simulation study is conducted to estimate RFID im-
pact on a real system of Configuration-To-Order of
printers, in terms of cycle time, yield, resource uti-
lization and rate of late orders.
The remainder of the paper is organized as fol-
lows. Section 2 presents objectives of the study. Sec-
tion 3 presents the studied problem and the simulation
model. Section 4 describes experiments and results.
Finally, in the last section, some concluding remarks
and research perspectives are discussed.
523
Haouari L., Absi N. and Feillet D. (2011).
INTRODUCTION OF RFID TECHNOLOGIES IN A MANUFACTURING SYSTEM - A Discrete Event Simulation Approach.
In Proceedings of 1st International Conference on Simulation and Modeling Methodologies, Technologies and Applications, pages 523-529
DOI: 10.5220/0003646805230529
Copyright
c
SciTePress

2 OBJECTIVES OF THE STUDY
The manufacturer in this study is currently conducting
a project to increase traceability of its products during
shipping. The project began in late 2008 and will last
three years. Among several technologies, RFID will
be used. On this occasion, a question is raised: Will
system performance be improved if RFID is also used
in internal processes? Indeed, if so, the implementa-
tion of RFID will be facilitated by previous experi-
ence gained through the project.
In addition, the manufacturer is interested in im-
proving its internal processes by other means than
RFID. In fact, improvements upstream of the shipping
may boost performance of the entire supply chain and
profitability of the project. By a careful observation
of the real system, we identified some directions of
improvement such as reallocation of human resources
based on resource utilization or work in process indi-
cators.
Moreover, for different reasons, the manufacturer
has in mind some scenarios and changes in his inter-
nal processes that he wishes to test. For example, us-
ing a single building instead of two (see Section 3).
Another example is processing new types of products.
Therefore, a simulation model was developed to
answer all these questions. Even thought the study
aims to address all the issues previously raised, this
paper will only address RFID issue. Results of the
simulation are an estimation of impact of RFID intro-
duction in the manufacturing case.
3 PROBLEM DESCRIPTION AND
SIMULATION MODEL
In this study, the simulation model represents a real
activity in a factory, in the north of France. The fac-
tory is part of an international group and has dif-
ferent activities. The activity we are interested in
is Configuration-To-Order (CTO) of printers. It is
spread over two buildings: The Logistic Center (LC)
and the Setup Center (SC). In the first building, items
are stored until customers orders are placed. Once this
is done, items are sent to the second building in order
to be assembled together.
3.1 Processes in the Logistic Center
Figure 1 shows the two buildings and processes that
are executed inside them. Even though real and mod-
eled processes are rather complex, they are explained
in a concise and simplified way below.
In the LC (in orange on Figure 1), activity is di-
vided into two rather separate parts: Goods receiving
and storage, on the one hand, and items destocking
and orders preparation, on the other hand.
Regarding the first part of the activity, goods are
delivered by trucks, three times a day. In each truck,
there is a variable number of products. These are
of different types (hundreds types in the real system,
grouped into six types in the model). The arrival of
a truck triggers the beginning of goods receiving pro-
cess. Indeed, LC employees unload the truck, per-
form computer input, bar codes reading, and resize
pallets if needed (in case of oversized and undersized
pallets). When receiving process is finished for the
entire contents of the truck, pallets are stored one by
one in racks.
The second part of the activity in the LC is orders
destocking and preparing. Each order consists of a
single printer and several options. When the demand
is known, items from different orders are grouped
and destocked by tours in order avoid unnecessary
roundtrips of employees and pallet trucks. During
destocking process, some bar codes readings are per-
formed and can be suppressed if we use RFID. After
destocking of all products of a tour, items of the same
order are placed together on a pallet and their bar
codes are read to prevent discrepancies, this process
is called order preparing. From this step, items of the
same order are gathered together on a single pallet.
Therefore, we shall no longer speak about items but
orders or printers. The last process in the LC is ship-
ping of orders to the SC. Indeed, a computer input is
performed for each tour of orders, items are loaded in
a truck and sent to the SC. Note that computer input
can be suppressed by using RFID.
3.2 Processes in the Setup Center
When orders arrive to the SC, employees unload the
truck and execute a computer input process in order
to update the database. Then, orders are unpacked
in parallel workstations. In order to keep traceability,
bar codes on packaging are cut and held with orders
to configuring process. During the latter, printers are
assembled with their options in parallel workstations.
After configuring, some printers may be defective and
require repair. The other printers go to computer input
process at the exit of the building. In addition to com-
puter input, printers are filmed, labeled and placed in
a shipping area in order to wait for shipping trucks
arrival.
SIMULTECH 2011 - 1st International Conference on Simulation and Modeling Methodologies, Technologies and
Applications
524
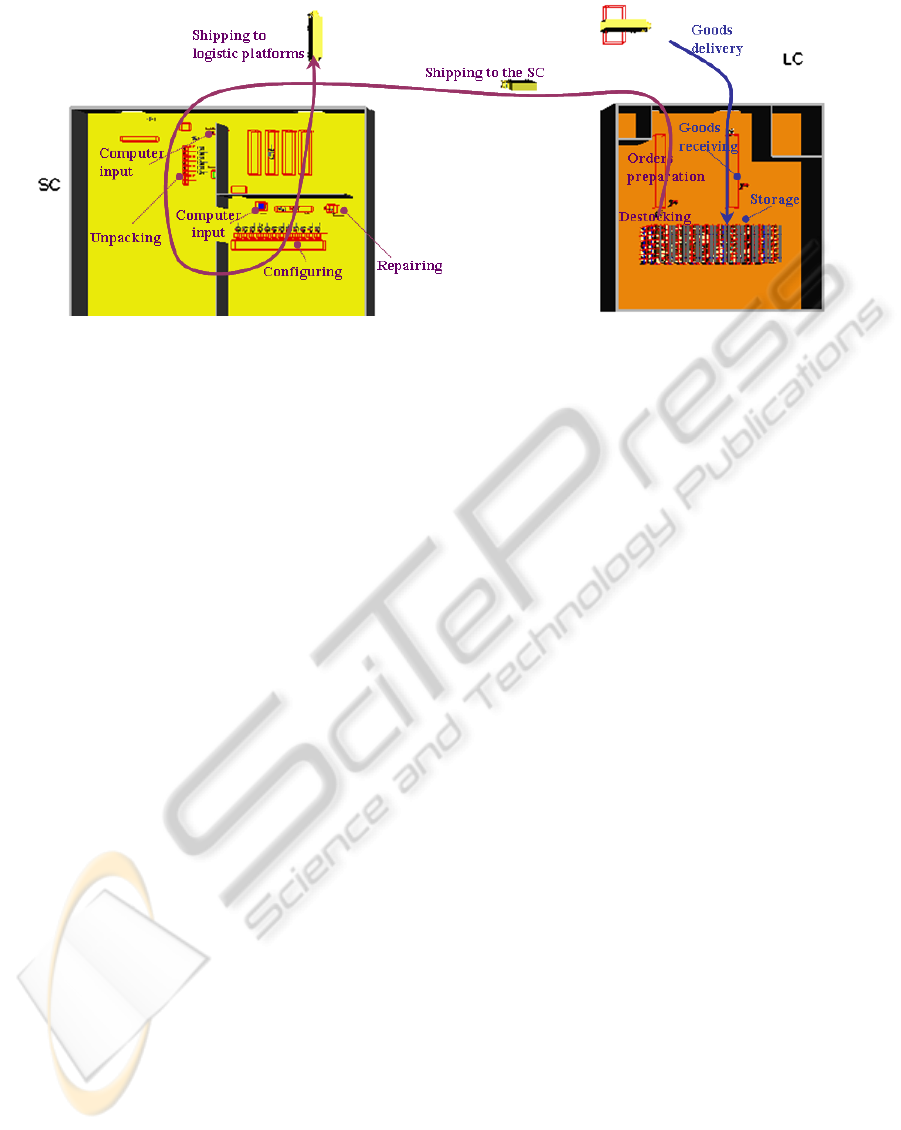
Figure 1: Screen shot of the simulation model of the studied factory (Automod).
4 EXPERIMENTATION
The simulation model in this study was developed us-
ing Automod Version 11.2. Simulation was run for
one month of working days, and replicated 120 times
for each scenario, because of the stochastic nature of
the model.
4.1 Performance Indicators
The manufacturer usually measures the performance
of his system by using cycle time and resource uti-
lization indicators. Hence, we keep these indicators
to measure RFID impact on the system. In addition,
yield indicator seems to be an obvious and necessary
issue. Indeed, if simulation results show short cycle
time and low resource utilization, it may be due to low
yield and not to a good performance.
4.1.1 Yield
In all scenarios, the number of orders received dur-
ing a month of simulated time is the same. Moreover,
at the beginning of the simulation, there is the same
number of work in process (WIP), in all scenarios.
At the end of the simulated month, in general, orders
are not completely satisfied, some of the orders are
still waiting or being processed in the system. We call
yield the number of finished goods processed during
the simulated month. Regarding yield, the objective
is to reach its maximum, which is the number of or-
ders placed during the simulation month plus work in
process of the beginning of the simulation.
4.1.2 Resource Utilization
Resource utilization expresses the part of time when
a resource works divided by the time when it is avail-
able. In this study, resource is available during open-
ing hours minus breaks. Resource utilization gives
valuable information about bottlenecks and waste in
the system. When it is too high (> 90%), in a part of
the system, long waiting times might be due to this
part. When it is too low (< 50%), managers could
allocate less resources to execute the task.
4.1.3 Cycle Time
One of the key performance indicators of this study
is cycle time. Indeed, in a competitive environment,
manufacturers and all levels of the supply chain, in
general, try to better satisfy customers. This requires,
among other things, the satisfaction of their orders
at the earliest. In a Configuration-To-Order environ-
ment, assembly begins after the customer’s order is
placed. Therefore, customers wait, at least, for the
cycle time and shipping time, whereas, in a Make-
To-Stock environment, finished products are made in
advance, and customers orders can be fulfilled with-
out any waiting. All this explains the importance of
the cycle time indicator. In this study, cycle time is the
duration between the instant when an order is known
and the instant when it leaves the overall process of
CTO and is waiting for shipping. The manufacturer
has a maximum cycle time objective to meet, but lo-
gistic and configuration buildings are managed sepa-
rately. So the manufacturer prefers to resolve the main
cycle time into two separate cycle times, one for the
LC, and another for the SC.
INTRODUCTION OF RFID TECHNOLOGIES IN A MANUFACTURING SYSTEM - A Discrete Event Simulation
Approach
525
4.1.4 Rate of Late Orders
The rate of late orders has a direct effect on customers
satisfaction. If an order is shipped late, the customer
will probably be unsatisfied. In our case study, the
manufacturer should fulfill orders in 5 days. But, for
the practical reasons explained earlier, the main ob-
jective is resolved into two separate objectives, 2 days
for the LC and 3 days for the SC. In a real system, it
is difficult to completely eliminate orders that are not
fulfilled on time. Therefore, the aim for this indicator
is to have a smaller rate of late orders, by using RFID
for example.
4.2 Scenarios
Processes were explained in section 3. Many manual
bar code readings are executed during these processes
and can be suppressed by using RFID. Moreover, us-
ing an RFID technology can shorten or suppress some
tasks (computer input, unpacking...). Table 1 shows
impacts of RFID on LC and SC processes in a de-
tailed way. For experimentation, we use three scenar-
ios: A baseline scenario which represents the current
state of the system and two RFID scenarios. The lat-
ter two are similar, except for a human resource which
is simply suppressed in the first case and reallocated
in the second. Indeed, the process of computer input
is completely suppressed in RFID scenarios because
items coming from LC will go through an RFID por-
tal and will be automatically identified. Therefore,
the human resource allocated to the process will be
suppressed in the first RFID scenario, in order to be
used in some other non modeled activity. In the sec-
ond RFID scenario, the human resource is reallocated
to the assembly process, because results show that as-
semblers are the busiest resources of the system (see
Table 2).
4.3 Results
In this section, results are presented per performance
indicator. Figures 2, 3, 4, 5 present values of indi-
cators for each scenario. The baseline scenario is in
blue, the first RFID scenario is in purple and the sec-
ond is in green. Table 2 contains the same informa-
tion as figures plus a comparison between the baseline
scenario and each RFID scenario.
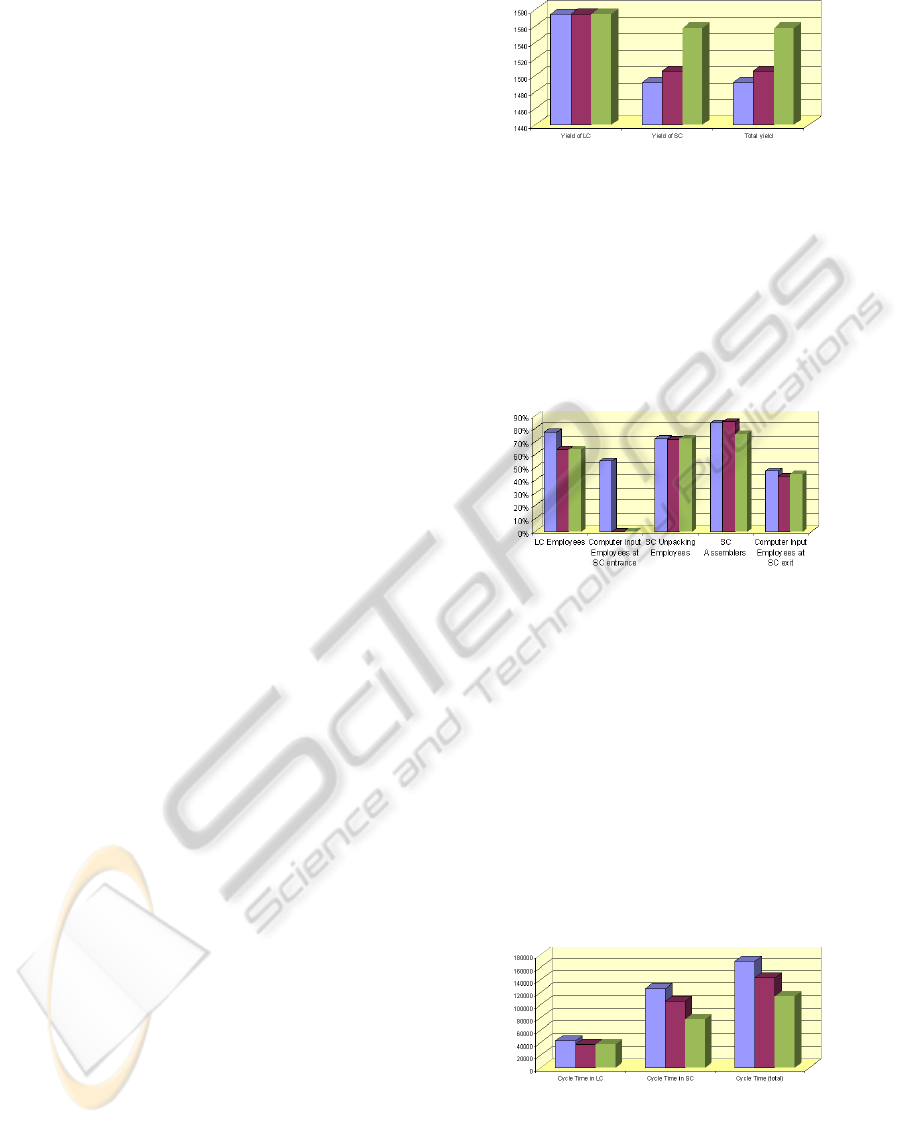
4.3.1 Yield
Figure 2 shows that LC yield increases in a very neg-
ligible manner in both RFID scenarios. While, SC
yield increases by 1% in the first RFID scenario and
Figure 2: Yield.
by 4% in the second RFID scenario (always as com-
pared to the baseline scenario). The total yield is the
same as SC yield since SC exit is the system exit.
These results were expected. Indeed, since RFID
shortens some processes, resources may be able to
fulfill more orders.
4.3.2 Resource Utilization
Figure 3: Resource utilization.
In Figure 3, we can see that, depending on the re-
source type, resource utilization can either increase
or decrease in RFID scenarios by comparison to the
baseline scenario. Indeed, some tasks are shortened
by using RFID but number of fulfilled orders in-
creases in RFID scenarios, as mentioned earlier in
yield section. These two contradictory trends explain
the obtained results. We can also see that perfor-
mances of the first and the second RFID scenarios are
close, except for assemblers (we recall that there is an
additional assembler in the second RFID scenario) .
4.3.3 Cycle Time
Figure 4: Cycle time.
In Figure 4 we can see that cycle times decrease in
both RFID scenarios. This is due to shorter process-
ing times enabled by RFID. LC cycle time decreases
by 13% in both RFID scenarios. SC cycle time decre-
SIMULTECH 2011 - 1st International Conference on Simulation and Modeling Methodologies, Technologies and
Applications
526
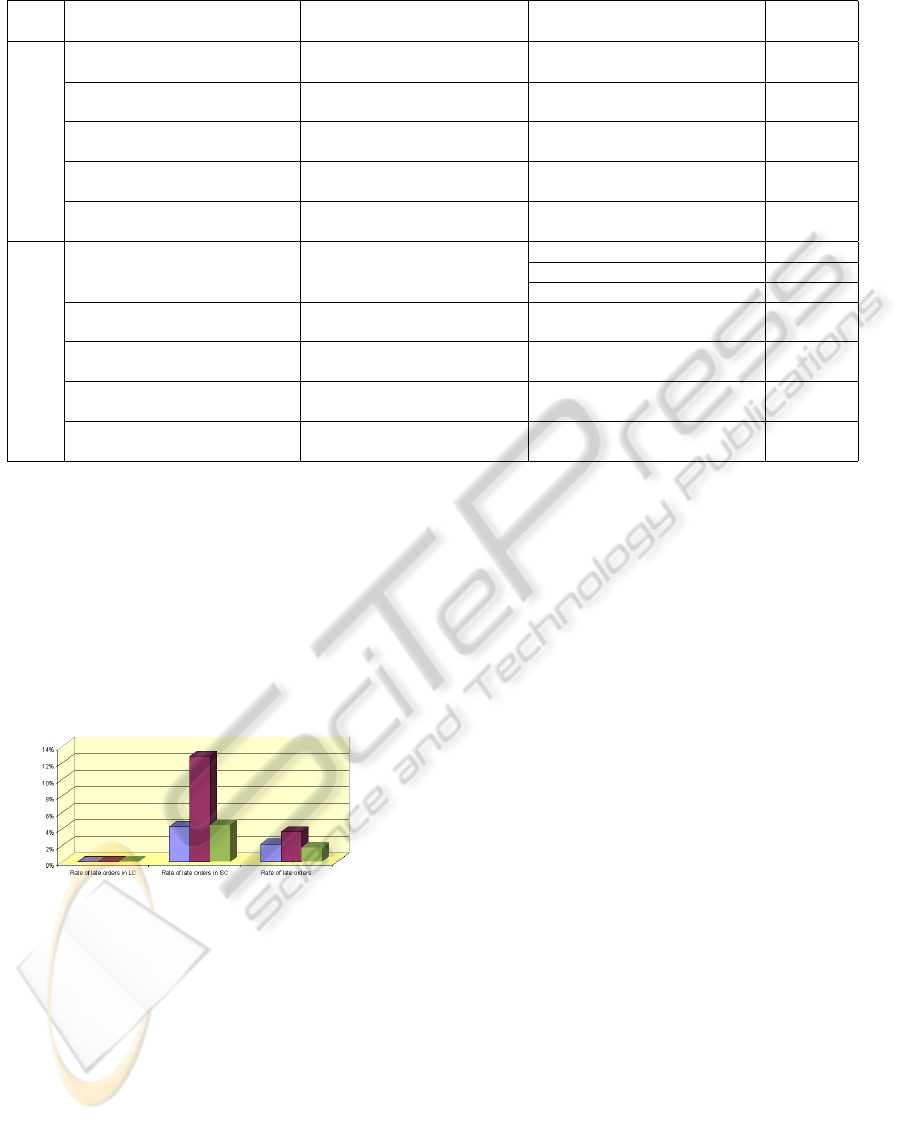
Table 1: Impacts of RFID on processes.
Building Change Where or when Numerical values RFID scenar-
ios
LC
Suppression of bar code reading At the entrance of LC Suppression of all computer input dura-
tion
1 & 2
Suppression of bar code reading Upon loading a pallet on a pallet truck
to be stored
Loading duration − 5sec 1 & 2
Suppression of bar code reading Upon unloading a pallet from a pallet
truck to be stored
Unloading duration − 5sec 1 & 2
Suppression of 2 bar code readings Upon loading a pallet on a pallet truck
to be picked
Loading duration − 2 × 5sec 1 & 2
Suppression of a part of process of
preparing
In the preparing area Preparing duration −60sec 1 & 2
SC
Suppression of computer input process At the entrance of SC
Suppression of the process duration 1 & 2
Suppression of a human resource 1
Reallocation of a human resource 2
Suppression of cutting of bar codes in
packaging process
During unpacking process Unpacking duration − 20sec ×
number o f items
1 & 2
Suppression of bar code reading At the exit of SC Computer input duration − 5sec ×
number o f items
1 & 2
Suppression of bar code reading Upon loading a pallet on a pallet truck
to be loaded in a shipping truck
Loading duration − 5sec 1 & 2
Suppression of bar code reading Upon unloading a pallet on a pallet
truck to be loaded in a shipping truck
Loading duration − 5sec 1 & 2
ases by 16% in the first RFID scenario and by 39%
in the second. Note that the use of RFID changes the
ratio between cycle times in LC and SC, indeed, SC
cycle time is more improved than LC cycle time. Re-
thinking the number of respective resources in LC and
SC may be necessary and may, enhance the effect of
RFID by using the same total number of resources.
4.3.4 Rate of Late Orders
Figure 5: Rate of late orders.
Figure 5 shows that there is no late orders in the
LC in all scenarios, while on the contrary, rate of late
orders in the SC increases from 4% in the baseline
scenario to 13% in the 1st RFID scenario and returns
to 4% in the 2nd RFID scenario. The increase of late
orders rate is certainly not desirable, but is due to in-
crease of yield (see Section about yield). We can still
notice that the second RFID scenario has equal per-
formance in terms of rate of late orders, with a higher
yield than the baseline scenario. The total rate of late
orders follows the same pattern as in the SC, with
smaller amplitudes (2%, 4% and 2% for baseline, first
and second RFID scenarios respectively). Notice that
late orders in the SC can still be fulfilled on time com-
pared to the overall objective of 5 days. This explains
why, the total rate of late orders is smaller than SC
one, in this case.
To conclude about results, for this system, and
with the chosen set of initial conditions, RFID en-
ables higher performance in terms of yield and cycle
time. But rate of late orders is deteriorated or remains
unchanged with RFID. Even though performances of
the second RFID scenario, on the chosen indicators,
are higher than those of the first RFID scenario, we
should keep in mind that, in the first scenario, a hu-
man resource is released and can be used in other ac-
tivities.
5 CONCLUSIONS AND FUTURE
WORK
In this paper we addressed the issue of RFID intro-
duction in a CTO environment. We developed a sim-
ulation model which is based on a real system, and we
assumed that RFID use can shorten processing times
and free some resources that can be reallocated. RFID
impact was estimated on different performance indi-
cators. Simulation results are yield increase by 2%,
cycle time decrease by 33% and rate of late orders
decrease by 21%.
(Cai et al., 2009) say that there is a gap between
application and research in supply chain performance
measurement and improvement. Therefore, this study
INTRODUCTION OF RFID TECHNOLOGIES IN A MANUFACTURING SYSTEM - A Discrete Event Simulation
Approach
527
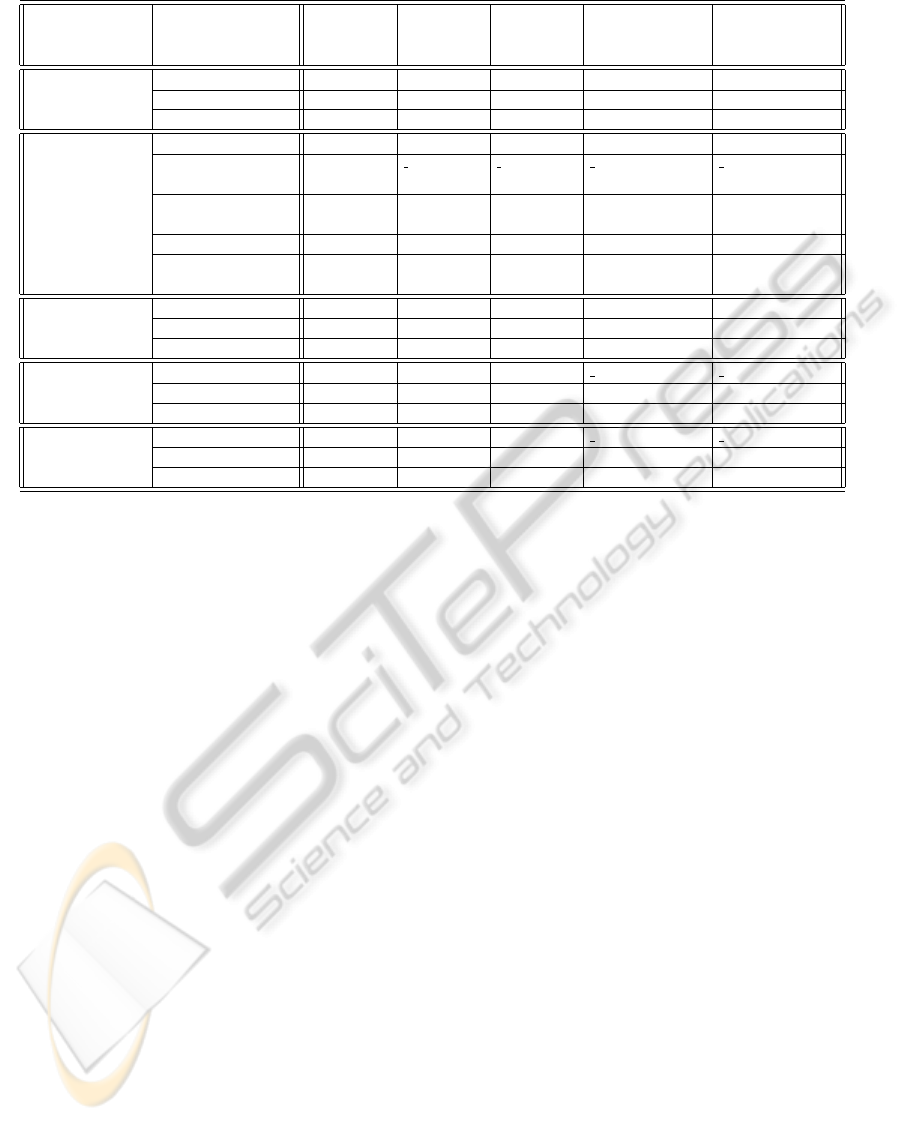
Table 2: Table of results.
Measure category Measure Baseline Sce-
nario
RFID 1st Sce-
nario
RFID 2nd
Scenario
Difference between
baseline and RFID
1st Scenario
Difference between
baseline and RFID
2nd Scenario
Yield
Yield of LC 1574 1575 1575 0% 0%
Yield of SC 1491 1505 1558 1% 4%
Total yield 1491 1505 1558 1% 4%
Resource Utilization
LC Employees 77% 64% 64% -17% -17%
Computer Input em-
ployees at SC entrance
55%
SC Unpacking Employ-
ees
72% 71% 72% -1% 0%
SC Assemblers 84% 85% 76% 1% -10%
Computer Input em-
ployees at SC exit
47% 43% 45% -9% -5%
Cycle Time
Cycle Time in LC 42403 36725 36722 -13% -13%
Cycle Time in SC 125357 104963 76906 -16% -39%
Cycle Time (total) 168890 142325 113789 -16% -33%
Late Orders
# of late orders in LC 0 0 0
# of late orders in SC 61 189 68 210% 11%
# of late orders (total) 30 52 24 76% -18%
Rate of Late Orders
Rate of late orders in LC 0% 0% 0%
Rate of late orders in SC 4% 13% 4% 199% 5%
Rate of late orders 2% 4% 2% 70% -21%
gives an estimation of the impact of introducing RFID
in a real system.
As mentioned in Section 2, the objectives of the
study are much larger than results presented in this
paper. Therefore, the study can be further extended,
on the one hand, regarding RFID, and on the other
hand, to address other issues such as resource alloca-
tion, activity reorganization and system performance
under different conditions (high demand, new types
of products...).
We saw, in this study, that RFID allows processing
time reduction, because of rapid tags reading. Never-
theless, we implicitly supposed that the manufacturer
prints the same number of tags no matter if they are
RFID or bar code ones. In the real system on which
this study is based, bar codes are already printed on
items packaging before being received by the man-
ufacturer. In addition, the latter prints a bar code tag
for each received lot of items during receiving process
and a bar code tag for each order during preparing
process. If an RFID technology is adopted, the manu-
facturer will print all RFID tags by himself. Tags for
lots of items and for orders will probably be printed
during the same processes as the current case. By con-
trast, tags on items are not compulsory but may sig-
nificantly increase flows visibility. Hence, if the man-
ufacturer decides to keep items tagging, the task may
be operated before storage or after destocking. We be-
lieve that this choice would influence system perfor-
mance in terms of cycle time and resource utilization.
For this reason, it can be interesting to investigate this
issue.
Another issue related to RFID is the Return On In-
vestment (ROI). Since cost and financial benefits are
key performance indicators in most industrial cases,
we plan to investigate this problem.
Few years ago, the manufacturer had an activity
of assembling which has been delocalized to another
country now. Therefore, there is some vacant space in
the SC building, and the manufacturer would like to
know if it will be effective to relocate logistic activity
in the same building as CTO activity. A scenario of
one building should be soon developed in the simula-
tion model. By comparison to the baseline scenario,
some processes will be modified, essentially, orders
preparing, shipping to the SC and computer input at
the entrance of SC.
In addition, the manufacturer wishes to measure
impact of processing new types of products. Obvi-
ously, some numerical values in the model will be
changed for this scenario (processing times, repairing
rate, orders’ number of items...), and some processes
may also be modified.
ACKNOWLEDGEMENTS
This work has been funded by DIRECTION
GENERALE DE LA COMPETITIVITE, DE
L’INDUSTRIE ET DES SERVICES under conven-
tion number 08 2 93 06 49.
SIMULTECH 2011 - 1st International Conference on Simulation and Modeling Methodologies, Technologies and
Applications
528

REFERENCES
Cai, J., Liu, X., Xiao, Z., and Liu, J. (2009). Improving
supply chain performance management: A systematic
approach to analyzing iterative KPI accomplishment.
Decision Support Systems, 46(2):512–521.
Housseman, S. (2011). Mod
´
elisation et aide
`
a la d
´
ecision
pour l’introduction de technologies communicantes
en milieu hospitalier. PhD thesis, Ecole Nationale
Sup
´
erieure des Mines de Saint-Etienne.
Housseman, S., Absi, N., Feillet, D., and Dauz
`
ere-p
´
er
`
es,
S. (2011). Impacts of radio-identification on cryo-
conservation centers. Transactions on Modeling and
Computer Simulation, 21(4):1–25.
Jimenez, C., Dauz
`
ere-p
´
er
`
es, S., and Feuillebois, C. (2010).
Optimizing the design of a global RFID system in air-
crafts. In ROADEF, pages 3–4, Toulouse, France.
Landt, J. (2005). The history of RFID.
Roberti, M. (2003). Analysis: RFID - Wal-Mart’s Network
Effect.
Rogers, E. M. (1962). Diffusion of innovations. The Free
Press.
Sarac, A. (2010). Mod
´
elisation et aide
`
a la d
´
ecision pour
l’introduction des technologies RFID dans les cha
ˆ
ınes
logistiques. PhD thesis, Ecole Nationale Sup
´
erieure
des Mines de Saint-Etienne.
Sarac, A., Absi, N., and Dauz
`
ere-P
´
er
`
es, S. (2010). A liter-
ature review on the impact of RFID technologies on
supply chain management. International Journal of
Production Economics, 128(1):77–95.
Vinatier, F., Chailleux, A., Duyck, P.-F., Salmon, F., Le-
scourret, F., and Tixier, P. (2010). Radioteleme-
try unravels movements of a walking insect species
in heterogeneous environments. Animal Behaviour,
80(2):221–229.
INTRODUCTION OF RFID TECHNOLOGIES IN A MANUFACTURING SYSTEM - A Discrete Event Simulation
Approach
529
