MANUFACTURING SIMULATION OF BEVEL GEAR CUTTING
Simulation based Approach for Tool Wear Analysis
Christian Brecher
1
, Fritz Klocke
2
,
Christof Gorgels
1
and Ario Hardjosuwito
1
1
Chair of Machine Tools, RWTH Aachen University, Steinbachstr. 19, D-52070 Aachen, Germany
2
Chair of Manufacturing Technology, RWTH Aachen University, Steinbachstr. 19, D-52070 Aachen, Germany
Keywords: Manufacturing Simulation, 3D Modelling, Gear Cutting Process, Tool Wear Analysis.
Abstract: The transmission of torque or speed from one axle to a non parallel orthogonal axle is realised by bevel
gears. Bevel gears are applied in helicopters, in marine, in rear axles of automotives and industrial drives.
The manufacturing of bevel gears is generally performed in a complex CNC cutting process. Due to
unpredictable tool wear in bevel gear cutting, unexpected production stops e.g. for tool changes occur. This
leads to additional manufacturing costs. Currently it is not possible to analyse the bevel gear cutting process
sufficiently, because of its complexity. Hence, the design of the cutting process happens iteratively in order
to find the best process parameters for a high productivity and optimal tool wear. Thus, an exact knowledge
of the tool wear behaviour is necessary. Hence, a manufacturing simulation for bevel gear cutting has been
developed at WZL. This simulation enables a detailed analysis of the process and consequently of the tool
wear. Within this report a new approach for the tool wear analysis is presented. Four different gear cutting
processes have been analysed regarding tool wear. The introduced new characteristic value K
G
, which is
calculated by the simulation, has been compared to tool wear from cutting trials. All the presented
investigations will be considered in a simulation-based tool life prediction model which will be developed
within a project funded by the German Research Foundation (DFG).
1 INTRODUCTION
The transmission of torque or speed from one axle to
a non parallel orthogonal axle is generally realised
by bevel gears. Bevel gears are applied in
helicopters, in marine, in rear axles of automotives
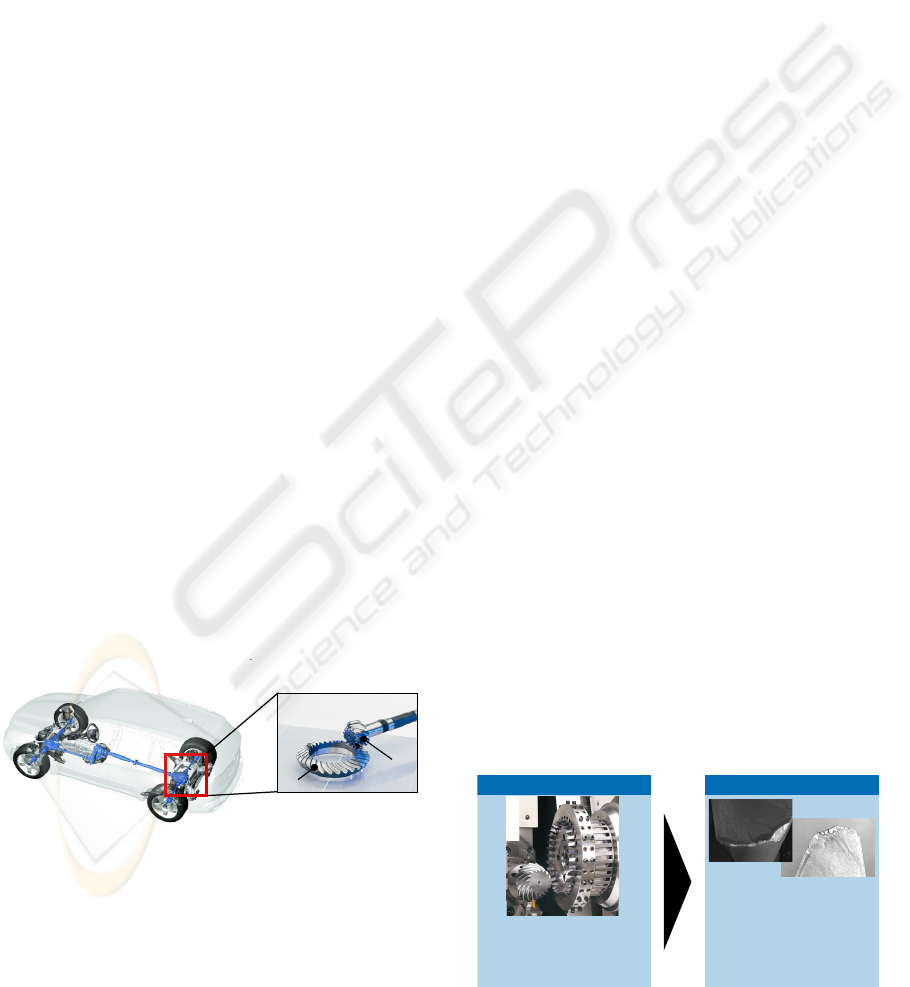
and industrial drives as shown in figure 1.
Source: BMW, ZF
Pinion
Ring Gear
Pinion
Ring Gear
Bevel Gears
Figure 1: Exemplary automotive application of bevel
gears.
The manufacturing of bevel gears is generally
performed in a complex Computerized Numerical
Control (CNC) cutting process.
Due to unpredictable tool wear and sudden
failure of the cutting tools, unexpected production
stops for tool changes occur and leads to a loss of
productivity and hence to additional manufacturing
costs. Thus, the productivity of the machining
process depends significantly on the tool wear and
tool life, see Chavoshi (2011). Currently it is not
possible to analyse the bevel gear cutting process
sufficiently, because of its complexity. Hence, the
design of the cutting process happens iteratively in
order to find the optimal process parameters. So an
exact knowledge about the tool wear behaviour is
necessary. These challenges and issues are presented
in figure 2.
Tool WearManufacturing Process
Complex Process Kinematics
– Plunging Process
– Generating Process
Different Tool Concepts
High Local Tool Wear
Critical Wear Behaviour
Low Process Stability
Æ
Production Stops
(e.g. Tool Changes)
Æ
Iterative Process Design
(trial-and-error)
Source: KlingelnbergSource: Klingelnberg
Figure 2: Challenges in bevel gear cutting.
513
Brecher C., Klocke F., Gorgels C. and Hardjosuwito A. (2011).
MANUFACTURING SIMULATION OF BEVEL GEAR CUTTING - Simulation based Approach for Tool Wear Analysis.
In Proceedings of 1st International Conference on Simulation and Modeling Methodologies, Technologies and Applications, pages 513-520
DOI: 10.5220/0003648605130520
Copyright
c
SciTePress
In order to provide a simulation tool for
analysing and optimising the bevel gear cutting
process a manufacturing simulation has been
developed at WZL, as presented by Brecher (2010)
and Rütjes (2010).
2 MODELLING AND
SIMULATION METHOD
Within the manufacturing simulation a geometrical
penetration is conducted as described by Klocke
(2009), Rütjes (2010) and Brecher (2010). Before
starting the calculation the workpiece, tool and
kinematics have to be modelled.
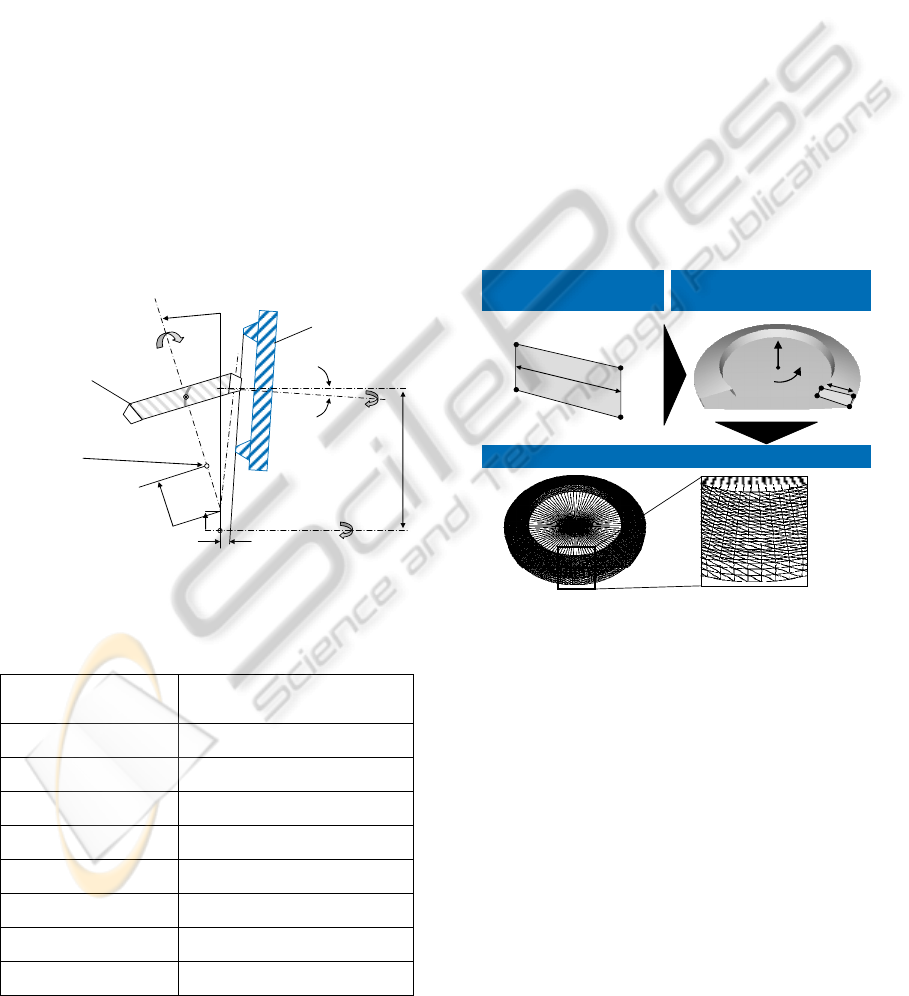
At first the process kinematics are set. The
kinematics of the bevel gear cutting process is
presented in figure 3. Up to 6 CNC axis, like in the
real cutting process, can be considered in the
simulation. In figure 2 and table 1 the axis
movements and positions of the bevel gear cutting
machine are presented.
mccp
Theoretical
Cross Axis
Point of Gear
Cutter Head
Workpiece
γ
β
ω
φ
α
χ
ε
η
τ
Figure 2: Scheme and axis movements of a bevel gear
cutting machine.
Table 1: Axis movements of the cutting machine.
Mccp
Machine center to cross axis
point
Cradle Angle
α
Modified Roll
β
Angular Motion
γ
Radial Motion
ϕ
Horizontal Motion
ε
Vertical Motion
η
Helical Motion
χ
Tool Rotation omega
For example the axis movement for the depth
position χ of the tool during the cutting process is
calculated by formula 1:
χ
= a
χ
+ b
χ
⋅
(
α
–
α
m
) + c
χ
⋅
(α–α
m
)
2
+ d
χ
⋅(α–α
m
)
3
+ e
χ
⋅(α–α
m
)
4
+ f
χ
⋅(α–α
m
)
5
+ g
χ
⋅(α–α
m
)
6
+ p
χ
⋅(ω–ω
m
) + q
χ
⋅(ω–ω
m
)
2
+
r
χ
⋅(ω–ω
m
)
3
+ s
χ
⋅(ω–ω
m
)
4
+ t
χ
⋅(ω–ω
m
)
5
+
u
χ
⋅(ω–ω
m
)
6
(1)
Here a series expansion up to the sixth order is
realised for the mean cradle angle α
m
. The variables
a
γ
to u
γ
represent the coefficients. E.g. the coefficient
a
γ
is a constant value therefore a positioning of the
cutter, whereas b
γ
is linear depending on the mean
angle α
m
which is time-dependent.
In the simulation the workpiece and the tool
envelope are modelled as 3D clouds of scattered
points. With these points a mesh is generated of
triangles for the workpiece and the tool. The
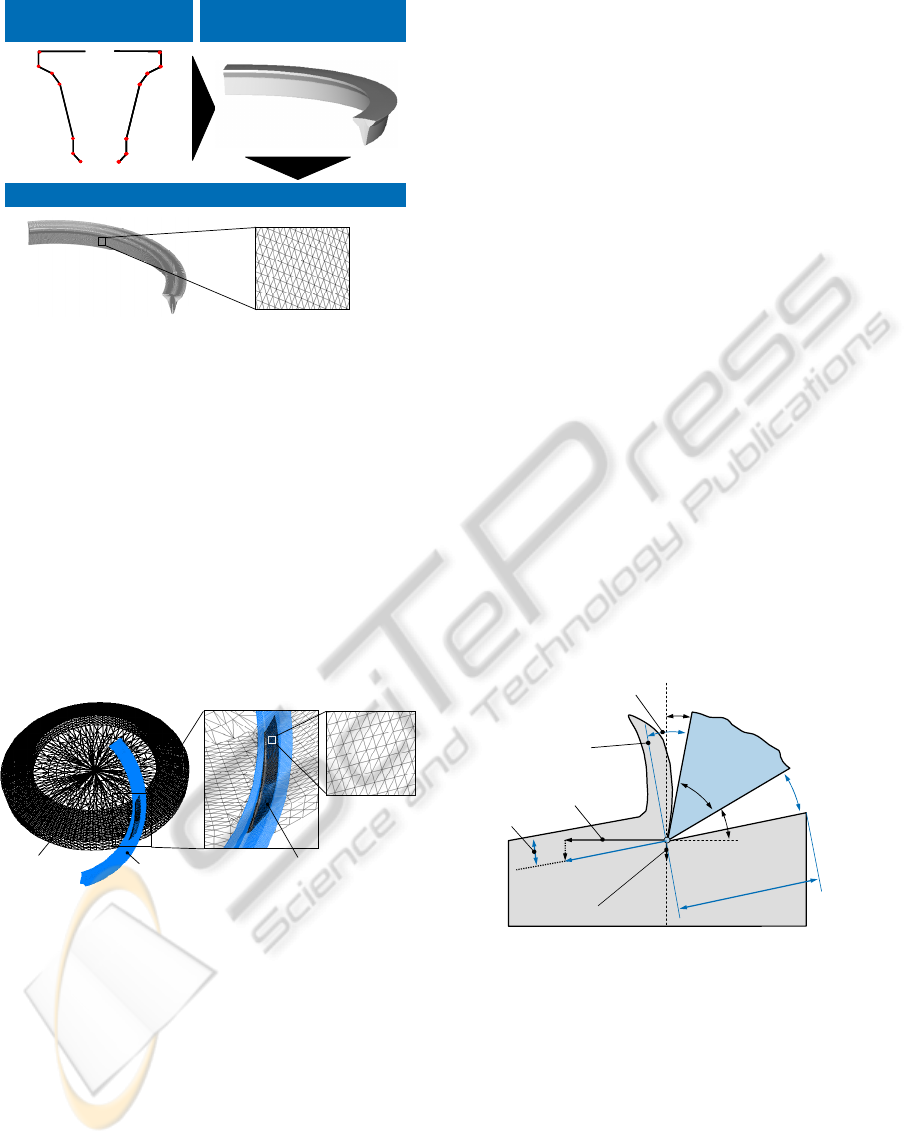
modelling of the workpiece can be described in three
steps, see figure 4. At first the cross section of the
gear flank is defined by 4 points.
1
2
3
4
Cross Section of the Gear
Flank
Extrusion of Cross Section
around the central axis
Cross Section of the Gear
Flank
Extrusion of Cross Section
around the central axis
Triangulation of Surface
b
heel
toe
bb
1
2
3
4
Figure 4: Modelling and triangulation of workpiece.
With the 4 points the gear width b and the toe
and the heel of the bevel gear are defined. The heel
is the face with the largest diameter respectively the
largest distance to the central axis and the toe is the
face with the smallest diameter. In order to get the
blank body of the gear the cross section is rotated
around the central axis. Finally this extruded body is
getting triangulated as described by Rütjes (2010).
Finally the tool envelope is modelled by an
extrusion of the tool profile depending on the
process kinematics, see figure 5. Like the workpiece
the tool is meshed by triangulation as well.
The data for workpiece, tool and process
kinematics can be imported in the software from a
ASCII file in the neutral data format. This data
format is a common one in gear industry and
developed by Klingelnberg (2008).
SIMULTECH 2011 - 1st International Conference on Simulation and Modeling Methodologies, Technologies and
Applications
514
Tool Profile Extrusion of Tool
(Enveloping Body)
Triangulation of Surface
2
3
4
5
6
7
8
9
10
11
12
13
14 1
2
3
4
5
6
78
9
10
11
12
13
14 1
Figure 5: Modelling and triangulation of tool.
When the modelling is finished a penetration
calculation can be conducted. During the
geometrical penetration calculation the bodies of
workpiece and tool envelope penetrate each other in
compliance with the kinematics. The penetration is
realised by ray-tracing as described by Akenine-
Möller (2002). The calculated penetration volume
can be interpreted as the undeformed chip geometry
resulting from the cutting process, see figure 6. With
this undeformed geometry different characteristic
values can be calculated. It has to be mentioned that
the penetration calculation is a geometrical
calculation, i.e. that no plastic deformations are
considered.
tool
enveloping
body
workpiece
penetrated volume =
undeformed chip
geometry
Figure 6: 3D penetration calculation of triangulated
surfaces.
In order to accelerate the penetration calculation
bounding-boxes and Binary Space Partitioning
(BSP) Trees are used as depicted from Akenine-
Möller (2002). A further approach to accelerate the
simulation is the calculation of the penetration by
General-purpose computing on graphics processing
units (GPGPU) as published from Wienke (2011)
where OpenCL, CUDA, PGI Accelerator are used in
combination with graphics processing units (GPU)
in order to increase the performance.
3 CALCULATION RESULTS
3.1 Characteristic Values for Process
Analysis
The chip thickness h
cu
and the working length l
e
are
characteristic values, besides the cutting forces, for
description and analysing the bevel gear cutting
process according to Klocke (2009) and Ruetjes
(2010), see figure 7. The chip thickness represents
the thickness of the undeformed chip at a certain
point on the cutting edge. The working length
represents the cutting path i.e. the contact length
between the tool and the workpiece during the
cutting. By means of these calculated characteristic
values a first analysis of the tool wear behaviour and
a process optimization is partly possible.
Current investigations from Klein (2007),
Klocke (2009) and Rütjes (2010) show that also the
characteristic values like the working rake angle γ
e
and relief angle α
e
have a significant influence on
the tool wear. Especially the flank wear of the tool is
not only influenced by the chip thickness h
cu
and the
working length l
e
, but also by the geometry of the
cutting edge. The cutter geometry, in turn, is
determined by the rake and relief angle of the cutter.
These angles are defined in the German Standards
DIN 6580 (1985) and DIN 6581 (1985).
cutting direction
feed direction
working rake angle γ
e
working relief
angle α
e
working
reference plane
working
direction
rake angle γ
tool reference plane
WORKPIECE
wedge
angle β
relief
angle α
w
o
r
k
i
n
g
l
e
n
g
t
h
l
e
TOOL
chip thickness h
cu
Figure 7: Calculable characteristic values.
As a conclusion it can be stated that there is
partly the possibility to analyse the tool wear by
means of the current characteristic values. But there
is no approach for a prediction of tool wear in bevel
gear cutting.
3.2 Gradient of Characteristic Values
In industrial application there are different tool
concepts. One of the concepts are the alternating half
profile blades. They are separated into outside and
MANUFACTURING SIMULATION OF BEVEL GEAR CUTTING - Simulation based Approach for Tool Wear Analysis
515
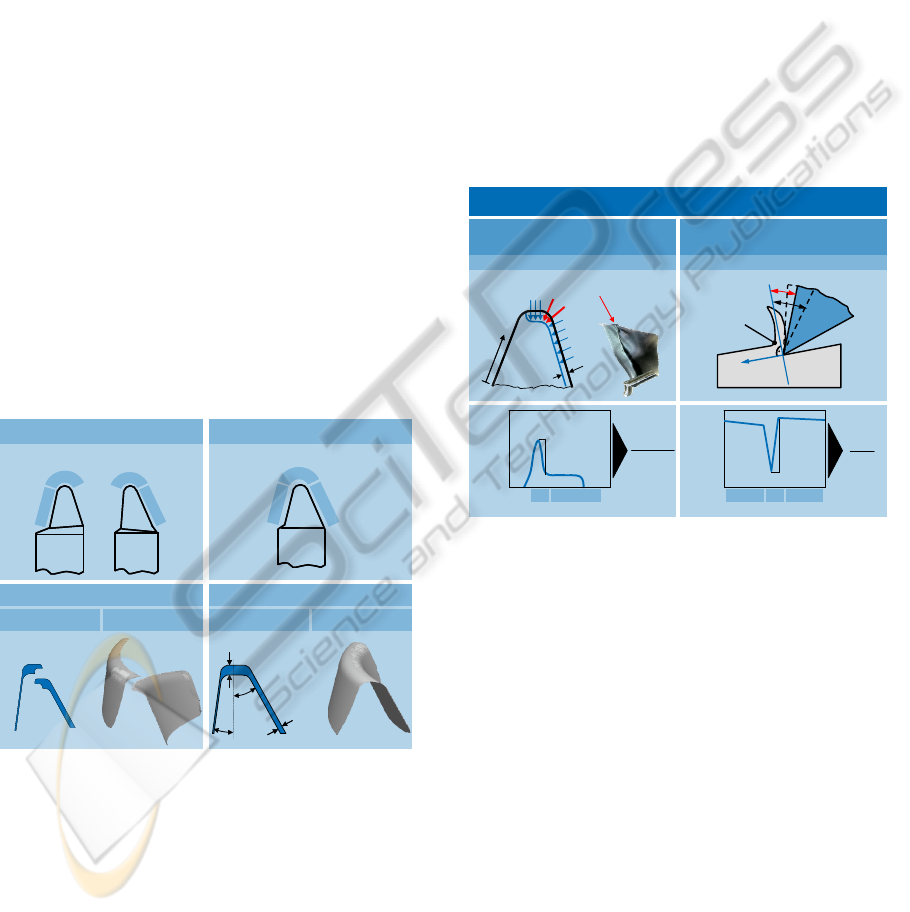
inside blades, see figure 8. Both blades are defined
as a blade group. One blade group cuts the contour
of one gap including gear root and flanks. The
outside blade cuts the concave flank and the inside
blade cuts the convex flank of the gear gap. From
this typical two-flank chips are cut. The removed
material on the flanks respectively the chip thickness
h
cu,flank
depends inter alia on the chip thickness on
the tip h
cu,tip
and the pressure angle δ
OB
or δ
IB
of the
tools:
h
cu,flan
k
= h
cu,ti
p
· sin(δ)
(2)
Besides the concept of alternating blades there is
the concept of full profile blades, where one blade
group consists of only one full profile blade. This
type of blades has a theoretical rake angle of γ = 0°.
The full profile blades cut both flanks (inside and
outside) at the same time. Thus, typical three-flank
chips are cut, as shown in figure 8 below right. The
advantage of this concept is the increased
productivity due to the possible increase of the
number of blade groups in the cutter head.
The chip thickness h
cu
is the most common
characteristic value for the analysis of the cutting
process according to Rütjes (2010). A higher
pressure angle δ results in a higher chip thickness on
the flank. The chip thickness itself depends on the
feed velocity per blade group.
Half Profile Blade
Two Flank Chips
theoretical calculated
Outside Blade Inside Blade
Three Flank Chips
theoretical calculated
Full Profile Blade
OB IB
FPB
δ
IB
h
cu,flank
h
cu,tip
δ
IB
I
B
T
I
B
T
O
B
I
B
O
B
I
B
T
O
B
T
O
B
T
Figure 8: Cutter separation of blades.
Within the investigations of Klein (2007)
regarding tool wear in bevel gear cutting, it became
clear that especially the corner radius is critical
regarding tool wear, e.g. chipping. This is caused by
the multi-flank chip-formation at the corner radius.
Here the material of the chip is compressed and
squeezed, see figure 9. Thus, a simple analysis of the
chip thickness in this area of the tool is not
sufficient.
It becomes clear that the chip thickness h
cu
is
varying along the cutting edge l
s
. Especially in the
transition area of the corner radius between the flank
(IB) and the tip (T) a gradient of the chip thickness
Δh
cu
/Δl
s
is visible.
The spatial compression of the chip is
determined by the pressure angle of the tool as
Klocke (2010) presented. In order to consider the
compression and squeezing of the chip in the
geometrical penetration calculation the gradient of
the chip thickness can be used. The gradient
represents the varying chip thickness along the
cutting edge l
s
. At the tool flank the gradient is zero
due to the not varying chip thickness. This is
plausible, because of the not existing compression of
the chip material referred to the rake face
respectively the working reference plane, see DIN
6581 (1985).
Characteristic Values for Chip Compression
tool
compression of
chip
rake face
chip flow
-γ
e
Δh
cu,m
Δl
s
chip thickness
h
cu,m
s
mcu,
l
h
Δ
Δ
+γ
e
workpiece
chip
Δγ
e
workingrakeangle
Δγ
e
s
e
l
Δγ
Δ
l
s
Working Reference Plane Working Cutter Plane
h
cu,m
Δl
s
cutting edge length l
s
cuttin edge length l
s
IBT OB IBTOB IBT
Gradient Chip Thickness
Δh
cu,m
/Δl
s
Gradient Working Rake Angle
Δγ
e
/Δl
s
Figure 9: Gradient of chip thickness and rake angle.
A higher compression of the chip results in a
higher thermal and mechanical load at the cutting
edge and the risk of tool wear.
Due to the spatial chip formation and
compression a consideration of only the working
reference plane is not sufficient. Even the working
cutter plane in which the chip flows orthogonal to
the rake face has to be considered according to
DIN 6581 (1985). Both planes take the working
direction of the cutter into account. For the
desription of the chip compression in the working
cutter plane the gradient of working rake angle
Δγ
e
/Δl
s
can be used, see figure 10. This characteristic
value represents the varying rake angle along the
cutting edge and thus the varying chip formation and
the chip compression along the cutting edge. A
rapidly changing gradient in a small area of the
cutting edge corresponds with a changing chip
formation and a varying load during the cutting. This
varying load has a negative influence on the tool
SIMULTECH 2011 - 1st International Conference on Simulation and Modeling Methodologies, Technologies and
Applications
516
wear behaviour. Hence, the gradient should have a
minimum value.
Besides the aspect of chip compression and the
so caused tool load further characteristic values for
analysing the cutting process can be used. The entire
working length l
e
describes the contact length, which
the cutter is in contact with the workpiece under
consideration of the working direction, see figure 10.
So the working length is an approach for the
description of the thermal and mechanical load on
the cutting edge. A higher working length results in
a higher temperature respectively friction and thus in
higher loads on the cutting edge.
Additionally the working relief angle α
e
can be
used for the analysis of the tool load. The working
relief angle influences the thermal stress on the
cutting edge. Thus the gradient Δα
e
/Δl
s
is a useful
characteristic value for the alternating thermal stress
along the cutting edge. The higher the gradient the
higher the alternating thermal stresses on the relief
face of the cutter. Hence, a minimum value of the
gradient is desirable.
Characteristic Values
Working Length l
e
Gradient Working Relief Angle
Δα
e
/Δl
s
tool
-α
e
entire
workinglengthl
e
+α
e
workpiece
chip
Δα
e
working relief angle
Δα
e
s
e
l
Δ
Δ
α
b
Δl
s
el
OB IBTOB IBT OB OBTOB OBT
cutting edge length l
s
cuttin edge length l
s
el
Figure 10: Working length and gradient of relief angle.
In order to integrate the presented characteristic
values in only one value the new characteristic value
K
G
is introduced:
cu e e
Ge
sss
h Δα Δγ
Kl
lll
Δ
=⋅ ⋅ ⋅
ΔΔΔ
(3)
A high K
G
value results in a higher tool load and
thus in higher tool wear. With the new characteristic
value K
G
a first qualitative comparison of different
processes and so of the tool wear is possible. From
this an optimization of the process is feasible and a
first approach for a qualitative tool wear prediction
model is realised.
In the future the characteristic value with the tool
wear model has to be modified by weighting in order
to enable a quantitative evaluation and prediction of
the tool wear.
4 TOOL WEAR ANALYSIS
Bevel gear drives consists of a pinion and a ring
gear. The pinion is positioned at the input driving
side and the ring gear at the output side of the rear
axle drive train. In general both parts are
manufactured in a process using cutter heads which
are equipped with stick-type blades. Here the face-
milling process, as described by Klingelnberg
(2008), is used for manufacturing. The plunging
process is mostly used for the manufacturing of the
ring gear whereas the generating process is used for
pinion manufacturing.
Following different case-studies regarding tool
wear of stick type blades in industrial application
will be presented. Here the tool wear behaviour in
plunging and generating process with different tool
concepts is compared to the new characteristic value
K
G
. In this report the focus is on the discontinuous
face milling process with tungsten carbide tools in
dry cutting.
4.1 Tool Wear Analysis of Plunging
Process
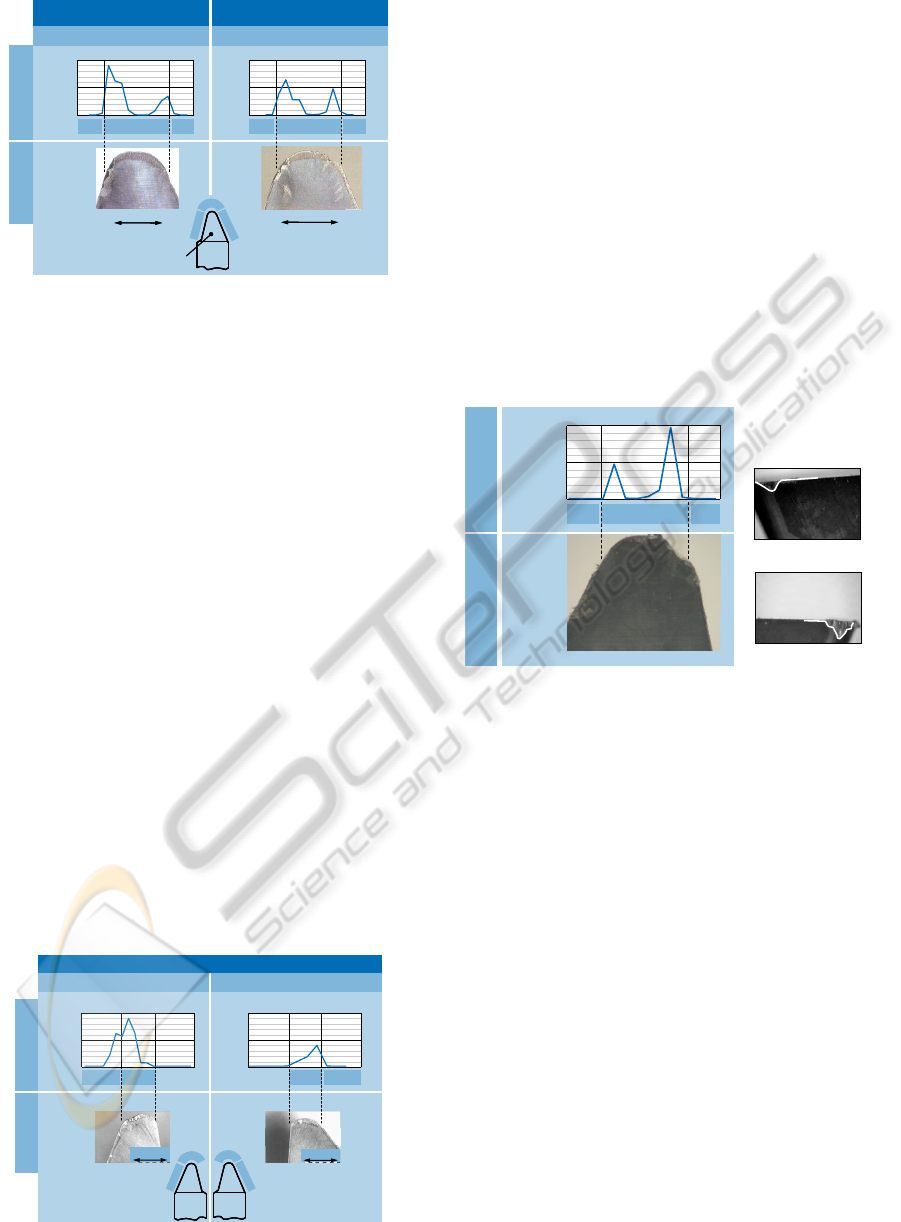
In figure 11 the tool wear of two full profile blades
are presented. They are used for plunging process 1
and 2 for ring gear manufacturing. In process 1 a
cutting velocity of v
c
= 200 m/min and a feed ramp
of f
BG
= 0.15 – 0.06 mm per blade group was used.
The cutter head with an outer diameter
D
a
= 231 mm. was equipped with 7 carbide tools.
The characteristic value K
G
was displayed in the
diagram over the unrolled cutting edge length l
s
which is separated into the outside blade (OB), the
tip area (T) and the inside blade (IB). The maximum
tool wear occures at the corner radius of the outside
blade (OB) to the tip area (T). In the simulation the
characteristic value K
G
has its maximum at the same
tool area. Additional tool wear occurs at the corner
radius of the inside blade (IB) and the tip area (T). In
this area the tool wear is less than at the other corner
radius. The same tendencies are calculated in the
simulation. Thus, the correlation of the calculated
value K
G
and the real tool wear is good. On the one
hand the maximum tool wear can be located by K
G
,
on the other hand the lower tool wear at the inside
blade can also be calculated.
In process 2, see figure 11 right, a cutting
velocity of v
c
= 150 m/min and a feed ramp of
f
BG
= 0.16 – 0.10 mm per blade group was chosen.
MANUFACTURING SIMULATION OF BEVEL GEAR CUTTING - Simulation based Approach for Tool Wear Analysis
517
Ring Gear
Manufacturing (Process 2)
Ring Gear
Manufacturing (Process 1)
3 mm3 mm
0
50
100
OB IBT
0
7.5
15
3 mm3 mm
OB IBT
Full Profile BladeFull Profile Blade
O
B
I
B
rake face
T
O
B
I
B
rake face
T
K
G
[deg²/mm]
K
G
[deg²/mm]
SimulationCutting Trial
Figure 11: Tool wear analysis of full profile blades.
The cutter head with an outer diameter
D
a
= 165 mm was equipped with 14 carbide tools.
Here the correlation between the tool wear from
cutting trial and the simulation is also good. The
maximum tool wear occurred at the corner radius of
the outside blade (OB) and the tip (T). Even the tool
wear in the corner radius of the inside blade (IB) can
be determined by the simulation. In this example the
tool wear is similar in both corner radii compared to
process 1, where the amount of tool wear is very
uneven. This tool wear behaviour is predictable with
the simulation by means of the characteristic value
K
G
.
In addition to full profile blades there is the
concept of alternating half profile blades. In order to
show the good correlation between the cutting trial
results and the simulation results the tool wear and
the characteristic value K
G
are presented in figure
12. Here (process 3) the focus is not only the
localization of the maximum tool wear at the cutting
edge but also the identification of the most critical
blade regarding tool wear. The maximum value for
K
G
was calculated at the corner radius of the outside
blade (OB). This correlates well with the occurred
tool wear from the cutting trials. Even the lower tool
wear of the inside blade (IB) was calculated
correctly.
Ring Gear Manufacturing (Process 3)
Inside Blade (IB)Outside Blade (OB) Inside Blade (IB)Outside Blade (OB)
O
B
T
O
B
T
I
B
T
I
B
T
IBTip
3 mm3 mm
OB Tip
3 mm3 mm
0
75
150
0
75
150
K
G
[deg²/mm]
K
G
[deg²/mm]
SimulationCutting Trial
Figure 12: Tool wear analysis of half profile blades.
4.2 Tool Wear Analysis of Generating
Process
Generally pinions are manufactured by a generating
process. The tool and the workpiece are moving
during the cutting depending on the process
kinematics. In process 4 a feed ramp of v
w
= 8.72 -
12.4 °/s and a cutting velocity of v
c
= 230 m/min
have been used. The outer diameter of the cutter
head has been D
a
= 268 mm and was equipped with
32 carbide full profile blades. In this process a
generating from heel to toe is conducted. In figure
13 the occurred tool wear on the full profile blade is
shown. It is visible that the maximum tool wear is
located at the corner radius of the outside blade
(OB). Here a chipping is observed. The tool wear at
the inside blade is about 50% of the maximum wear.
0
125
250
IB OBTip
K
G
[deg²/mm]
Simulation
Cutting Trial
0
125
250
IB OBTip
K
G
[deg²/mm]
Simulation
Cutting Trial
Inside Blade (IB)
Outside Blade (OB)
Figure 13: Tool Wear Analysis for Pinion Manufacturing
with new characteristic value K
G.
A comparison of the real tool wear in generating
process with the calculated characteristic value K
G
is
presented in figure 13, left. The calculation results
correlate well with the tool wear from the cutting
trials. Not only the location of the tool wear
correlates well with the characteristic value K
G
but
also the amount of tool wear.
The presented results show that now it is
possible to analyse the occurring tool wear with only
one characteristic value. Thus it is not necessary any
more to analyse the cutting process regarding tool
wear by applying and analysing many different
characteristic values, like the chip thickness or the
working tool angles, which often do not correlate
with the tool wear.
4.3 Case Study: Optimal Tool Concept
Within this report different tool concepts have been
presented. Process 1 (full profile blades) and 3 (half
profile blades) differ in the tool concept. But the
manufactured geometry of the ring gear is the same.
SIMULTECH 2011 - 1st International Conference on Simulation and Modeling Methodologies, Technologies and
Applications
518
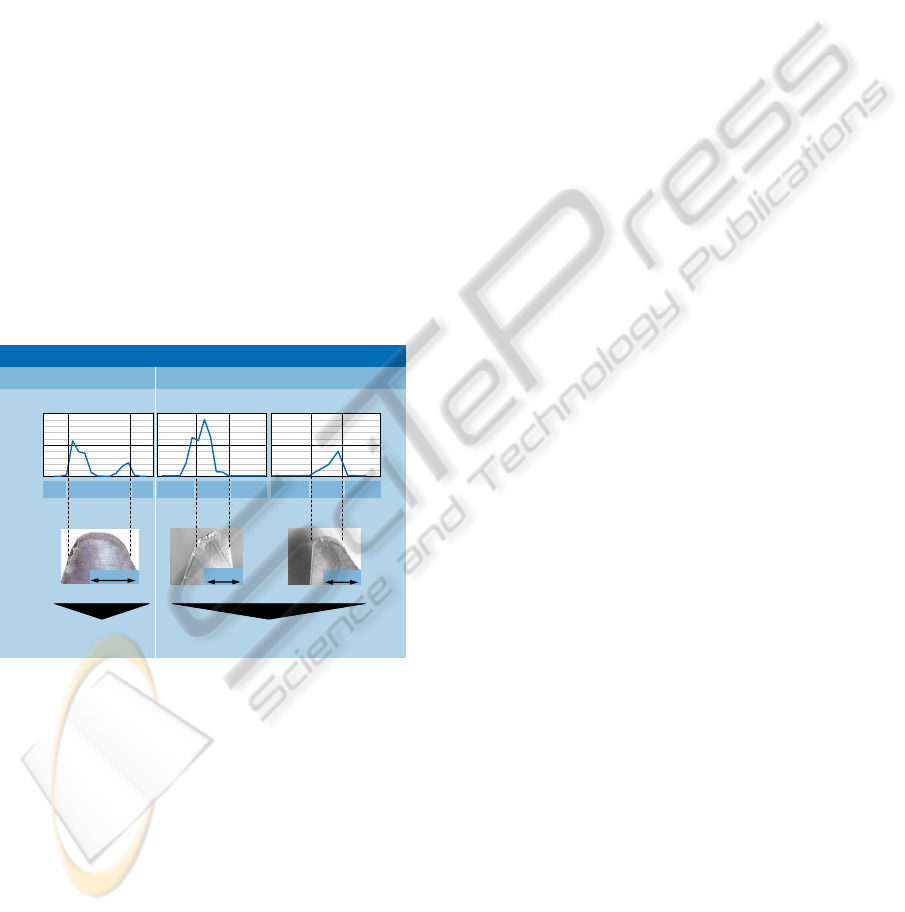
Not only is the ring gear the same, but also the
productivity. This means e.g. that the cutting and
feed velocity is the same and the number of blade
groups of the full profile concept is reduced to 50%.
This reduction is possible, because the number of
active cutting edges is the same for 14 half profile
blades and 7 full profile blades.
Now it is interesting to know which concept is
the best for the presented application. A comparison
of process 1 (full profile blades) and process 3 (half
profile blades) by means of the characteristic value
K
G
has been done, see figure 14.
The comparison of the calculated characteristic
value K
G
for the two processes shows that the
maximum tool wear appears at the outside blade
(OB) of the half profile blade concept. The value of
K
G
at the outside blade has approximately the double
magnitude of the value of the full profile blade. The
tool life of the full profile blade has been to
L = 500 workpieces whereas the tool life of the half
profile blades has been to L = 400 workpieces. Thus
there is a good correlation between the characteristic
value K
G
and the tool wear but there is also a good
correlation between K
G
and the tool life of the
different tool concepts.
Ring Gear Manufacturing (Process 1 vs. Process 3)
Full Profile Blade
OB IBT
3 mm3 mm
OB IBT
3 mm3 mm
OB IBT
3 mm3 mm
tool life outside blade
L = 400 workpiece
tool life
L = 500 workpiece
Half Profile Blade
K
G
[deg²/mm]
0
75
150
Figure 14: Comparison of different tool concepts
It can be stated that the manufacturing
simulation including the calculation of the new
characteristic value K
G
allows for the first time
analysing the bevel gear cutting process regarding
the expected tool wear. In the future the quantitative
prediction of tool life within a tool life model will be
realised.
5 CONCLUSIONS
Within this report the manufacturing simulation for
bevel gear cutting has been presented. At first the
modelling of the workpiece and the tool are
conducted. Under consideration of the process
kinematics the simulation can be conducted. Within
the simulation a 3D penetration calculation of
workpiece and tool are carried out. From the
penetrated volume the undeformed chip geometry
can be calculated. With information from this
penetrated volume different characteristic value like
the chip thickness can be derived. With these values
a first analysis of the cutting process regarding tool
loads and wear is possible. Unfortunately, there is
often no correlation between these values and the
expected tool wear.
Currently a new characteristic value for the tool
wear analysis is developed and implemented in the
manufacturing simulation. This new value includes
the gradient of different calculated characteristic
values over the cutting edge like the gradient for the
chip thickness Δh
cu
/Δl
s.
This gradient, for example,
represents the compression and squeezing of the
chip over the cutting edge. Thus, this value can be
used for the analysis of the tool load at the cutting
edge.
The comparison of the calculated new
characteristic value and the tool wear from cutting
trials show good correlations. The localization of
tool wear as well as a qualitative comparison of
different processes regarding the expected tool life is
possible. E.g. the tool life behaviour of full profile
blades and half profile blades correlates well with
the simulation results.
In the future the new characteristic value has to
be modified in order to quantify the expected tool
life. This, for instance, can be applied for increasing
the productivity of the cutting process and for
optimising the process design regarding tool
changes. Thus, the development of a tool life model
for the bevel gear cutting process has to be realised.
This tool life model has to be implemented in the
manufacturing simulation.
ACKNOWLEDGEMENTS
The authors would like to thank the German
Research Foundation (DFG) for supporting the
presented works, which are part of the research
project KL 500/89-1 “Methodik zur Vorhersage der
Werkzeugstandzeit bei Fertigungsprozessen mit
Mehrflankenspänen am Beispiel des
Kegelradfräsens”.
MANUFACTURING SIMULATION OF BEVEL GEAR CUTTING - Simulation based Approach for Tool Wear Analysis
519

REFERENCES
Akenine-Möller, T., Haines, E., 2002, Real-time
Rendering. 2
nd
Edition, AK Peters, Massachusetts.
Brecher, C., Klocke, F., Gorgels, C., Hardjosuwito, A.,
2010. In International conference on gears.
Simulation based tool wear analysis in bevel gear
cutting. VDI, Düsseldorf, pp 1381–1384.
Chavoshi, S., 2011. In Production Engineering – Research
and Development, Tool flank wear prediction in CNC
turning of 7075 AL alloy SiC composite. Volume 5,
Number 1, pp 37-47.
N. N. 1985. Bewegungen und Geometrie des
Zerspanvorgangs. German Standard DIN 6580.
N. N. 1985. Bezugssysteme und Winkel am Schneidteil des
Werkzeuges. German Standard DIN 6581.
Klein, A.; 2007. Spiral Bevel and Hypoid Gear Tooth
Cutting with Coated Carbide Tools, Dissertation
RWTH Aachen University.
Klingelnberg, J., 2008. Kegelräder – Grundlagen und
Anwend-ungen, Springer-Verlag, Berlin Heidelberg.
Klocke, F., Brecher, C., Gorgels, C., Hardjosuwito, A.,
2009. In KT2009 – 7. Gemeinsames Kolloquium
Konstruktionstechnik. Modellierung und Simulationen
zum Kegelradfräsen – Analyse der
Werkzeugbelastung. Bayreuth pp 187-194.
Klocke, F., Gorgels, C., Herzhoff, S., Hardjosuwito, A.,
2010. In 3
rd
WZL Gear Conference. Simulation of
Bevel Gear Cutting, Boulder, USA.
Rütjes, U., 2010. Entwicklung eines Simulationssystems
zur Analyse des Kegelradfräsens, Dissertation RWTH
Aachen University
Wienke, S., Plotnikov, D. an Mey, D., Bischof, C.,
Hardjosuwito, A., Gorgels, C., Brecher, C., In
International Supercomputing Conference, Special
Issue Paper. Simulation of bevel gear cutting with
GPGPUs—performance and productivity. Springer,
Berlin.
SIMULTECH 2011 - 1st International Conference on Simulation and Modeling Methodologies, Technologies and
Applications
520
