
PERSONAL ADVANCED TRAVELER ASSISTANT
Andreea Radu
1
, Leon Rothkrantz
1,2
and Mirko Novak
3
1
Department Man Machine Interaction, Delft University of Technology, Mekelweg 4, 2628 CD, Delft, The Netherlands
2
Department of SEWACO, The Netherlands Defence Academy, Den Helder, The Netherlands
3
Faculty of Transportation Sciences, Czech Technical University, Prague, Czech Republic
Keywords: Dynamic routing, Predicting travelling time, Personal assistant, Hand-held devices.
Abstract: In spite of numerous road management schemes and developed infrastructure the society nowadays still
faces the problem of highly congested roads due to the increasing traffic demand. The focus of this paper is
to develop a complex and integrated system that addresses the challenges of dynamic traffic assignment in
modern times. We built a design for a Personal Advanced Traveller Assistant (PTA). The main purpose of
PTA is to give routing advices depending on the users preferences and the available capacity in the network.
The system incorporates a dynamic traffic algorithm that employs a prediction model of future travelling
time. The prediction model that the algorithm uses is based on historical data. To conclude, we successfully
implemented a working prototype that uses various technologies such as Java, the Open Street Map API for
rendering the map or J2ME for the mobile phone client.
1 INTRODUCTION
In July 2007 the Federal Highway Administration
and National Cooperative Highway Research
Program in US sponsored a scanning study to
examine congestion management programs and
policies in Europe (Dantzig, 1957). This program
included four countries: Denmark, England, The
Netherlands and Germany. The focus was on the
traffic parameters and on the measures for the
deployment of congestion.
The traffic growth in The Netherlands is about 3
percent per year. In order to show some statistics,
The Netherlands reports congestion costs of 0.8
MEuro per year. The accessibility of main ports is
also affected. There is a critical need for traffic
congestion management.
From 1989 onwards, various traffic management
measures were implemented, starting from
motorway traffic management systems to overtaking
prohibitions for trucks and special police teams for
rush hours. The efforts undertaken so far to improve
the existing traffic network through traffic
management schemes by the government in The
Netherlands are the following, see Figure 1 and
Figure 2: Queue warning; Speed Harmonization;
Temporary Shoulder Lane use; Dynamic Lane
marking.
The dynamic nature of traffic can be observed in
both temporal and spatial changes in the traffc
demand, roadways capacity and traffic control
parameters. The traffic demand increases over time
until peak periods, it varies stochastic during the
peak hours and decays at the end of peaks.
A great part of the congestions are regular and
recurring at certain locations of the freeway network
and also at certain hours. These add up with the
incidents, the road maintenance fields, the weather
conditions and special events that impact traffic.
Most GPS devices that people own, when
requested a route, provide a solution based on the
minimum distance. People usually hear on the radio
if there is an incident or if there is something special
happening on the motorways. But then they have to
estimate themselves which alternative route they
should choose, how much extra time they have to
spend, whether a certain alternative is the most
convenient one and so on.
How can we best define the dynamic traffic
assignment? It can be described by the process of
dynamically selecting a path made out of roadway
segments from a trip origin to a trip destination
depending on a cost function. The cost function is
usually the travelling time.
74
Radu A., Rothkrantz L. and Novak M..
PERSONAL ADVANCED TRAVELER ASSISTANT.
DOI: 10.5220/0003648800740082
In Proceedings of the 8th International Conference on Informatics in Control, Automation and Robotics (ICINCO-2011), pages 74-82
ISBN: 978-989-8425-75-1
Copyright
c
2011 SCITEPRESS (Science and Technology Publications, Lda.)
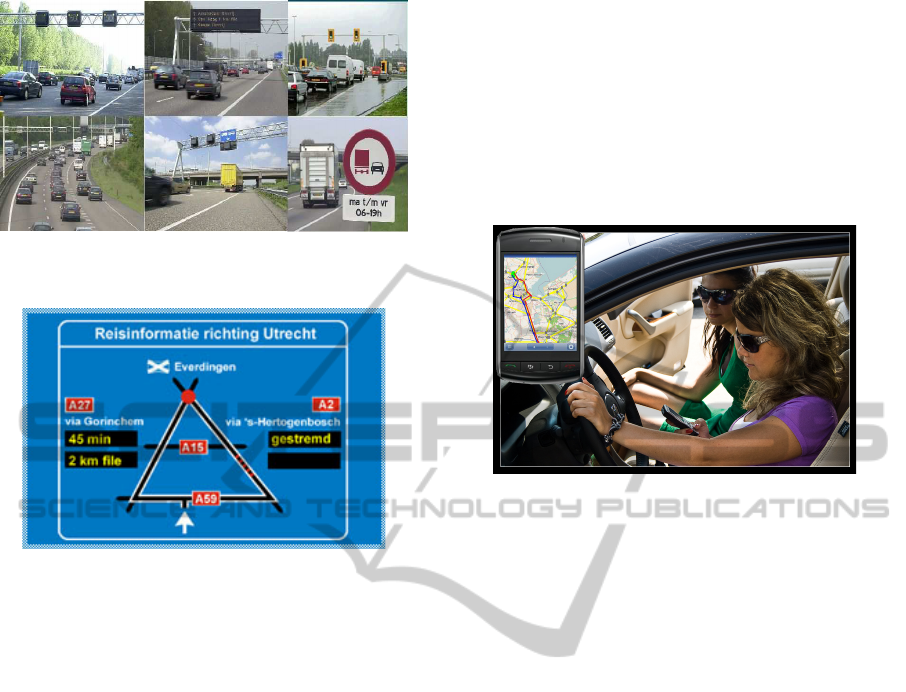
Figure 1: Examples of traffic management measures in
The Netherlands.
Figure 2: Dynamic route information.
The complexity of traffic management is due to
the interaction of three main processes (Kemer,
2004):
the traveller’s decision behaviour, as the decisions
of drivers influence the outcome of the traffic
network;
the dynamic traffic assignment in a traffic
network;
the traffic flow behaviour, in particular when
incidents and accidents occur in the network.
One approach to solve the congestion issues and
though to reduce the travel time for individuals is to
develop a route planner that incorporates current and
future traffic information when searching for the
best route. When congestions or incidents occur on
this route the planner has to compute the best
alternative solution which may lead the driver on
different roads or to a train station. The main
purpose is to minimize the travelling time by taking
into account the changes and the future situation in
the traffic network. In this area the personal
advanced travelling assistants play a crucial role.
Such an assistant has multiple functions including
that it computes the shortest travelling time-routes
based on current information received from traffic.
Within the research program Seamless
Multimodal Mobility at Delft University a Personal
Intelligent Traveller Assistant (PITA) has been
designed.
The outline of the paper is as follows. In the next
section we will describe related work on dynamic
routing. Next we will describe the used databases of
historical travel times. Next to open sources we used
to build our prototype. Then we describe the main
part the dynamic routing algorithm. We report some
experimental results and end up with a conclusion.
Figure 3: Car drivers use PITA to plan a trip.
2 RELATED WORK
Traffic assignment is defined as the problem of
finding traffic flows given an origin-destination trip
matrix and a set of costs associated to the links. One
solution for this problem is either that the driver
drives on the optimum path according to his
preferences, known as the User Equilibrium (UE)
assignment or alternatively the path that minimizes
the overall network's travelling time, known as the
System Optimum (SO) assignment.
(Wardrop, 1952) was the first one to differentiate
the two methods. A spectacular example that
actually shows that the UE assignment is in general
different from the SO solution is the Braess network.
The mathematician Dietrich Braess obtained the
paradoxical result that the addition of an arc to the
network can result in increased origin to destination
and overall travel cost. (Fisk, 1979) studied the
Braess paradox more in detail. She presented the
sensitivity of travel costs to changes in the input
flows while they are in Wardropian equilibrium.
Examples which state the fact that an increased
capacity of the input flow can decrease the travelling
time are presented.
Non-equilibrium methods assign traffic to a
single minimum path between two zones. The
minimum path infers the minimum travel time.
Minimum path algorithms include for example the
models developed by (Dantzig, 1957) and (Dijkstra,
PERSONAL ADVANCED TRAVELER ASSISTANT
75

1959). Other non-equilibrium methods include
diversion models, multipath assignments and
eventually combined methods.
Equilibrium methods are algorithmic approaches
which assume equal travel times. They are optimal
assignments since they are formulated on the basis
of linear or nonlinear mathematical programming
(Matsoukis, 1986). The user optimum equilibrium
can be found by solving a nonlinear programming
problem.
When a time dimension is added at the models
previously described then the DTA is obtained.
Thus, by including temporal dimensions we can
represent the real life traffic situation and compute
the traveling time. Literature surveys in this field
generally mention two main approaches for DTA:
the analytical-based models and the simulations.
The first approach which is the analytical-based
approach model considers two time indices: the time
at which the path flow leaves its origin and the time
at which it is observed on a link. In other words, the
approach assumes that the whole time is divided in
intervals. Then, static mathematical analytical
control models are applied to each interval, on the
assumption that one interval is long enough so that
drivers can complete the trip within that certain time
interval.
Literature within this area of research is
extensive. DTA has evolved a lot since the work of
Merchant and Nemhauser (Merchant and
Nemhauser, 1978) who considered a discrete time
model for dynamic traffic assignment with a single
destination. The model they assumed was nonlinear
and non-convex.
Meantime, researchers became aware that DTA
theory was still undeveloped and necessitated new
approaches to account for the challenges from the
application domain. DTA comes across a large set of
problems depending on various decision variables,
possessing varying data requirements and
capabilities of control.
The second approach is the simulation-based
model. This approach simulates the behaviour of the
drivers in different traffic settings. Due to their
capability of better representing the real world they
increased their popularity. Simulations usually try to
replicate the complex dynamics of the traffic.
Although that this is considered a different
approach, the mathematical abstraction of the
problem is a typical analytical formulation.
Next we consider some analytical-based
approaches and mathematical programming models
for DTA from literature. (Ziliaskopoulus, 2000) split
the analytical models from literature in four broad
methodological groups where the first ones are the
mathematical programming formulations. Within
this approach flow equations are deducted and a
nonlinear mathematical programming problem has
to be solved. (Merchant and Nemhauser, 1978) and
(Ho, 1980) studied such models. Due to the
complexity of a nonlinear problem, a linear version
of the model with additional constraints can be
created and solved for a global optimum using a
simplex algorithm. The linear program has a
staircase structure and can be solved by
decomposition techniques.
In optimal control theory the routes are assumed
to be known functions of time and the link flows are
considered continuous functions of time. The
constraints are similar to the ones at the
mathematical programming formulation, but defined
in continuous-time setting. This results in a
continuous control formulation and not in a discrete-
time mathematical program. (Friesz et al., 1989)
discuss two continuous link-based time formulations
of the DTA for both the SO and UE objectives
considering the single destination case. The model
assumes that the adjustments of the system from one
state to another may occur while the network
conditions are changing. The routing is done based
on the current condition of the network but it is
continuously modelled as conditions change. The
SO model is a temporal extension of the static SO
model and proves that at the optimal solution the
costs for the O-D used paths are identical to the ones
on the unused paths. They established as well a
dynamic generalization of the well known
Beckmann's equivalent optimization problem.
Simulation environments address key issues of
the traffic assignment, such as the flow's propagation
in time and the spatio-temporal interactions.
Contemporary DTA models were developed using
different traffic simulators (such as CONTRAM
(CONtinous TRaffic Assignment Model),
DYNASMART or SATURN etc.). SATURN, (Vliet
and Willumsen, 1980) is an early DTA simulation
tool that uses an equilibrium technique.
The CONTRAM, (Taylor, 1980) simulation
environment is more dynamic than the previous ones
as it allows the re-routing of cars if traffic conditions
worsen. However, it does not consider a maximum
storage capacity for roads and it assigns cars only
based on the Wardropian principle. DYNASMART
is a contemporary DTA model which uses the basic
CONTRAM concept. (Abdelfatah and Mahmasanni,
2001) show an example of a DTA model developed
by the DYNASMART approach.
(Lum at al., 1998) showed that the average speed
ICINCO 2011 - 8th International Conference on Informatics in Control, Automation and Robotics
76
depends on the road's geometry, on the traffic flow
characteristics and on the traffic signal coordination.
A new travel time-density model was formulated by
incorporating the minimum-delay per intersection
and the frequency of intersections as parameters.
The travelling time and the traffic volume are two
main field items that have to be considered for the
speed flow study along arterial roads.
Most influencing factors that have been cited in
literature are the special incidents and holidays,
signal delays, weather conditions and the level of
congestion. The prediction error might be also
directly proportional with the length of the
forecasting period (Kisgy and Rilett, 2002).
Most of the short-term forecasting methods that
were used in literature can be divided in two
categories, namely regression methods and time
series estimation methods. A third category can be
described as combining these two. Relevant
forecasting techniques examples which belong to
previous research studies are presented in the
following paragraphs. The type of traffic data that
was used along with possible inconveniences that we
detected is included.
(Hobeika and Kim, 1994) constructed three
models for short-term traffic prediction by
combining the current traffic, the average historical
data and the upstream traffic. (Li and McDonald,
2002) use GPS equipped probe vehicles and
determine mean speed values in order to develop a
fuzzy mathematical travel time estimation model.
Time series analysis is as well a popular method to
infer the travel time prediction due to their strong
potential for on-line implementation. (Ishak et al.,
2002) describe a short-term prediction model for
speed that follows a nonlinear time series approach
and uses a single variable.
In review of literature, researchers have used
parametric models in order to forecast the travel
time, such as regression models or time series and
nonparametric models that include ANN models (Yu
et al., 2008), (Lint et al. 2005). Studies have shown
that Ann’s (including modular neural network model
and state space neural network model) is a powerful
tool to predict travel time on freeways (Lint et al.,
2005). (Yu et. al., 2008) proposed a travel time
prediction model which comprised two parts: a base
travel time and a travel time variation. The first term
is computed using a fuzzy membership value
average of the clustered historical data that reflects
the traffic pattern. The variation is predicted through
a cluster based ANN in order to capture the traffic
fluctuation.
3 DATA
Historical data may consist of single vehicles
trajectories or it may be in the form of databases of
traffic variables measurements recorded at spots on
the roadways. The broadcasters along the roadways
identify and report the travelling speed of vehicles at
fixed time intervals, the number of vehicles or the
congestion level. But most of the traffic
measurements infer the travelling speed, which is
most important for detecting the travelling time.
The raw data is processed in order to obtain
traffic indicators, such as the average speed or the
congestion level on the roads at fixed intervals.
Missing data is usually computed by interpolation
from the surrounding data (if it does not exceed a
certain interval). Other problems might come up at
the analysis stage because if the recordings are not
done for each lane there are differences between
trucks (which have a different speed limit) and cars.
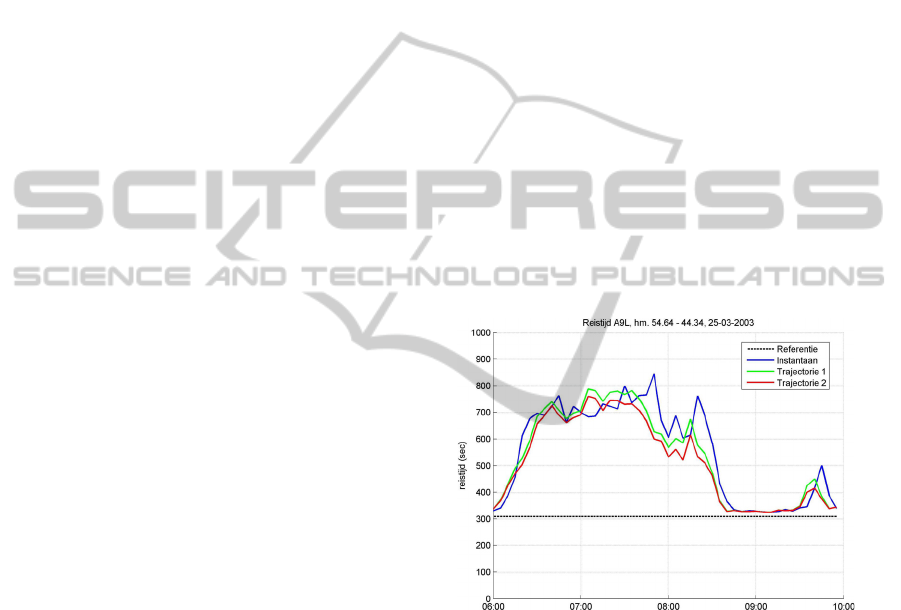
An example of a travel time plot obtained from
historical data on highway A9 on the 25th of March
2003 is given in Figure 4.
Figure 4: Dynamic route information.
Traffic data can be collected by a variety of data
sensors, such as inductive loop detectors (ILD) (see
Figure 5), videos, floating cars, remote traffic
microware sensors etc. The latter represent a
relatively new technology for collecting traffic data.
But since it is still in the testing stage, only a limited
number of such sensors have been installed in the
United States. Therefore, it cannot be used for wide-
area data collection.
ANWB is one of the services which attempts to
offer a live traffic update for the highways network
in The Netherlands. The application is using data
from the monitoring system. It shows real life
graphical information about the bottlenecks on the
highway network by giving an estimate of the
PERSONAL ADVANCED TRAVELER ASSISTANT
77
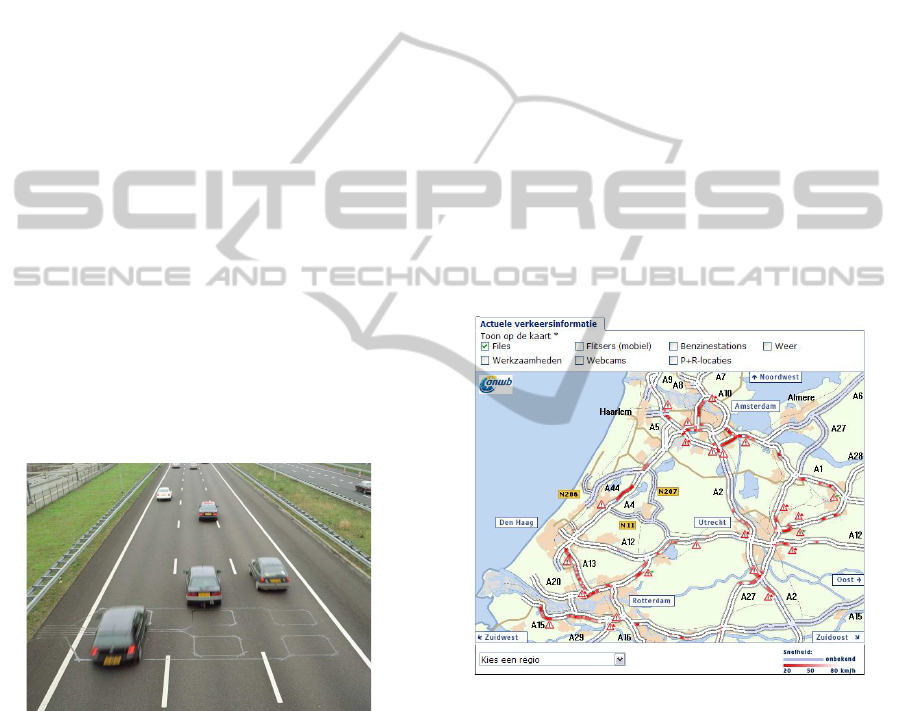
current average speeds (see Figure 6). This traffic
information is available 24 hours a day on their
website and is free of charge. The file that we used
to fill in our database was built by collecting data
from the ANWB website. The traffic data was
collected each 10 minutes for a couple of weeks for
a roadway network that comprised the highways and
a few national roads from the country. For each road
the traveling time was extracted from the text files
that are offered by ANWB. All data was organized
in an Excel file.
For each road the following information was
stored:
name of the road (such as A1, A2, etc.);
names of the intersections bounding the road;
length of the road in kilometers;
maximum speed allowed on the road;
associated travelling time computed based on the
maximum speed;
starting from 0:00 to 23:50 for each 10 minutes
interval the added travelling time in case of
congestion.
The missing data in some cases was computed by
interpolation from the surrounding data. After the
processing and analysis of the collected data, 4
Thursdays were chosen in order to be further used.
The file in Excel needed further processing in order
to be integrated in our application.
Figure 5: Wires in the surface of the road.
3.1 Open Source Tools
OpenStreetMap (OSM) is a collaborative project to
create a free editable map of the world. OSM
follows a similar concept as Wikipedia does, but for
maps and other geographical facts. An important
fact is that the OSM data does not resume to streets
and roads. Anybody can gather location data across
the globe from a variety of sources such as
recordings from GPS devices, from free satellite
imagery or simply from knowing an area very well,
for example because they live there. This
information then gets uploaded to OSM's central
database from where it can be further modified,
corrected and enriched by anyone who notices
missing facts or errors about the area. OSM creates
and provides free geographic data such as street
maps to anyone who wants to use them. The OSM
project was started because most maps that people
think of as free actually have legal or technical
restrictions on their use, holding back people from
using them in creative, productive, or unexpected
ways. Libraries to access the resources provided by
the project are available for multiple languages and
purposes. As an example, several rendering libraries
exist (in Javascript, Python, C and Java) and also
several editing clients that allow to interact with the
data. In order to implement the graphical user
interface of the system and to construct an initial
database out of intersections and highways from The
Netherlands, we embedded an OpenStreetMap map
viewer in the application. This was a Java panel
which allowed several listeners and functions to be
redefined.
Figure 6: Dynamic route information.
Due to the modular design of Swing component
library, the integration was an easy task.
The API of the OSM viewer provides a number
of utilities for manipulating maps, allowing us to
construct a robust user interface for our system. We
were able to:
create the intersections for the traffic network
graph by clicking on the map.
create directed links between two nodes - and we
assume that all the roads are straight.
calculate distances in kilometers between nodes by
using their latitude and longitude.
ICINCO 2011 - 8th International Conference on Informatics in Control, Automation and Robotics
78
relate geographical coordinates to plane
coordinates on the map.
design (in different colours) paths on the map,
parallel to the main roads in order to display a
requested route.
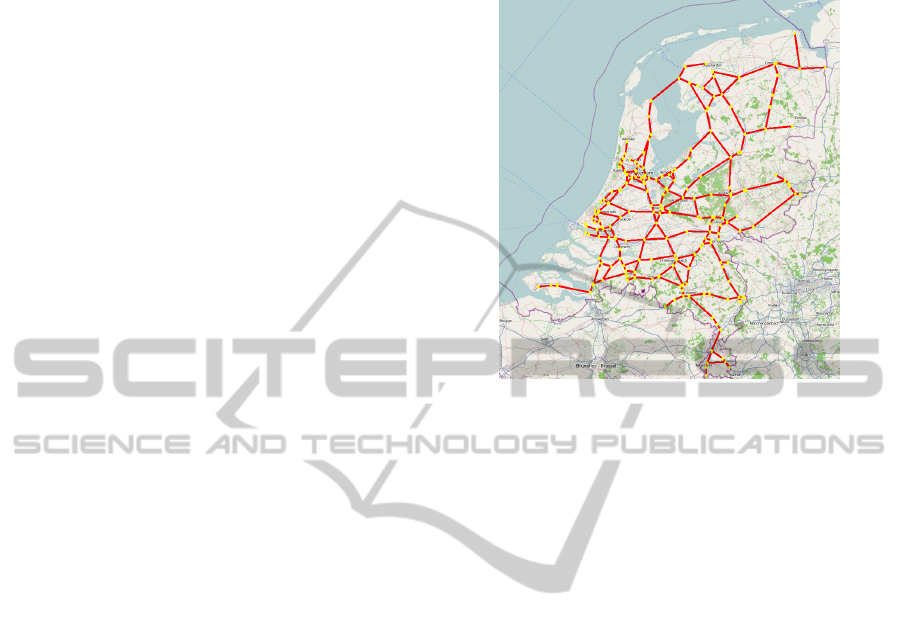
An example of the OSM integrated in our
application is presented in Figure 7. The
intersections and the roads from the database are
displayed on the map.
4 DYNAMIC DIJKSTRA
TRAFFIC ASSIGNMENT
The starting point of the implementation for a
dynamic traffic assignment is to build the traffic
network as a time expanded graph. Given the traffic
model that we presented in the previous section we
need to implement the algorithm on a graph that is
extended in time. This is determined by the time
varying speed graphs, which we also presented in
the previous chapter. Using this representation we
can then apply known mathematical algorithms to
solve our problem. As for general routing problems,
the Dijkstra's shortest path algorithm could be
applied. The main difference to a classic traffic
assignment, in representing the network graph is that
the cost varies in time.
The input to the algorithm is represented by a
route request. A route request consists of an O-D
(origin-destination) trip demand at a specific time.
The algorithm will be applied on the network graph
and it uses the nodes, the roads and the estimation of
the travelling time based on the varying average
speed associated to each road.
The network is represented by a graph G =
{N,A}, where A is the set of directed links and N a
set of nodes. G represents the spatial network,
meaning the network of nodes and roads. In order to
represent the dynamic travel time we will use a time
extended network. The time expanded network can
be constructed in the following way: the planning
horizon is divided into variable time periods {t =
1,….T} and each node is copied for each period t so
that for each node k there are now T time-space
nodes denoted kt. For each link j in the spatial
network consider time-spaced links, jtτ joining the
entry node of link j at each time t to the exit nodes of
link j at latter times, τ = t + 1; t + 2,…. Thus for
each spatial link we have time-expanded links (jtτ), τ
= 1..T, t = 1….T. This approach brings one
constraint: the travel time has to be discretized to
intervals. If we use a very high sample rate then an
enormous graph is required whereas a lower sample
rate results in loss of information.
Figure 7: Dynamic route information.
An example of a space time extended graph
constructed in the modality that we just described is
presented in Figure 8. The space graph represented
by the nodes (A, B, C, D, E) is repeated for three
time intervals (t1 at 09:00, t2 at 09:05 and t3 at
09:10). The edges that connect the nodes from A to
E, coloured in red represent the initial connections in
the graph. For clarity these edges were kept similar
also for the other layers. But the edges in dotted
lines are the real connections of the time expanded
graph. They show the evolution in time of the speed
flow along with the travelling time in the network.
Their length, between the layers, represents the
travelling time associated to the corresponding edge
when starting at each layer. It should be noticed,
however, that not all edges were represented in the
Figure in order to keep it readable. For example, the
travelling time from B to D is 5 minutes at 09:00 and
20 minutes at 09:05.
In order to show more clearly which are the
differences between the DDTA and STA averages of
the travelling time we use Table 1. In this table the
first part shows the average time that DDTA gains
compared to STA in minutes. Some values here may
appear to be lower than expected but these are the
averages. It is worth mentioning that in the worst
case DDTA gives a result with the same travelling
time as the other algorithms, but never worse. This is
the case of the 0 values in the second part of the
table. In this part we show at each hour the route
with greatest gain in time for DDTA. We notice for
example that from Rotterdam to Amsterdam we
have a gain of 16.78 minutes at 8 o'clock.
PERSONAL ADVANCED TRAVELER ASSISTANT
79
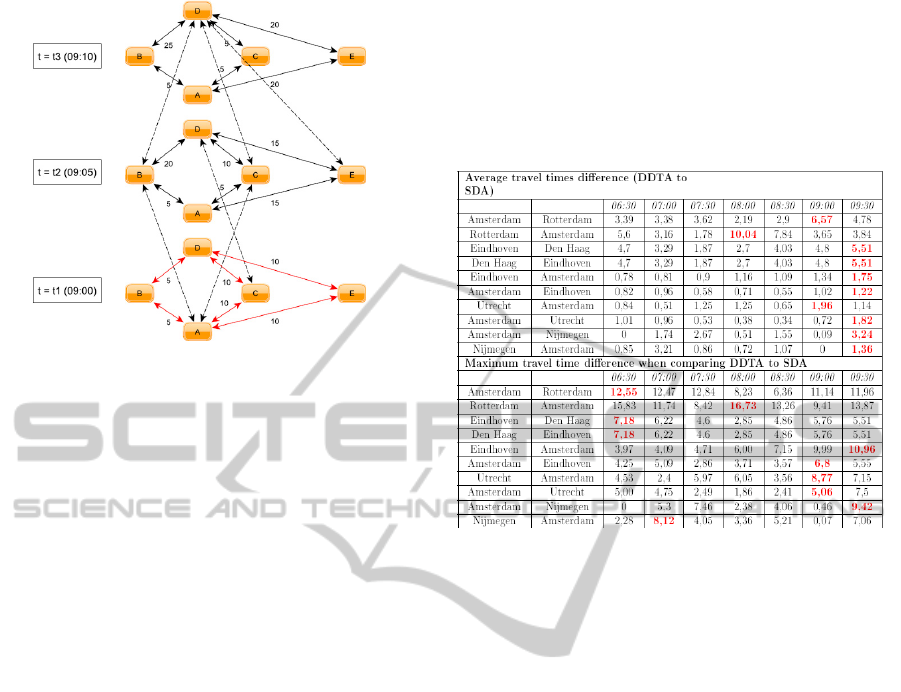
Figure 8: Dynamic route information.
5 MODEL
PTA gives the traveller routing advices during his
trip starting from departure to destination. The
traveller will benefit of the best available solution
according to his preferences at the departure time. If
unexpected events occur, it will result in
modifications during the trip. PTA should distribute
the traffic in the network so that it satisfies the
preferences of the users by taking into account the
availability in the network. The system will use
continuously updated traffic flow information. This
information would be available from the GPS-
equipped mobile phones of the users. Given that the
system knows which are the route requests and the
routes assigned already to drivers it can give a
prediction of the travelling times on the roads in the
future. This can be done by training a neural
network on the relation between various traffic
parameters such as the traffic stream and the
travelling time.
If we return to the individual routes assignment,
in case of an incident/road work the system informs
the traveller on the delays and best alternative
solutions. The driver will be also informed on the
travelling time associated to the recommended
alternative, the types of roads and eventually the
advantages/disadvantages. As we already
mentioned, PTA connects to the users by a hand
held device. This can be a smart phone, a routing
device or a PDA.
PTA is a distributed system that links the users to
the central server. All components are connected
through Internet. Users are connected to the server
but they can also communicate among themselves
by using ad hoc wireless networks. A possibility to
do this is by using the wireless network between
light poles on the highways. In Table 1 we list the
advantages and disadvantages of a distributed
system.
Table 1: Dynamic Dijkstra Algorithm compared to Static
Dijkstra Algorithm.
The advantage of PTA is that if the system
becomes a centralized one (because of network
problems) it still manages by connecting to the other
cars in order to get the information it needs. Figure 9
depicts the architecture of PTA. The main server has
to be connected to the roads and nodes database, to
the historical database and to an incidents database.
As we already mentioned, it is important for PTA to
benefit of live traffic information. The system is
designed in such a way that it uses the information
from the vehicles that already exist in the network.
The GPS-equipped mobile phones report their
positions at fixed time intervals. Moreover, the
routes of the vehicles are supervised, meaning that
the system knows the origin, the destination and the
departure time of each route. In this way the
travelling time of the traffic flow in the future can be
estimated.
6 CONCLUSIONS
As we mentioned in the introduction of this thesis,
our main purpose was to build a dynamic traffic
assignment. An important component of this is the
prediction of the travelling time. In this paper we
proposed a prediction method that would update the
historical data based on supervising the routes in the
network together with the real time traffic
information.
ICINCO 2011 - 8th International Conference on Informatics in Control, Automation and Robotics
80
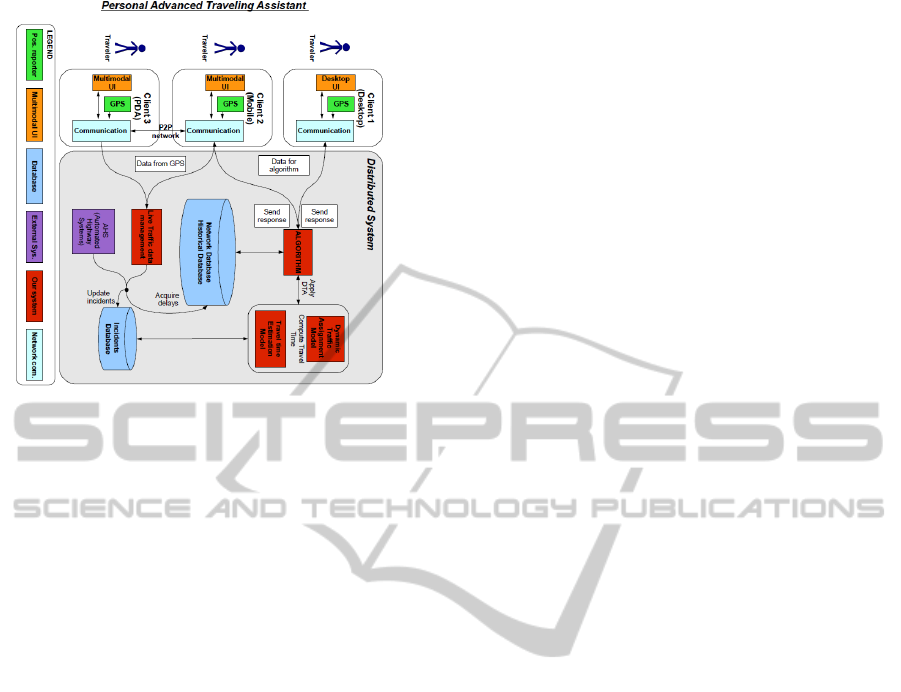
Figure 9: Dynamic route information.
Our prototype implements an algorithm that is a
time dimensional extended version of Dijkstra
shortest path algorithm. The main difference is that
our algorithm takes into account the traffic
variations in time. The cost function in the algorithm
is associated with the travelling time. The algorithm
uses the prediction model that we described
previously. Because of the fact that the algorithm
gives the route with the shortest time to each user we
may categorize it as a user equilibrium assignment.
However, we assume that just a part of the drivers in
the network are connected to the system. If we deal
with the whole network the situation would change.
The results of the algorithm were compared to
the results of two variants of the static Dijkstra
algorithm, one that computes the shortest path and
one that uses the fastest roads given their maximum
speed limit.
We developed a complex design for an advanced
traveller information system that relies on the
concept of distributed systems. The system that we
designed integrates the use of live traffic information
that derives from tracking the individuals and use of
highway sensors. Travellers are routed through hand
held devices which can be their mobile phones.
Another important feature of the system that we
designed is that it is usable by everybody, without
any special training or knowledge needed. In order
to get more insight into users’ preferences with
regard to such a system we did a user survey that
mostly confirmed our expectations but also brought
new ideas.
The system is also seen as a intelligent assistant
as it has the capability to detect, learn the user's
profile and associate it with his schedule. It
combines this information with the traffic data and
advises him about the best route to take.
Building the design of such a system was a
challenging experience as there are numerous
aspects to be taken into account. For each feature
that we included in the design we also presented a
possible manner to achieve it.
Given the huge complexity of the system we
chose to implement the most important components
with their basic characteristics.
REFERENCES
Kerner, B. S.: The Physics of Traffic. Springer (2004).
Wardrop, J.: Some theoretical aspects of road traffic
research. Proceedings of the Institution of Civil
Engineers, Part II, Vol. 1. no. 36, (1952) 352-362.
Fisk, C.: More paradoxes in the equilibrium assignment
problem, Transportation Research Part B:
Methodological, Vol. 13, no. 4, (1979) 305-309.
Dantzig, G. B.: Discrete-variable extremum problems,
Operations Res. Vol. 5. (1957) 266-277.
Dijkstra, E. W.: A note on two problems in connexion
with graphs, Numer. Math., Vol. 1. (1959) 269-271.
Matsoukis, E. C.: Road traffic assignment, a review, part
1: non-equilibrium methods, Transportation Planning
and Technology, Vol. 11. no. 1. (1986) 69-79.
Merchant, D. K., Nemhauser, G. L.: A model and an
algorithm for the dynamic traffic assignment
problems, Transportation Science, Vol. 12. no. 3.
(1978) 183-199.
Ziliaskopoulos, A. K.: A linear programming model for
the single destination system optimum dynamic traffic
assignment problem, Transportation Science, Vol. 34.
no. 1 (2000) 37-49.
Ho, J. K.: A successive linear optimization approach to the
dynamic traffic assignment problem, Transportation
Science, vol. 14, no. 4. (1980) 295-305.
Friesz, T. L., Luque, J., Tobin, R. L., Wie, B. W.:
Dynamic network traffic assignment considered as a
continuous time optimal control problem, Operations
Research, Vol. 37. no. 6. (1989) 893-901.
Vliet, Hall, M. V., Willumsen, D.: Saturn - a simulation
assignment model for the evaluation of traffic
management schemes., Traffic Engineering and
Control, Vol. 21. no. 4. (1980) 168-176.
Taylor, N.B.: Contram dynamic traffic assignment model,
Networks and Spatial Economics, (1980) 297-322.
Abdelfatah, A, Mahmassani, H.: A simulation-based
signal optimization algorithm within a dynamic traffic
assignment framework, in Intelligent Transportation
Systems, Proceedings. 2001 IEEE, (2001) 428-433.
Lum, K. M., Fan, H. S. L., Lam, S. H., Olszewski, P.:
Speed-flow modeling of arterial roads in Singapore,
Journal of Transportation Engineering, Vol. 124, no.
3, (1998), 213-222.
PERSONAL ADVANCED TRAVELER ASSISTANT
81

Kisgy, L., Rilett, L. R.:Travel time prediction by advanced
neural network, Periodica Polytechnica Ser. Civ. Eng,
Vol. 46 (2002).
Hobeika, A., Kim, C. K.: Traffic flow-prediction systems
based on upstream traffic, (1994) 345-350.
Li, Y., McDonald, M.: Link travel time estimation using
single GPS-equipped probe vehicle, (2002) 932-937.
Ishak, S., Al-Deek, H.: Performance evaluation of short-
term time-series traffic prediction model, Journal of
Transportation Engineering, Vol. 128, no. 6, (2002)
490-498.
Yu, J., Chang, G.-L., Ho, H., Liu, Y.: Variation based
online travel time prediction using clustered neural
networks, (2008).
Lint, J.,van, Hoogendoorn, S., van Zuylen, H.: Accurate
freeway travel time prediction with state-space neural
networks under missing data, Transportation Research
Part C: Emerging Technologies, vol. 13, no. 5-6,
(2005) 347-369.
ICINCO 2011 - 8th International Conference on Informatics in Control, Automation and Robotics
82
