
BUSINESS DIAGNOSTIC TOOL
Designing and Programming an Application for Use of SME Partners
David Plandor and Lenka Landryova
Department of Control Systems and Instrumentation, VSB Technical University Ostrava
17.listopadu 15, Ostrava, Czech Republic
Keywords: Business process, Diagnostic tool, System, SME.
Abstract: The aim of this paper is to describe a newly designed diagnostic software application for a small and
medium enterprise (SME). This application was driven by a need of small and medium sized companies and
by a focus on a simple, comfortable and user-friendly interface. The diagnostic process provided by the
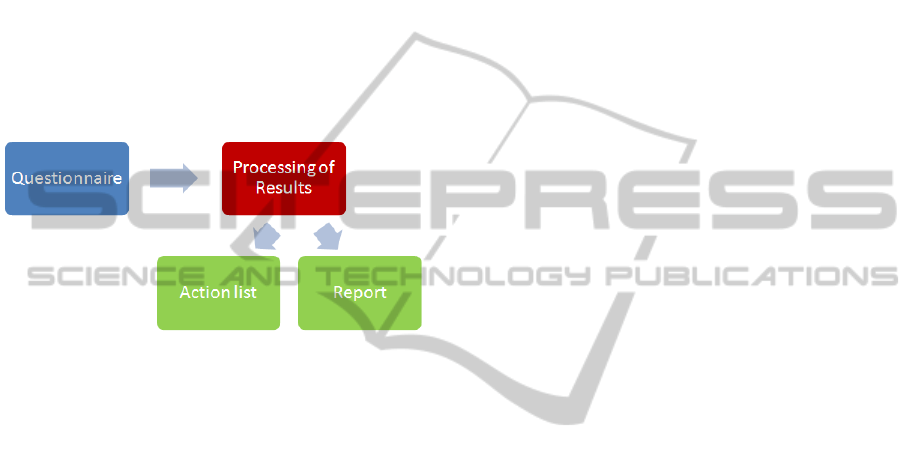
application consists of 4 main parts – a questionnaire, a processing system, a report and an action plan. The
entirely new generic diagnostic system developed according to the functional specifications given by
partnering companies in our project includes a system of questionnaires with processing logic conditions,
and was tested with end users and upgraded based on end users’ feedback. A live version and
implementation into a web site on the server is ongoing.
1 INTRODUCTION
Our target is to design a diagnostic software
application for a small and medium enterprise
(SME). According to the given functional
specifications (FutureSME, 2008), the diagnostic
process provided by our application consists of 4
main parts – a questionnaire, processing system,
report and an action plan. A special module, which
is not a part of the end user-interface, is an
administration tool. An application is published and
can be found when an end user is registered to the
FutureSME web portal.
The main objective is a need to focus on a
simple, comfortable and user-friendly interface.
Other objectives include a support of language
versions, system dynamics as it needs to be
independent from any programmer’s interference
with the business diagnostic logic background. All
of the actions should be just provided by a system
administrator. A very suitable solution seems to be
the development of an entirely new generic
diagnostic system that includes system of
questionnaires with processing logic conditions. The
newly created system has to be tested with end users
and upgraded on the basis of end users’ feedback.
Then it should be finalized into a live version and
implemented into the web site on the server.
2 BUSINESS DIAGNOSTIC TOOL
SPECIFICATION
Most of the leaders on a market with business
diagnostic tools offer strategy development for a
company during a consultancy session with the help
of advisers (Morrison, 2007), recruiting and
retaining skilled workers (Building Small Business
HR, 2008), or may be oriented specifically at a given
industry in order to deal with the highly dynamic
circumstances in which industries around the world
now operate (Print 21 Action Agenda, 2005). Others
are evaluating business performance going through a
number of simple questions ranging from sales
turnover, productivity and employee performance
figures (McAnderson, 2010). The results are offered
in a form of an individual or team report supplied
during a follow up meeting with a full explanation
and advice for advancements, opportunities and
clarification (McWilliams & Associates, 1992,
Business Diagnostics 2004.
What makes our proposed solution different is
the technical aspect and a point of view from the
SME end users, who originated the functional
specifications and a design. The on-line
questionnaire consists of questions and its responses.
Responses are linked to a user who is currently
logged into the FutureSME portal. All users’
77
Plandor D. and Landryova L..
BUSINESS DIAGNOSTIC TOOL - Designing and Programming an Application for Use of SME Partners.
DOI: 10.5220/0003650600770082
In Proceedings of the 6th International Conference on Software and Database Technologies (ICSOFT-2011), pages 77-82
ISBN: 978-989-8425-76-8
Copyright
c
2011 SCITEPRESS (Science and Technology Publications, Lda.)
responses have to be stored in a database for further
processing. A list of results is generated from users’
responses on the basis of logic rules specified by the
system administrator. All users’ results are displayed
in the report web page including graphic items
(static or dynamic schemes, graphs etc.). A user is
allowed to create his own action list by processing
the business diagnostic results. An action list is used
for the planning of actions leading to the solution of
crucial issues or improving the specific part of
company. This list is automatically filled from other
sources on the portal as well. The action list should
be additionally edited by a company representative
including the addition of a time schedule,
responsible persons and priorities.
Figure 1: Business diagnostic process.
In order to suit all variables of business diagnostics
for different targeted SMEs, we need to have several
versions of the diagnostic process. It will be very
effective to compare companies’ results or create
average results for a group of companies according
to specific factors (the business area, region, size of
a company). All complex data have to be stored for
future comparison. For a faster approach we should
be able to transfer the results into newly created
versions. Particularly in the case we need to edit
only a few questions and we do not want to force
users to fill out the answers from a previous version
again. In case we need just a minor change, we
delete particular users’ responses and force a user to
answer them once again. The system does not
require the creation of a new version in the simplest
case when we change just text of a question, the
response or result without changing the meaning.
System users are divided into groups according
to their roles - administrator, facilitator, translator
and company representative. We can divide users
into these groups with different permitted accesses
and available functions:
Company Representative – is allowed to fill
out the questionnaire, view a report and fill the
action list from business diagnostic results.
This role is default for end users from SMEs.
Each company is allowed to have just one
representative for the whole diagnostic
process or more representatives from different
company divisions.
Facilitator – has all functions of company
representative. A facilitator fills out the
questionnaire on behalf on or with a end user,
helps him to explain all in detail. A facilitator
uses a complex approach across all facilitated
companies and has access to other tools on the
portal.
Translator – is allowed to add, edit or delete
language versions of texts across the whole
diagnostic process. Default language is
English.
Administrator – is allowed to add, edit or
delete questions, responses, logic, report, and
language translations.
2.1 Development Environment
and Tools
Since our goal is to develop a web application, we
need to choose an appropriate environment and tools
for development. On the server side there is
ASP.NET and PHP. VB script and Javascript are
technologies on the client’s side. Due to our rich
experience and the simple implementation into
Linux or Windows servers, we have chosen PHP
version 5.2.17, which generates the XHTML code.
On the client’s side a Java script and Java script
based library called jQuery is used. JQuery offers a
wide scale of tools for the creation of a user-friendly
interface. As the portal utilizes the Microsoft SQL
Express Edition v9 database it appears to be the best
choice for business diagnostics as well. For good
quality graphs a free version of a pChart library
based on PHP is used.
2.2 Diagnostics
For the diagnostic template a database table has been
created. There are basic data – who and when has
the template been created, its brief description etc.
This table is the root for other template tables such
as questions and responses. At first we have to
design a questionnaire part of the diagnostic process
then we will continue to data processing and
reporting.
2.3 Questionnaire
At the beginning we have to design database
structures for questions, variants of questions,
responses etc. The following tables have been
ICSOFT 2011 - 6th International Conference on Software and Data Technologies
78
created:
Questions
Question‘s variants
Question‘s responses
Question‘s options
Categories
Each question is filed into a category. Categories are
tree structures, so it is possible to create several
hierarchical levels. A question can be specified by
its display order and a group. Groups of questions
are put onto one page in order to improve the
questionnaire’s arrangement.
Questions are specified by types:
Customized answer (text box)
One possible answer (radio group)
n possible answers (checkbox)
Choosing from defined options (drop-down
list)
Percentage (0 – 100% in steps of 5)
Special – i.e. choosing from options with
additional customized answers
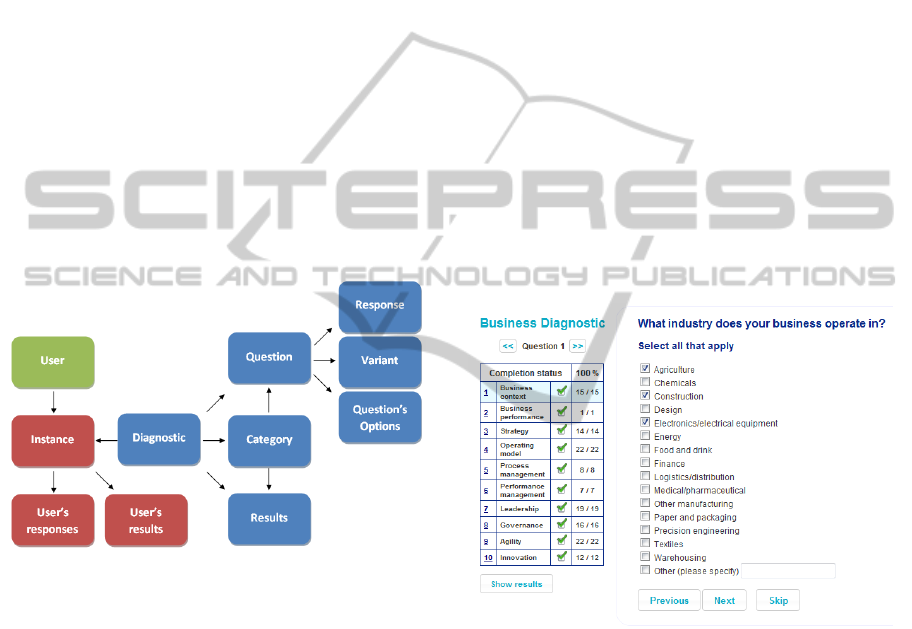
Figure 2: Basic scheme of business diagnostic tool.
The questionnaire always displays one question or
one group of questions according to defined groups.
The questionnaire keep the question order.
Questions from one group are put onto one page. A
grouping of questions is used for better viewing
similar or simple questions on one page. Question
groups are defined in a database table. Each question
can have its variants. Variants are necessary in
situations when we need to distinguish answers in
dependence of a additional factor e.g. we evaluate
the number of employees in a company and we are
interested not just in this year, but also in the
previous two years. So we add three variants to that
question. These variants are displayed as columns
and a user is provoked to answer all three variants. A
particular variant of a question (if exists) has to be
specified in the logic condition as well.
On the left side of the screen there is a category
completion table. Categories are always linked to a
diagnostic template. Each category includes the
name of category, the total number of questions in a
category and the number of answered question
within a category. It is always obvious how many
non-answered questions in a category remain. The
total completion status in percentage is placed on the
table header. The table serves also for fast
navigation across the questions. The first question of
a category is offered by clicking on a category’s ID
and a user is redirected to a first non-answered
question by clicking on the name of the category.
All links in the category table are improved by
tooltips that appear on the hover about the links.
Tooltips specify the behavior of a link. Once all
questions of the category are complete, a green
checkbox icon appears. Once the total completion
status reaches 100%, a user is redirected to a
guidepost – it is possible to review the answered
questions or continue to processing a report
generation from the resluts. If there are still some
non-answered questions, the user is forced to
complete them.
Figure 3: Questionnaire and a completion table.
A question’s response is stored into a database after
clicking “Next” or “Previous” button. A question
can include customized check scripts. Fixed checks
of the number of responses are defined for questions
according to their specification in a database. There
is also a script for percentage counting always
assuming a total of 100%. A check condition can be
specified by an administrator by using simple
language (java script based) or scripts can be
generated by the business diagnostic system.
Generation is based on choosing options and adding
operators for defining relationships between various
parts of conditions. If a condition is not satisfied, a
user cannot proceed. There is a skip button, so the
next question is displayed but no results are stored.
BUSINESS DIAGNOSTIC TOOL - Designing and Programming an Application for Use of SME Partners
79
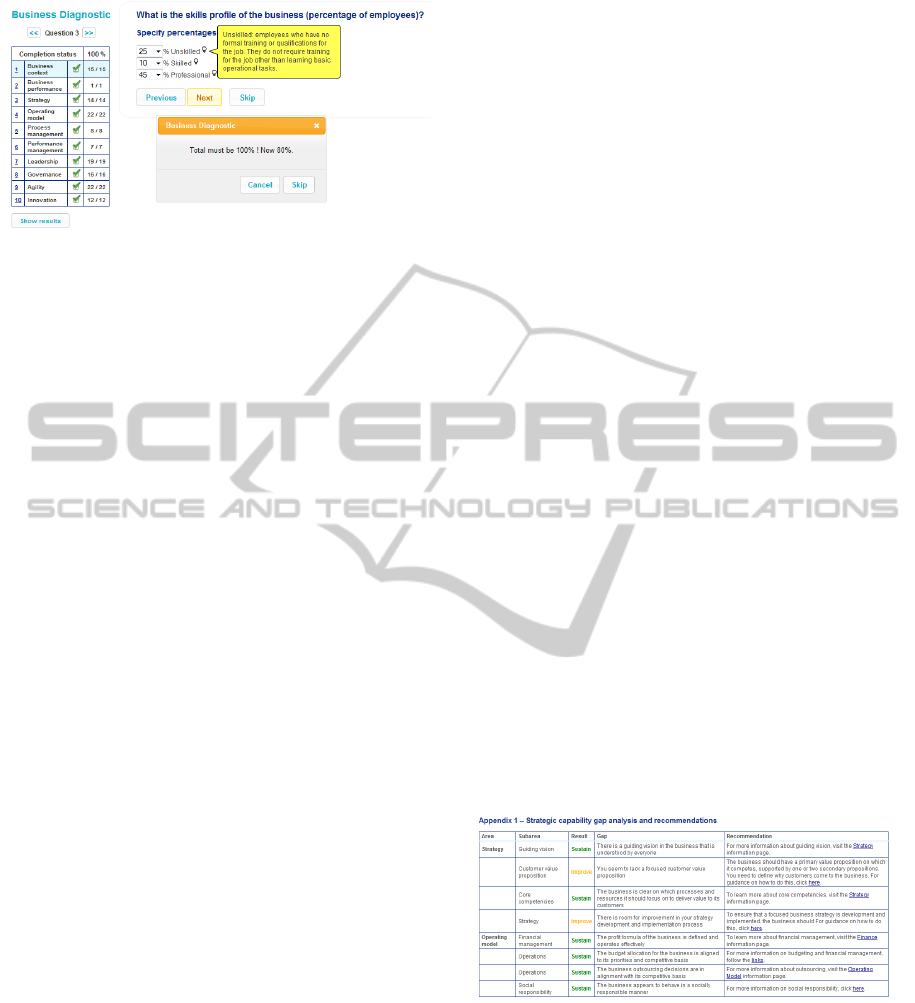
Figure 4: Complex view of web questionnaire.
A user is supposed to return to that question
otherwise the result processing and report generation
are not available. Every question and response can
be extended by a tooltip with the detailed
specification or précising the valuation. If a
question or response has a tooltip, a small bulb
image appears at the end of the text. Additional text
is shown after clicking on the image, this way seems
to be much more comfortable than showing tooltips
on the hover which can be confusing when there are
many answers with tooltips very close to each other.
When the response is marked as customized a text
field is placed into the questionnaire. Sometimes we
need a combination of the checkbox and customized
text. So another check script is required. When we
tick a checkbox we have to require a customized text
and when we put a customized text, we need the
checkbox to be ticked. Otherwise, we cannot
proceed. Similar behavior is applied for other form
item combinations.
3 PROCESSING OF RESULTS
A user is allowed to start processing the results and
generating a report once the completion status is
100%. Now we are going to describe a system for
result processing and generating the report. All
possible results are stored in a database as a part of
the diagnostic template. The results are filed into a
category, which can (but does not have to)
correspond to the question categories.
Each result includes:
Text part
Gap – description of company’s gap
Short recommendation - short
recommendation how to improve or
eliminate a gap
Detailed recommendation– detailed
recommendation how to improve or
eliminate a gap
Type of result – i.e. sustain, improve,
urgent etc.
Logic part – simply defined logic condition.
A program processes the data in a cycle - it goes
through the list of results and the logic condition of
each result is examined. A result is assigned to a
user when the condition is satisfied.
The logic formula is internally stored in a
specific format. The system administrator does not
have to know the exact convention as the
administration allows automatic formula generation
by going through the questions choosing the
answers, variants and adding operators. Symbolic
schema is programmatically converted into a simple
logic formula.
For example a formula can look like this -
(B1.2=2 AND F1.5=0) OR (F2.3>20). It means that
this result will be assigned to the current user as long
as the condition is satisfied. We have two parts
joined by a OR operator, so one of the expressions in
brackets has to be true. The first expression –
response 2 to question 1 from B subcategory, option
2 and response 5 to question 1 from F subcategory
equals zero. Now there is the OR operator followed
by a second expression in brackets – response 3 to
question 2 from F subcategory is higher than 20.
If the condition is true, the result is written into
the database and another procedure, that completes
all dynamic data for the result, is invoked.
A recommendation text is generated for each
result. The dynamically generated texts are inserted
into the static template i.e. a list of ticked responses
or responses with a value higher than 10% etc. All
dynamic texts are stored in the database.
Figure 5: Example of generated results.
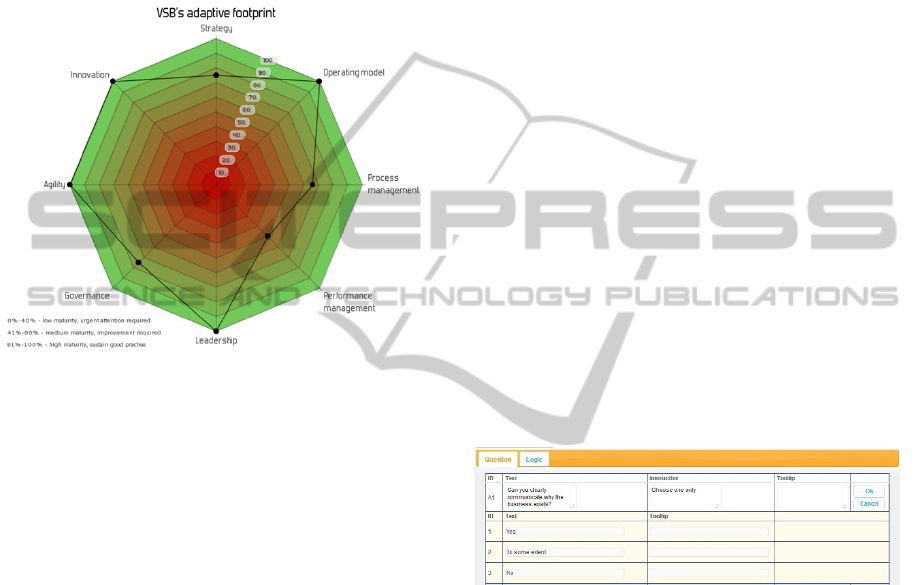
3.1 Report
Results are displayed in a report – a classic web
page with following types of objects:
Static object – report header, images, schemes
Dynamically generated objects – result texts,
graphs from results, user dependent data.
ICSOFT 2011 - 6th International Conference on Software and Data Technologies
80
The report template is always created by the
administrator. For designing the report structure the
best a TinyMCE web library is used. Perhaps we can
count on a programmer’s contribution when we need
to add some more complicated objects such as
graphs. The report utilizes the pChart library for
good quality graphs. At the end of the report a list of
questions with responses is printed. The final report
is exportable into PDF.
Figure 6: Example of a graph in a report –dynamically
generated from user’s results using pChart library.
3.2 Action List
The filling of the action list is launched from web
report. It is a procedure, which uses all already
stored user’s results and inserts them into an action
database table. The action list includes actions that
are necessary for company planning in the future.
The action list is filled from other sources on the
portal as well. Actions can be created manually by a
user in different parts of the portal. We will focus
on data coming from the business diagnostic. By
clicking the button a procedure for filling the action
list is invoked. A program goes through all results
and stores them into an action table in the database.
An overview of all actions is accessible in different
parts of the portal. a user can assign other data to an
action i.e. responsible person, start and due date etc.
A user can fill the action list periodically, always by
the insertion of currently valid results.
3.3 Instance, Comparing Diagnostic
Results
Each system of questions and responses (diagnostic
template) is linked to a user using instances. An
instance includes the primary key of diagnostic
template followed by user’s ID. An instance is also
specified by the creation date. An instance is linked
to the other two database tables – the user’s
responses from questionnaire and the user’s results
generated by processing part of the system. If a user
wants to complete the same business diagnostic
later, a new instance linked to the same template is
created, but with a different ID and creation date and
is linked to different user’s responses and results.
Instances connected to the same diagnostic template
are comparable in order to see changes and
improvements in a company.
3.4 Administration
Administration is a separate part of the business
diagnostic for editing currently existing data but also
for the creation of totally new diagnostic templates –
the defining of questions, responses, results
including logic conditions etc. New versions of a
diagnostic can be created by copying existing
responses or the results from previous versions.
Users do not have to answer same question in new
versions. All text fields can be defined using a
HTML code or WYSWYG editor for text
highlighting or adding a link redirecting a user to
interesting sites within the portal on somewhere else
on the web.
Figure 7: Administration – question texts editing.
4 CONCLUSIONS
The required goals for the business diagnostic have
been reached. The dynamic system for a general
diagnostic process (when a questionnaire followed
by the processing of results is required) has been
developed. Our diagnostic system is used in the
FutureSME project with many end users – small and
medium company representatives across European
countries. The application is discussed with end
users and accommodated according to their
feedback. The application has been developed with
emphasis on a simple, modern, comfortable and
friendly user interface. A web format allows wide
scale utilization – not just for small and medium
enterprises or the business sector but in general any
BUSINESS DIAGNOSTIC TOOL - Designing and Programming an Application for Use of SME Partners
81

self-assessment purpose. The business diagnostic
application will be improved and extended in the
future and its results will be processed by other
external applications such as KPI (key performance
indicators) software application. Other parts of the
FutureSME portal will display diagnostic results i.e.
complex company state overviews, progress in time
etc. We hope that this tool will become
commonplace not only in small and medium
enterprises but also for business facilitators,
consultants and in general in situations when self-
assessment and result processing is needed.
ACKNOWLEDGEMENTS
The authors would like to acknowledge the
FutureSME project team who contributed greatly to
the data collection and analysis of requirement
specifications for this work, as well as the European
Commission for funding and supporting CP-IP
214657-2 FutureSME, (Future Industrial Model for
SMEs), EU project of the 7FP in the NMP area.
REFERENCES
Bititci, U., Ates. A, 2009. The appropriateness of current
intervention policy patterns and delivery mechanisms
to address the manufacturing SME needs in Europe. In
Configuring manufacturing value chains - Responding
to an uncertain world - 14
th
Cambridge Symposium on
International Manufacturing. 11 pp. Contribution.
University of Strathclyde. Available from: www.ifm.
eng.cam.ac.uk/cim/symposium2009/.../20_umit_bititci
.pdf.
Bititci, Umit S., Maguire, C., 2009. An Investigation of
Productivity And Competitiveness Challenges Facing
European SMEs. Glasgow, UK. 23 s. Competitive
Paper. Strathclyde Institute for Operations
Management, University of Strathclyde.
Business Diagnostics 2004 Available from URL
http://www.businessdiagnostics.com.au/.
FutureSME, 2008. Research proposal FP7 - Future
Industrial Model for SMEs - FutureSME. Glasgow,
University of Strathclyde.
Ken W. Gadd, (1995) "Business self-assessment: A
strategic tool for building process robustness and
achieving integrated management", Business Process
Management Journal, Vol. 1 Iss: 3, pp.66 - 85
McAnderson, R. 2010. On the Mark Marketing. Available
from URL: http://www.onthemark.com.au/business_
diagnostic.htm
McWilliams & Associates 1992. QuickBooks Available
from URL: http://www.4luvofbiz.com/p_small_
business_diagnostic_tool_management_edition_13_31
7.html.
Morrison, M. 2007 RapidBI – Rapid Business
Improvement. Available from URL:
http://rapidbi.com/created/business_diagnostic_tools/
Print 21 Action Agenda, 2005. Available from URL:
http://www.printnet.com.au/pages/business_solutions/
business_diagnostic_tools.html
Ritchie, L.; Dale, B.G. Self-assessment using the business
excellence model: A study of practice and process. Int.
J. Production Economics . 2000, 66, s. 241-254.
Small Business HR. 2008 Building Small Business HR
Available from URL: http://hrskills.
smallbusinesscheckup.com/check-up.html
ICSOFT 2011 - 6th International Conference on Software and Data Technologies
82
