
MODELLING VITRIFIED GLASS VISCOSITY IN A NUCLEAR
FUEL REPROCESSING PLANT USING NEURAL NETWORKS
Katy Ferguson
1
, Jie Zhang
1
, Carl Steele
2
, Colin Clarke
3
and Julian Morris
1
1
School of Chemical Engineering and Advanced Materials, Newcastle University, NE1 7RU, Newcastle Upon Tyne, U.K.
2
Sellafield Ltd, Sellafield, Seascale, Cumbria, U.K.
3
National Nuclear Laboratory, Preston, U.K.
Keywords: Viscosity, Neural networks, Vitrification, Nuclear reprocessing, Modelling, Application.
Abstract This paper presents a study of using neural networks to model the viscosity of simulated vitrified highly
active waste over a range of temperatures and compositions. Vitrification is the process of incorporating the
highly active liquid waste into the glass by chemically changing the structure of the glass for nuclear fuel
reprocessing. A methodology is needed to determine how the viscosity will change as a result of a new feed.
Feed forward neural networks are used to model the viscosity of new product glasses. The results are very
promising, with a Mean Squared Error (MSE) of 1.8x10
-4
on the scaled unseen validation data, highlighting
the high accuracy of the model. Sensitivity analysis of the developed model provides insight on the impact
of composition on viscosity.
1 INTRODUCTION
The wastes from nuclear reactors are radioactive and
need to be treated for long term storage. Vitrification
is one of the nuclear waste treatment processes,
which turns the highly active wastes into a glass
which is much safer for storage. The understanding
of what affects the nuclear waste glass viscosity has
increased due to inactive simulant viscosity tests
carried out at the National Nuclear Laboratory. It is
essential to understand how the viscosity is affected
by the composition using non-active trials.
The experiments provide an insight for plant
engineers/operators on what may happen with
particular feeds. Only a limited number can be
performed due to cost. It is desirable that a model
can be built to predict the viscosity saving the
company a large amount of investment
Developing a detail mechanistic model has been
shown to be difficult, time consuming and effort
demanding. The full mechanism of how various
compositions affect viscosity is not fully understood.
Data based empirical modelling can be a very useful
alternative in this case. Neural networks have been
shown to be capable of approximating any
continuous nonlinear functions (Cybenko, 1989);
(Girosi and Poggio, 1990); (Park and Sandberg,
1991) and have been applied to nonlinear process
modelling (Bhat and McAvoy, 1990); (Bulsari,
1995); (Duchesne et al., 2010); (Narendra and
Parthasarathy, 1990); (Zhang et al., 1998).
This paper presents a study on using neural
networks to model the viscosity of simulated
vitrified highly active waste over a range of
temperatures and compositions. Section 2 gives a
brief description of the processes. Neural network
modelling of glass viscosity is presented in Section
3. The obtained results are discussed in Section 4
and conclusions given in Section 5.
2 PROCESS DESCRIPTIONS
2.1 Waste Vitrification Plant
The Vitrification plant (Figure 1) is responsible for
converting Highly Active Liquor (HAL) into a
durable product glass. HAL, consisting of waste
fission products in nitric acid, and other calcination
additives are fed into a hot revolving furnace. The
liquid is evaporated leaving dry particles.
The particles are dropped into a melter with
Borosilicate glass frit and heated to high
temperatures resulting in a new glass matrix being
322
Ferguson K., Zhang J., Steele C., Clarke C. and Morris J..
MODELLING VITRIFIED GLASS VISCOSITY IN A NUCLEAR FUEL REPROCESSING PLANT USING NEURAL NETWORKS.
DOI: 10.5220/0003654003220325
In Proceedings of the International Conference on Neural Computation Theory and Applications (NCTA-2011), pages 322-325
ISBN: 978-989-8425-84-3
Copyright
c
2011 SCITEPRESS (Science and Technology Publications, Lda.)

formed, different from waste encapsulating. The
glass is poured into a container. The container is
then cooled, lid welded on, decontaminated,
monitored then taken for long term storage.
2.2 Inactive Laboratory Experiments
Experiments were carried out in order to test many
properties of the glass (Steele et al., 2011.) One
property of the glass produced is its viscosity,
relating to the pour rate, which can be measured on
the active plant.
There are 4 groups of experiments, in total
consisting of 28 compositions. The simulant glasses
were made up in the laboratory with similar
chemical compositions to what is expected. The
viscosity readings were from a high temperature
rotating viscometer. Batches of the glasses were put
into an alumina crucible. The glass was heated to
1200°C and held at this temperature for 45 minutes.
The rotor was lowered 20mm into the glass and
measurements taken every 10 seconds during the
cooling period down to 900°C at a rate of 2°C per
minute. The cleaning process will not be described.
3 VISCOSITY MODELLING
By using the estimated compositions and a range of
temperature, a viscosity curve can be predicted.
Multiple Linear Regression is used to show that the
data is non-linear. Neural Networks will be used to
model viscosity due to the high complexity and time
consuming nature of mechanistic models.
3.1 Multiple Linear Regression
Multiple Linear Regression (MLR) is a linear
technique used to predict (Montgomery, 2006) and
takes the following form:
iMiMiii
exbxbxbby
,2,21,10
(1)
where b
0
is the regression coefficient, b
M
is the
coefficient of the M
th
predictor, x
i,M
is the M
th
predictor at time i, e
i
is the error at time i and y
i
is
the value of the variable at time i. This method will
not be explained further, as the MLR approach does
not predict viscosity. Figure 2 shows the relationship
between measured and predicted viscosity with the
line measured viscosity equals predicted viscosity
shown. It shows that the data is highly non-linear
and therefore is not the correct approach to use.
Figure 1: A Waste Vitrification Plant.
3.2 Neural Networks
In this paper, Neural Networks are analysed as a
methodology to model viscosity using composition
and temperature. The most commonly used is the
multi-layer feed forward neural network. Inputs are
presented at the input layer, I
i
. The data is
propagated through the network through complex
connections. The hidden layer structure defines the
topology of a feed forward network. It is possible to
have more than one hidden layers and is proven to
approximate any continuous non linear function with
sufficient number of hidden neurons (Cybenko,
1989). Single hidden layer neural networks are used
in nonlinear system modelling (Pham and Liu, 1995;
Lennox et al., 1998).
Each interconnection has a scalar weight, w
i
which modifies the signal strength. The neurons
within the hidden layer: sum the weighted inputs and
pass through a non-linear activation function as well
as a bias, b. The output of a hidden neuron, O known
as the sigmoidal neuron activation function and its
output is in the range (0, 1).
SbwI
ii
i
nh
()
1
(2)
O
S
1
1exp( )
(3)
Figure 2: Measured against predicted viscosity using
MLR.
MODELLING VITRIFIED GLASS VISCOSITY IN A NUCLEAR FUEL REPROCESSING PLANT USING NEURAL
NETWORKS
323
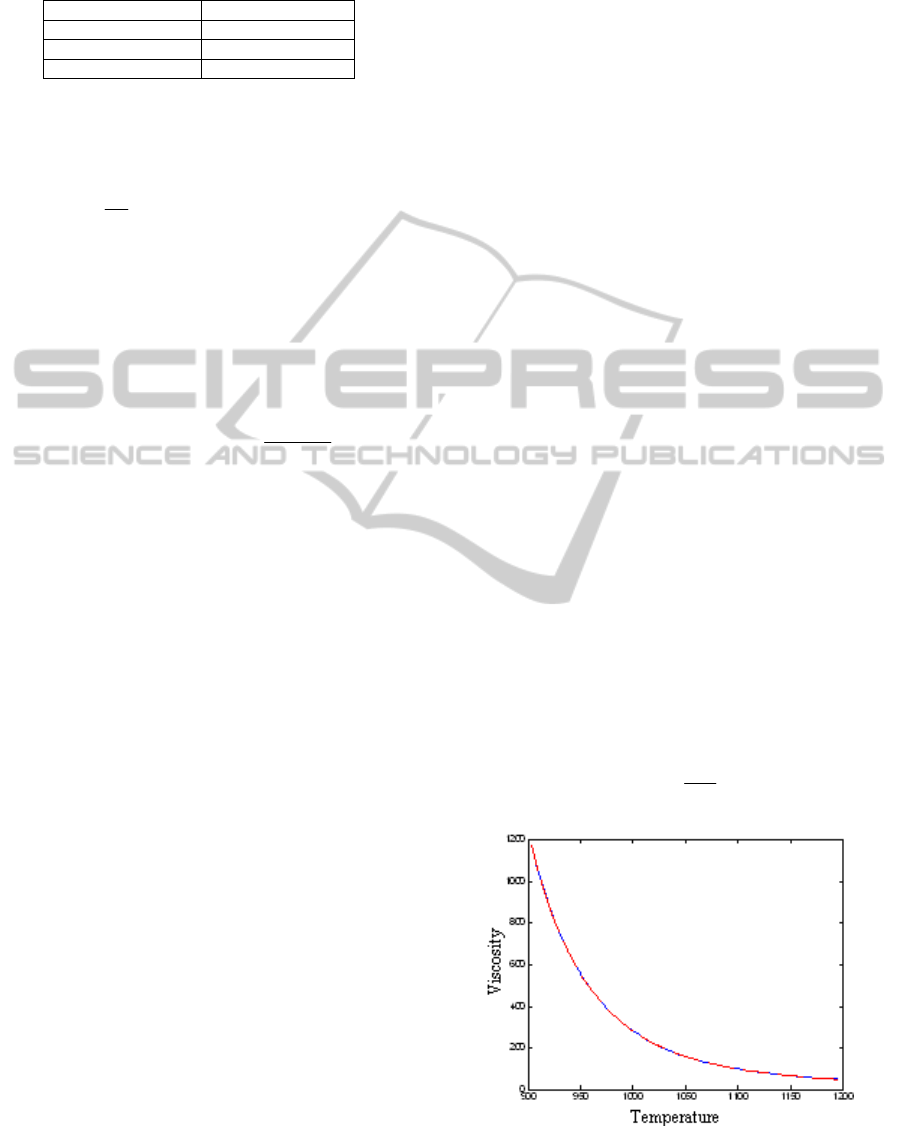
Table 1: Mean squared errors (scaled) of neural network
model predictions.
Data set MSE
Training 1.0879e-4
Testing 2.9992e-4
Validation 1.8430e-4
Network weights are such trained so that the sum
of squared network prediction errors, Eq(4) is
minimised.
J
N
yt yt
t
N
1
2
1
(
() ())
(4)
where N is the number of training data points,
y
is
the network prediction, y in the target value, and t is
an index of the training data. The most commonly
used network training method is the back
propagation training method (Rumelhart et al.,
1986), where network weights are adjusted as
follows.
Wk Wk
J
Wk
() ()
()
1
(5)
W(k+1) = W(k) + W(k+1)
(6)
W(k) and W(k) are the weight and weight
adaptation at the training step k respectively, is the
momentum coefficient, and is the learning rate.
Training can be terminated when the error gradient
is less than a pre-specified value, e.g. 10
-6
or by a
cross validation based stopping criterion. When
using the latter, data for building a neural network
model is divided into a training data set and a testing
data set. The network prediction error on the testing
data is continuously monitored and terminated when
the testing error stops decreasing.
3.3 Neural Networks Viscosity
Prediction
The glass contains 24 different components, C
i
and
will be in terms of number of Moles. The
temperature, T, ranges from 1200 to 900°C in the
experiment. The output is the viscosity, V which is
of the form:
V = f(T, C
1
,...,C
24
) (7)
The data set was split up into training (20%), testing
(40%), and validation data sets (40%). The data
were trained using the Levenberg-Marquardt
optimisation algorithm (Marquardt, 1963) with
regularisation and early stopping. The purpose of
regularisation and early stopping is to avoid over-
fitting noise in the training data. A regularisation
term is added to the training objective function to
penalise large network weights. A feed forward
neural network with 25 inputs, 7 hidden nodes in a
single hidden layer and 1 output was created.
4 RESULTS
4.1 Neural Network Predictions
The model proved to be successful at modelling
viscosity using composition and temperature. Figure
3 shows a plot of temperature against viscosity. The
blue line represents the true values while the red
lines represents the model predictions. The error
appears to be small. Table 1 gives the mean squared
errors (MSE) of the neural network model
predictions on the training, testing, and unseen
validation data sets.
The MSE given in Table 1 are for scaled data,
i.e. scaled to zero mean and unit variance. The very
low MSE values in Table 1 indicate that the
developed neural network model is very accurate.
4.2 Sensitivity Analysis of the Neural
Network Model
Initial work has been carried out to investigate the
model sensitivity to various model inputs. This study
uses a numerical method where a small perturbation
is added to one of the inputs while keeping other
inputs unchanged. The ratio between the resulting
change in model output and the applied model input
is the model sensitivity to that input:
i
C
V
ySensitivit
(8)
Figure 3: Graph showing actual (blue) and predicted
viscosity curve over time (red).
NCTA 2011 - International Conference on Neural Computation Theory and Applications
324
The sensitivity changes, due to the non-linearity.
If it changes considerably with only small changes
in the component, then this suggests that the
component significantly affects the viscosity.
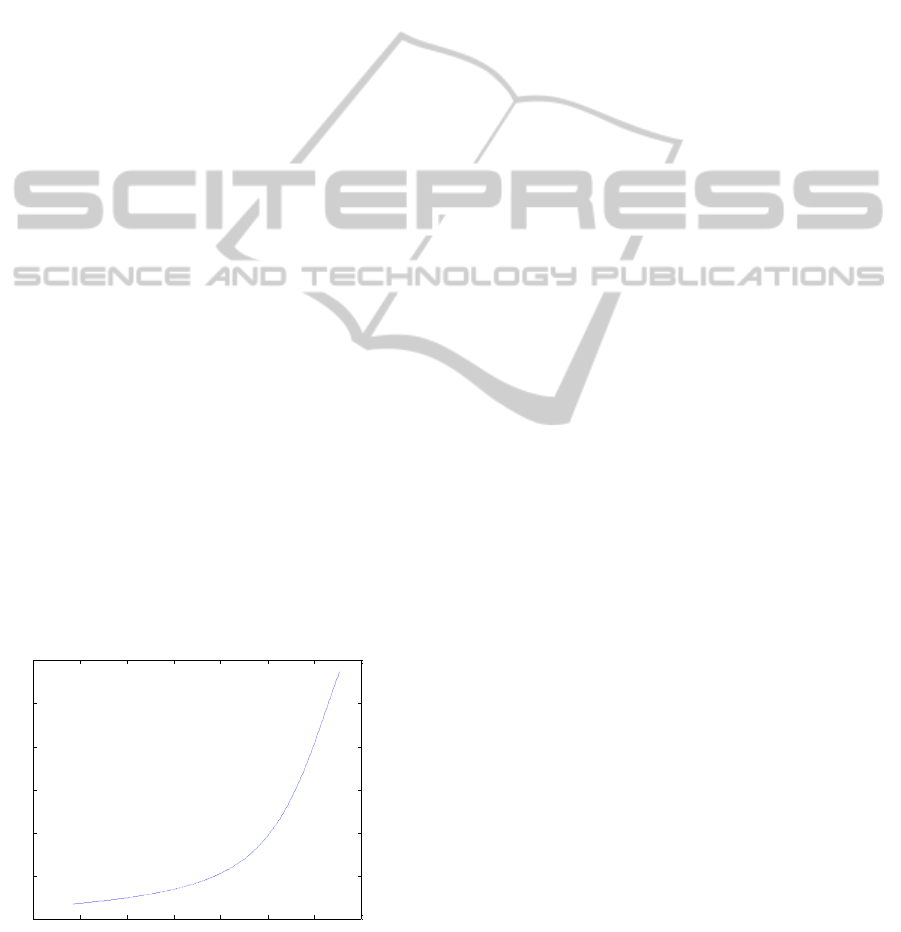
Figure 4 shows the sensitivity curve when a
variables is perturbed. Above 0.035Moles, there is
an increase in viscosity, highlighting that variable
has a big effect on viscosity.
5 CONCLUSIONS
This paper has used a well proven technique,
multilayer feed forward neural networks, to predict
the viscosity over a range of temperatures and
different glass compositions. The prediction error
(MSE) of the model for this range of feed was found
to be 1.84x10
-4
for the scaled validation data set
which highlights the model’s accuracy at predicting
viscosity.
The model is only valid over a certain range for
each variable, but in future work the model will be
adapted for further different compositions and feeds.
The work carried out so far has provided
encouraging predictions for a larger range of
compositions. This will be developed into a user tool
for a greater understanding of how the composition
will affect the viscosity.
ACKNOWLEDGEMENTS
The author would like to thank Northern way and
Technology Strategy Board for part funding the
Knowledge Transfer Partnership. The author would
also like to thank Barbara Dunnett, National Nuclear
Laboratory for the initial guidance on this study.
0.01 0.015 0.02 0.025 0.03 0.035 0.04 0.045
0
1
2
3
4
5
6
Figure 4: Sensitivity graph for variable 25.
REFERENCES
Bhat, N. V. and T. J. McAvoy (1990) “Use of neural nets
for dynamical modelling and control of chemical
process systems”, Computers & Chemical
Engineering, 14, 573-583.
Bishop, C. (1995) Neural Networks for Pattern
Recognition. Oxford University Press: Oxford.
Bulsari, A. B., (Ed), (1995) Computer-Aided Chemical
Engineering, Vol.6, Neural Networks for Chemical
Engineers, Elsevier: Amsterdam.
Cybenko, G. (1989) “Approximation by superposition of a
sigmoidal function”, Math. Control Signal Systems, 2,
303-314.
Duchesne, M. A., Macchi, A., Lu, D.Y., Hughes, R. W.,
McCalden, D., J. Anthony, E. J., (2010) Artificial
neural network model to predict slag viscosity over a
broad range of temperatures and slag compositions -
Fuel Processing Technology, Volume 91, Issue 8,
Pages 831-836
Girosi, F. and T. Poggio (1990) “Networks and the best
approximation property”, Biological Cybernetics, 63,
169-179.
Lennox, B., Rutherford, P., Montague, G. A., Haughin, C.,
(1998) Case study investigating the application of
neural networks for process modelling and condition
monitoring – Computers & Chemical Enginerring,
Volume 22, Issue 11, Pages 1573-1579
Marquardt, D. (1963) “An algorithm for least squares
estimation of nonlinear parameters”, SIAM J. Appl.
Math., 11, 431-441.
Montgomery, D. C., Peck, E. A., Vining, G. G.,
Introduction to Linear Regression Analysis, Wiley
Series in Probability and Statistics
Narendra, K. S. and K., Parthasarathy (1990)
“Identification and control of dynamical systems using
neural networks”, IEEE Transactions on Neural
Networks, 1, 4-27.
Park, J. and I. W. Sandberg (1991) “Universal
approximation using radial basis function networks”,
Neural Computation, 3, 246-257.
Pham, D. T., Liu, X., (1995) Neural Networks for
Identification, Prediction and Control. Springer-Verlag
London Limited. 4th edition
Rumelhart, D. E., G. E. Hinton, and R. J. Williams,
“Learning internal representations by error
propagation”, in Parallel Distributed Processing,
(Eds) D. E. Rumelhart and J. L. McClelland, MIT
Press, 1986.
Steele, C. J., Dunnet, B., Riley, A. D., Ferguson, K.,
Gribble, N., Short, R., (2011) Viscosity of simulated
nuclear waste vitrified product International
Conference on the Chemistry of Glasses and Glass-
Forming Melts, To be published
Zhang, J., Morris, A. J., Martin, E. B., Kiparissides, C.,
(1998) Prediction of polymer quality in batch
polymerisation reactors using robust neural networks
Chemical Engineering Journal 69, Pages 135-143
MODELLING VITRIFIED GLASS VISCOSITY IN A NUCLEAR FUEL REPROCESSING PLANT USING NEURAL
NETWORKS
325
